
|
|
1.IntroductionThe liver is the largest internal organ of the body; it performs many complex functions, such as metabolic processing of dietary molecules, glycogen storage, detoxification of potentially harmful compounds, among a diverse range of functions. The treatment of liver damage and disease by conventional transplantation is limited by a shortage of available donor organs, the risk of rejection, and other complications caused by the need for lifelong immunosuppression. Therefore, the ability to produce hepatocytes in culture from stem cells, which could be transplanted to replace diseased or damaged liver tissue, is a very attractive prospect.1, 2, 3 Embryonic stem (ES) cells have the potential to become an alternative source of hepatocytes, available for transplantation therapy due to their limitless capacity for self-renewal and proliferation, and their ability to differentiate into all major cell lineages, including hepatocytes. To date, there has been some success in inducing mouse ES cells to form particular types of cells, such as cardiomyocytes, smooth muscle cells, neuron cells, and hepatocytes.4, 5 Normally, the derivation of hepatocyte-like cells from ES cells involves the formation of embryoid bodies, induction of the cells to form definitive endoderm, and subsequent differentiation and maturation of these cells into hepatocyte-like cells, with the isolation of cells based on immunocytochemistry. These techniques are expensive and can rely on subjective judgment by the operator. By contrast, infrared spectroscopic approaches promise low cost and rapid and potentially automated measurement for the screening of ES cell-derived populations destined for clinical transplantation.6 Fourier transform infrared (FTIR) microspectroscopy has proven to be a powerful technique to provide unique information about the biochemistry and molecular composition of cells and tissues.7, 8 This new technique is nondestructive of the sample, as well as less time consuming when compared to conventional immunostraining methods used to detect the expression of specific proteins by stem cells.9, 10 Currently, FTIR microspectroscopy has been applied to study ES cells differentiation to obtain “molecular fingerprints” of different individual human embryonic stem cells,11 human mesenchymal stem cells,12 to study the spontaneous differentiation of mouse ES cells to form ectodermal tissues,13 to verify symmetric [TeX:] ${\rm PO}_2^ - $ absorption bands as a marker of the putative stem cell regions in human intestinal crysts, in the small intestine, and in large bowel crypts,14, 15 to characterize human corneal stem cells by synchrotron infrared microspectroscopy,16 to track cell lineage of normal, and identify cancer squamous cell carcinoma.17 These works demonstrated that stem cells and their differentiated progeny can be identified by distinct FTIR spectral “phenotypes.” In this study, we aim to discriminate cells from the last stage of hepatocyte development from cells undergoing endoderm induction and those from hepatic initiation stages in a mouse model. We aim to use synchrotron FTIR microspectroscopy to probe the biochemistry of single hepatic progenitor cells and study their differentiation into hepatocyte-like cells. Furthermore, we wish to identify any characteristic absorbance changes during cell differentiation that would serve as information that can be used to discriminate the mature hepatocyte-like stage from stem cell progenitors at early stages of differentiation. 2.Materials and Methods2.1.Differentiation of Mouse ES Cells to Hepatocyte-like CellsThe in vitro differentiation of mouse embryonic stem cells into hepatocyst-like cells involves three steps: endoderm induction, hepatic initiation, and finally, maturation into hepatocyte-like cells. After 14 days of embryoid body (EB) formation, the trypsinized cells were cultured under a basic fibroblast growth factor (bFGF) treatment for two days to generate definitive endoderm. After a further two days of bFGF treatment, the cells were then treated with hepatocyte growth factor (HGF) for three days in order to form hepatic progenitor cells. Finally, after three days of HGF treatment, cells were further cultured with HGF/oncostatin M (OSM)/dexamethasone (DEX) (HGF/OSM/DEX) for three days to generate hepatocyte-like cells that showed cuboidal morphology typical of in vivo hepatocytes. HGF/OSM/DEX treatment was included in the last stage of the maturation process because this was reported to result in hepatocyte-like cells derived from ES cells.18 Mouse ES cells (mESCs-SUT-1, strain C57BL/6) were cultured on mouse embryonic fibroblasts for seven days in ES medium containing Dulbecco's modified eagle medium (DMEM) supplemented with 10% fetal bovine serum (FBS), 200 mM L-glutamine, 0.1 mM β-mercaptoethanol, 1x minimum essential amino acid, 1x penicillin/streptomycin, and 1000 IU/ml hLIF. The ES properties of the cultivated cells were confirmed by determination of cell surface markers (Oct-4, Sox-2, Nanog, SSEA-1, SSEA-3, SSEA-4, TRA-1–60, and TRA-1–81).The ES cells were trypsinized, and then the suspension was cultured in DMEM supplemented with 10% FBS, 200 mM L-glutamine, 0.1 mM β-mercaptoethanol, 1x minimum essential amino acid, and 1x penicillin/steptomycin for 14 days on bacterial dishes at 37 °C with 5% CO2 in air to generate EB formation.19 After 14 days, EBs were trypsinized to isolate external endodermal cells, plated on 0.2% gelatin-coated dishes, and cultured in DMEM supplemented with 200 mM L-glutamine in the presence of 100 ng/ml basic fibroblast growth factor (bFGF) for 2 days. Hepatocyte growth factor (HGF) was subsequently added to the culture medium, and the cells cultured for a three more days. Mature hepatocyte-like cells differentiated from definitive endoderm were prepared by trypsinizing the definitive endodermal cells and replating them on 0.362 mg/ml matrigel matrix containing 20 ng/ml HGF, 10 ng/ml oncostatin M (OSM), 100 nM dexamethasone (DEX), and a mixture of insulin, transferring, and selenious acid (5 mg/ml insulin, 5 mg/ml transferring, and 5 μg/ml selenious acid) and cultured for three days.20, 21 2.2.Magnetic Activated Cell SortingMagnetic activated cell sorting (MACS) was specifically employed to isolate and purify a special population of cells based on the cell surface marker definitive for hepatocytes. This technique has been shown previously to be highly effective for isolating the mature hepatocytes from mixed cell suspensions.22 The positive cells were collected and used for FTIR analysis. The cells were first stained with biotinylated anti-HNF3βrAb or albumin mAbs at 4 °C for 10 min. Cells were washed twice with PBS containing 0.5% BSA and 2 mmol/L ethylenediamine tetra-acetic acid. Enrichment of target cells by magnetic microbeads was carried out according to the manufacturer's protocol. Briefly, cells were resuspended in 80 μL of the same buffer per 107 cells and incubated with antibiotin microbeads for 15 min at 6–12°C. Cells were washed twice and finally resuspended in 500 μL of buffer per 107 total cells. A premoistened magnetic separation (MS) column was placed in the magnetic field of a suitable MACS separator. The cell suspension was applied onto the column and then washed three times. Effluents were collected as the negative fraction. Magnetically labeled cells, as the positive fraction, were collected by flushing the column with buffer after the column was placed outside of the magnetic field. The sorted cells were then further cultured in 95% air and 5% CO2 at 37 °C for another two days to remove the microbeads.22 2.3.Characterization of Differentiated HepatatocytesThe ES cell-derived hepatocyte-like cells were fixed with 4% paraformaldehyde solution for 30 min at room temperature, then washed three times with PBS (-), followed by incubation in a blocking solution for 2 h. The cells were subsequently incubated with the primary antibody mouse anti-α-fetoprotein (1:200, Sigma) and rabbit antimouse albumin (1:200, Abcam) overnight at 4 °C. After washing out the excess primary antibody, the cells were treated with second antibody conjugated with either Alexa 488 (1:1000, Invitrogen) or rhodomine (1:1000, Invitrogen) for 1 h. The cells were costained with 4’,6-diamidino-2-phenylindole (DAPI) for 5 min and then examined by fluorescence microscopy. Indocyanine green (ICG) (Sigma) was dissolved in 5 ml of solvent in a sterile vial and then added to 20 ml of α-MEM containing 10% FBS. The final concentration of the resulting ICG solution was 1 mg/ml. The ICG solution was added to the cell culture dish and incubated at 37 °C for 15 min. After the dish was rinsed three times with PBS, the cellular uptake of ICG was examined using a stereomicroscope. After the microscopic examination, the dish was refilled with DMEM containing 10% FBS. ICG was completely eliminated from the cells 6 h later. Differentiated hepatocyte-like cells were immersed in periodic acid solution for 5 min at room temperature and rinsed three times with distilled water. Cells were treated with Schiff's reagent (Sigma) for 15 min at room temperature, washed in running tap water for 5 min, and examined by light microscopy.18 2.4.Fourier Transform Infrared MicrospectroscopyCell cultures were washed with 0.85% NaCl and centrifuged to obtain a cell pellet. Each pellet was washed twice with 0.85% NaCl and resuspended in 50 μl of saline. The number of cells was counted with heamocytometer. All test samples were resuspended in an appropriate volume of saline to give a final concentration of 106 cells/ml. A drop of 5 μl of each sample was deposited onto IR-transparent 2-mm-thick barium fluoride (BaF2) windows, air dried, and stored in a desiccator until spectra were acquired. Spectra data were collected at an infrared microspectroscopy beamline (2BM1B) at the Australian Synchrotron, Melbourne, Australia. Spectra were acquired with a Vertex 80v FTIR spectrometer (Bruker Optics, Ettlingen, Germany) coupled with an IR microscope (Hyperion 2000, Bruker) with an MCT detector cooled with liquid nitrogen over the measurement range from 4000 to 800 cm−1. The microscope was connected to a software-controlled microscope stage and placed in a specially designed box that was purged by dry air. The measurements were performed in the mapping mode, using an aperture size of 5 × 5 μm with a spectral resolution of 6 cm−1, with 64 scans co-added. This aperture allowed measurements that resulted in spectra that were representative unambiguously of individual cells. The spectral resolution was a good compromise for biospectroscopic measurements having adequate resolution to reveal a band of biological origin, but broad enough to smooth features that result from absorbance of atmospheric water in the IR beam path. The number of coadded scans was chosen from a series of preliminary trials (data not shown) as a good compromise between achieving spectra with good signal-to-noise characteristics and the rapid acquisition of data. Spectra were processed using Happ–Genzel appodization and 2 × zero filling. Spectral acquisition and instrument control was performed using Opus 6.5 control software (Bruker). 2.5.Statistical AnalysisSpectra from mapping arrays were quality tested by visual inspection such that spectra with weak absorbance (amide I band maximum absorbance <0.2), acquired from regions of the sample where there were no cells, or spectra with very high absorbance (amide I band maximum absorbance >0.8), acquired from regions where cells may have been clumped or overlaid) were rejected from the analysis. Spectra from sample groups based on differentiation time were analyzed using principal component analysis (PCA)23 and partial least-squares discriminant analysis (PLS-DA).24 Preprocessing of the data was conducted by first performing a second derivative by the Savitzky–Golay method (nine smoothing points) and then normalized using extended multiplicative signal correction (EMSC)25, 26 using the spectral regions from 3000 to 2800 cm−1 and from 1800 to 1000 cm−1 using The Unscrambler 9.7 software (CAMO, Oslo, Norway). Score plots were used to visualize any clustering of the data, and the loading plot was used to determine which spectral regions contributed most to the variance in the data set, accounting for any clustering of spectra seen in scores plots. Calibration and validation of spectral data were employed using data sets that were randomly selected comprising two-thirds and one-third of the spectra, respectively. PLS-DA employed PCA models derived from calibration sets and was used to test the ability to discriminate different cell types using the independent validation set spectra. 2.6.Unsupervised Hierarchical Cluster AnalysisUnsupervised hierarchical cluster analysis (UHCA) was performed on second derivative spectra using Ward's algorithm, which utilizes a matrix-defining interspectral distance to identify the most similar IR spectra. Spectral distances were calculated as D-values.27 3.Results3.1.Confirmation of Hepatic Differentiation by ImmunofluorescenceConfirmation of the hepatic protein expression was probed by immunostaining, as described above. At the last stage of the maturation process, differentiated hepatocyte-like cells are expected to express proteins characteristic of mature allbumin and the α-feto-protein. Indeed, at the last stage of maturation, hepatocyte-like cells secreted a high abundance of α-feto protein and albumin, as presented by the immunostaining method seen in Figs. 1a, 1b, respectively. Albumin is the most abundant protein synthesized by mature hepatocytes and contributes to maintaining oncotic pressure as well as being involved with the transport of hydrophobic molecules.28 Fig. 1Cellular and functional characterization of hepatocyte cells at the last stage of the maturation process. Immunocytochemical analysis of expression of α-fetoprotein and albumin production. (a) shows α-fetoprotein, (b) shows DAPI-stained nuclei and (c) overlayed. (d) shows albumin, (e) DAPI-stained nuclei and (f) overlayed. The scale bars represents 100 μm in (a-c) and 200 μm in (d-f). 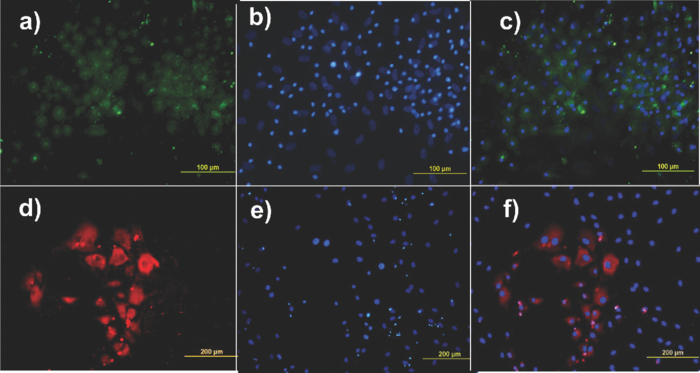 The presence of glycogen was confirmed by positive staining of glycogen granules with purple staining where glycogen is present in mature hepatocyte-like cells. Cells were positive for PAS straining, indicative of glycogen storage, a characteristic of mature hepatocytes [Fig. 2a]. Fig. 2(a) Glycogen storage determined by periodic acid-Schiff staining and (b) cellular uptake of indocyanine green into mature hepatocytes at the last stage of the maturation process.  ICG is an organic anion that is used as a test substance to examine liver function. ICG is tricarboxylic acid compound that is taken up and secreted by hepatocytes. Therefore, cellular uptake of ICG was used to identify differentiated hepatocyte-like cells. ICG-positive cells were detected in the cultured cell suspension [Fig. 2b]. 3.2.Fourier Transform Infrared Microspectroscopy Analysis of Hepatocyte-Like Cells and Their ProgenitorsIn order to generate a high percentage of functional hepatocyte-like cells, it is important to establish not only an appropriate culture system for cell differentiation, but also a practical method for identifying differentiated hepatocysts. The FTIR microspectroscopy technique provides a new method to identify spectroscopic features indicative of endoderm induction, hepatic initiation, and mature hepatocyte-like cells. The infrared spectrum of biological samples can provide spectral information pertaining to nucleic acids, proteins, carbohydrates, and lipids in the spectral domain between 1800 and 800 cm−1, known as the “fingerprint region” of the FTIR spectrum. By using SR-FTIR microspectroscopy, it was possible to discriminate the three different cell populations—induced endoderm cells, cells undergoing hepatic initiation, and mature hepatocyte-like cells at a single-cell level. This was enabled by using the high brightness synchrotron infrared radiation source at Australian Synchrotron, where infrared light was focused to a small spot at the sample with a focal-plane aperture in the IR microscope of 5 × 5 μm. Protein absorbance in the amide I region of the FTIR spectrum (∼1700–1580 cm−1) is sensitive to the prediction of secondary protein structure. The two major band envelopes of the amide I and amide II of the protein arise from specific stretching and bending vibrations of the protein backbone. The amide I band arises predominantly from C = O stretching vibration (80%) of the amide C = O group and C-N stretching vibration (20%). The amide II vibration frequency occurs from N-H bending vibration (60%) coupled with C-N stretching (40%). The spectral region between 1700 and 1500 cm−1 is dominated by the amide I and amide II bands. This region can be used to discriminate secondary structures of protein, especially in the amide I band region between 1700 and 1600 cm−1, which can give information about α-helix, β-sheet, and turn secondary structures. There are three spectral features that can be assigned to α-helix (centered at ∼1650 cm−1), β-sheet (centered at ∼1630 cm−1) and turn (centered at ∼1685 cm−1) secondary structure components. However, it must be said that the amide I maximum is known to shift in response to light-scattering effects, such as resonant Mie scattering,29 and hence, any interpretations of changes in protein confirmation based on the amide I band must be considered in this context. The average FTIR absorbance spectra of mature hepatocyte-like cells and their less differentiated precursor cells are shown in Fig. 3a. It was difficult to observe spectral differences between different cell types by examining the raw spectra alone. Indeed, to be able to visualize spectral changes occurring throughout the cell-differentiation process, the second derivative spectrum was performed, which gives a minimum peak for vibrational bands and allows easier identification of individual peaks that may be superimposed in the raw spectra. The integrated area of the amide I was more intense in the last stage of hepatocyte differentiation compared to endodermal cells [p < 0.05 by ANOVA; Figs. 3b, 3c]. The major intensity for the amide I band in the spectra of hepatocyte-like cells was centered at 1656 cm−1, which was ascribed to α-helix protein secondary structure. These results suggested that during the differentiation process of mature hepatocyte-like cells, there appeared to be an increase of specific proteins that have a predominantly α-helix structure. These results can be explained by the emergence of albumin protein during hepatocyte differentiation, which is rich in α-helix content,30 and in agreement with an increase in albumin levels detected by immunostaining. The β-sheet secondary structure centered at 1627 cm−1 in the hepatic progenitor cells was shifted to 1641 cm−1 in the maturation process. The amide II absorbance was predominant in the stage of endoderm induction [p < 0.05, by analysis of variance (ANOVA)]. These results indicate that different proteins are expressed during differentiation following endoderm induction, and subsequent differentiation of hepatocyte-like cells from hepatic progenitor cells. By contrast, the endoderm induction stage was shown to have low absorbance intensity for lipid bands, which increased with the differentiation of the hepatic progenitor cells. Finally, lipid band intensity significantly decreased through the last stage of the maturation process to the formation of the hepatocyte-like cells (Fig. 3). Fig. 3(a) Average raw FTIR spectra of endoderm induction, hepatic progenitor cells, and maturation into hepatocytes. A total of 135 spectra, 214 spectra, and 110 spectra of endoderm induction, hepatic initiation, and maturation, respectively, were measured with 64 scans co-added for each individual spectra. (b) Average second-derivative spectra after nine points of smoothing and normalization with extended multiplicative signal correction over the spectral range of 4000–1000 cm−1. (c) The relative areas (in percent) were calculated for lipids by the integral area of the curve for lipid (ester carbonyl centered at 1741 cm−1 and C-H stretching (3000–2800 cm−1) vibration, for amide I protein (1700–1600 cm−1), for amide II protein (1600–1500 cm−1). The relative integrated area (in percent) of the macromolecular component was calculated in normalized second-derivative infrared spectra by using OPUS 6.5 software. The differences between the means of the percentages of relative integral areas of three biochemical components were significantly different among three groups by ANOVA. Data are given as means ± SD; p < 0.05 was accepted as significantly different between mature hepatocytes and other groups. Error bars indicate standard errors of the means.  3.3.Statistical AnalysisFTIR microspectroscopy combined with multivariate data analysis, in particular PCA, has been applied to explain biochemical changes occurring during cellular differentiation.11 PCA of biospectroscopic data provide two types of information: visualization of clustering of similar spectra within data sets in scores plots and identification of variables (spectral bands representing various molecular groups within the samples) in loadings plots explaining the clustering observed in the scores plots. PCA enabled us to identify the most significant spectral changes that occurred during hepatic differentiation, from endoderm induction to the hepatic progenitor cells, and subsequent maturation of these into hepatocyte-like cells. The PCA score plot shows that spectra from endoderm induction, hepatic progenitor cells, and mature hepatocyte-like cells can be clustered separately along PC1 and PC2. Spectra from mature hepatocyte-like cells could be distinguished from less differentiated cell by having positive PC1 scores [Fig. 4a] In general, spectral loadings were dominated by changes in protein bands (1600–1500 cm−1) and lipid bands (3000–2800 cm−1). Variation in the lower wavenumber region of the spectrum below 1500 cm−1 appeared to contribute less to the observed clustering in the scores plot. However, small loadings at 1240 and 1085 cm−1, attributed to the asymmetric and symmetric phosphodiester stretching bands, may have been due to differences in nucleic acids and other phosphorylated molecules between the hepatocyte-like cells and less differentiated cell types. The reason why changes in these bands are not very prominent in the data set may be due to use of dried samples, because previous FTIR studies have shown that band information from nucleic acids can be obscured in dried cells.31 The greatest spectral variation indicated by the PC1 loadings plot was found in the amide I region of the IR spectrum. Opposite PC1 loadings at 1656 and ∼1627 cm−1 [Fig. 4b] may reflect differences in protein secondary between hepatic progenitor cells and mature hepatocyte-like cells, observed in the second derivative spectra (Fig. 3). The negative PC1 loading at 1656 cm−1 may indicate higher levels of α-helix protein secondary structure in mature hepatocyte-like cells compared to progenitor cells; whereas the positive loading at 1627 cm−1 could be interpreted as higher levels of a β-sheet secondary structure in the progenitor compared to mature hepatocyte-like cells, explaining spectra from definitive endoderm and hepatic progenitor cells clearly separating along PC2 with hepatic progenitor cells having positive PC2 scores. The separation along PC2 can also be explained by the negative loading for PC2 in the spectral region corresponding to total lipid (CH2, CH3 stretching) centered at 2852 and 2923 cm−1, which was oppositely correlated with positive loadings for amide I absorbance at 1656 cm−1. The heavy negative loadings for the C–H stretching bands was correlated with the intense lipid ester carbonyl band loading at 1740 cm−1, indicating higher lipid levels in hepatic progenitor cells compared to mature hapatocytes [Fig. 4b]. Fig. 4PCA analysis of mouse hepatocyte cells, endoderm induction, and hepatic progenitor cells using the same spectral data sets as described in Fig. 3. (a) Score plot and (b) loading plot of independent spectra acquired from SR-IR mapping. The chemical composition of the three groups was classified with the PC1 versus PC2 score plots. PC1 and PC2 explained 29 and 21% of the total variance, respectively. Spectra were derived using second-derivative processing with the entire biochemical cell fingerprint region (1800–900 cm−1) and (3000–2800 cm−1). 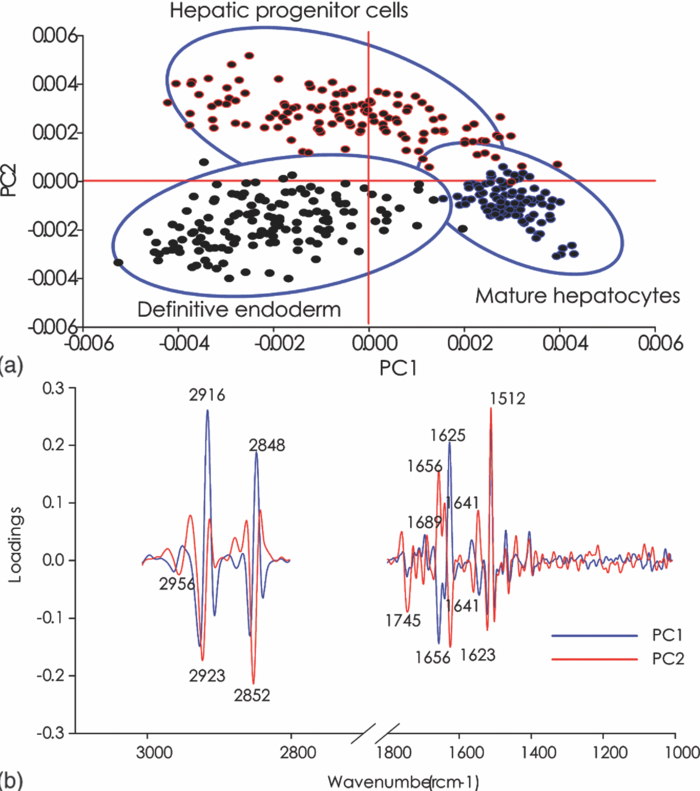 3.4.Unsupervised Hierarchical Cluster AnalysisHierarchical cluster analysis (HCA) was performed to identify similarities and differences between spectra from different cell types using spectral information in the ranges of 3000–2800 and 1800–900 cm−1. The dendrogram represented in Fig. 5 permits the identification of three major clusters of spectra. Significantly, the spectra within the upper branch (branch A) were clearly separated from other branches and clustered spectra from cells from the last stage of maturation process. Whereas, spectra from mature hepatocyte-like cells in branch A were separated from two further clusters corresponding to spectra from hepatic progenitor cells (branch B1) and definitive endoderm (branch B2), respectively. This is further evidence for the distinct FTIR spectral profiles corresponding to the three cell types as revealed by PCA and described above. Fig. 5Dendrogram obtained by cluster analysis of endoderm induction, hepatic progenitor cells and mature hepatocyte-like cells using the same spectral data sets as described in Fig. 3. Cluster analysis was employed by Ward's algorithm using the second derivative and then vector normalized over the spectra region from 3000 to 2800 cm−1 and 1800 to 900 cm−1. Note that the larger the separation between clusters is, indicated by connecting lines, the lower the similarity of the spectra is. 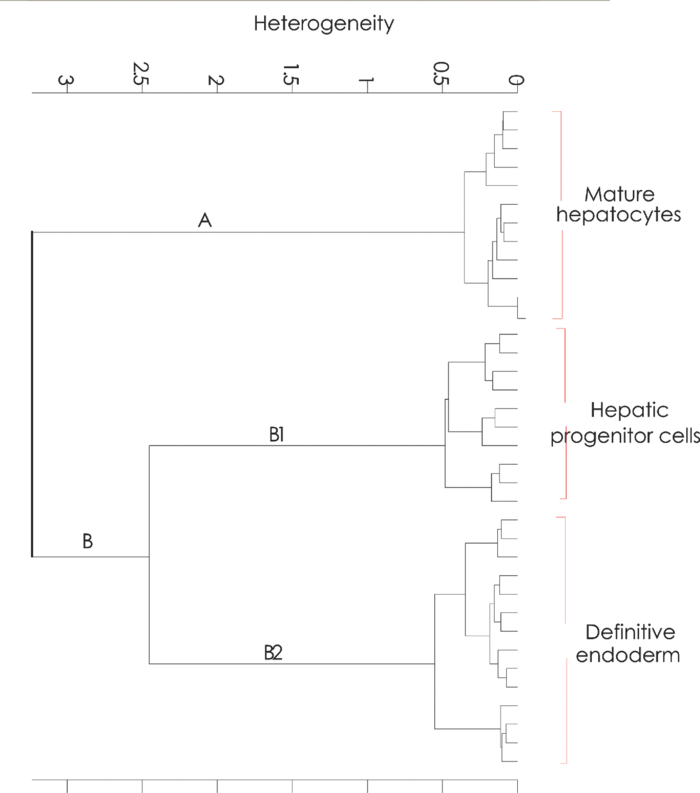 3.5.PLS-DA ModelingPLS-DA was applied to classify spectra from the three differentiation stages: endoderm induction, hepatic progenitor cells, and mature hepatocyte-like cells. This technique is based on observation of linear correlations within the data set between two factors, X and Y. In the present study, X is multivariate, representing the absorbance value for each wavenumber from the spectrum. Three Y variables were set as a code for each cluster class using nominal value of either +1 or 0. The PLS model was then used to predict Y values for an independent set of validation spectra, the results of which formed the basis for the classification result. The correlation coefficient of 0.96 indicated the data was well modeled [Fig. 6a]. PLS-DA accurately classified the three groups of validation spectra with 93.8, 96, and 93.2% of spectra correctly assigned to mature hepatocyte-like, hepatic progenitor, and endoderm induction cells, respectively [Fig. 6b]. Fig. 6PLS-DA modeling for the calibration and training set based on observation of linear correlation within the data set. (a) The calibration (training) set was plotted and measured Y against predicted Y (mature = +1, endoderm induction = 0 and hepatic progenitor cells = 0). (b) The validation set was used to predict Y using the PLS-DA model. All spectra were clearly classified, as indicated the 94% correct classification for the independent validation set.  4.DiscussionThe analysis of mouse hepatocytes at the single-cell level with FTIR spectroscopy is challenging. We found that using the small aperture sizes necessary to target individual human ES and progenitor cells (∼20 × 20 μm) using laboratory-based FTIR microspectrometers results in spectra with signal-to-noise ratios that are too poor to be used for analysis (data not shown). By contrast, synchrotron-based FTIR microspectroscopy (SR-FTIR) provides IR light that is several hundred times brighter compared to laboratory IR sources, which enabled spectra to be acquired from single stem cells with good signal-to-noise characteristics.32, 33, 34 In this study, IR mapping was used over an extended area within each of the samples in order to record IR spectra consecutively from cells each position, in an efficient automated manner. Nevertheless, this technique relies on serial mapping of single spectra across the sample. Recently, multichannel focal plane array (FPA) IR detectors have been coupled to FTIR microscopes, allowing thousands of spectra to be obtained in a single measurement, vastly speeding up data acquisition. However, FPA-based systems trade off spatial resolution for gains in acquisition speed when compared to synchrotron-based mapping measurements.35 These results demonstrate that FTIR microspectroscopy could be used to evaluate biochemical changes that occur during hepatocyte differentiation from mouse stem cells. Moreover, we were able to demonstrate that the three stages of hepatocyte differentiation that were studied could be discriminated with high levels of sensitivity and sensitivity using PLS-DA. This ability to discriminate the cells based on FTIR spectroscopy was further corroborated by the fact that spectra from cells from the three experimental classes readily clustered into groups based on spectral similarity using UHCA. The ability to discriminate stem cells from their differentiated progeny demonstrated in this study is supported by a growing body of similar findings, where infrared spectroscopy has been used to probe differentiation in adult12, 14 and embryonic stem cells.11 The pronounced changes in lipid and protein components within stem cells upon differentiation reported in this study supports previous observations in the literature. The decrease in lipid levels observed upon differentiation of hepatocyte-like cells is similar to that observed when human embryonic stem cells were differentiated toward ectodermal and mesendodermal cell lineages,11 but opposite to the lipid increases observed when mouse embryonic stem cells were differentiated to form neuronal cells.36 These differences in the response of lipid composition to stem cell differentiation may reflect differences in stem cell type, the direction of type of cells formed by the differentiation process, or the environmental condition under which the stem cells are maintained and under which the differentiation proceeds (e.g., serum-free versus growth media–containing sera). The changes in protein absorbance reported in this study involve changes both the total amount of protein and type of protein formed. The latter was deduced by changes in the amide I band that suggested that changes in protein secondary structure occurred during differentiation of the hepatocyte-like cells. Protein secondary changes have reported in FTIR spectroscopy studies of differentiation of mouse stem cells.36 However, as mentioned above, the amide I band is sensitive to shifts in the absorbance maxima by light-scattering effect, particularly the recently described resonant Mie scattering,29 meaning that any changes protein structure interpreted from the amide I band must be considered carefully. In our study, changes in the amide I band involved the appearance of new band features, readily identified from the second derivative spectra, rather than simple shifts in the band maxima. In our opinion, this is more likely to be associated with changes in protein composition of the cells, rather than the effect of light scattering. Moreover, the protein secondary structure changes inferred from the FTIR spectra is corroborated by changes in proteins known to occur in hepatocyte differentiation, such as the formation of albumin. Parallel proteomic studies are required to confirm these views. In summary, these studies support the view that FTIR spectroscopy is a new experimental modality for sorting early stages of stem cell differentiation. The noninvasive nature of the FTIR spectroscopic measurement makes it particularly suited to sorting of aliquots of cells destined for use in regenerative medicine practice in the future, making it complimentary to existing approaches, such as MACS. Of course, the spectroscopic analysis would need to be progressed to living cells to make this aim a reality. At present, this would necessarily require the use of synchrotron light to obtain enough through-put with the live cells to achieve measurements with an adequate signal-to-noise ratio.37 In our opinion, this study represents the first steps toward achieving this aim. ReferencesN. Navarro-Alvarez, A. Soto-Gutierrez, and
N. Kobayashi,
“Hepatocyte transplantation: a step forward,”
Curr. Opin. Organ Transplant, 12
(6), 652
–658
(2007). https://doi.org/10.1097/MOT.0b013e3282f19f42 Google Scholar
N. Navarro-Alvarez, A. Soto-Gutierrez, J. D. Rivas-Carrillo, I. J. Fox, N. Tanaka, and
N. Kobayashi,
“Stem cell-derived hepatocytes,”
Curr. Opin. Organ Transplant, 11
(6), 659
–664
(2006). https://doi.org/10.1097/MOT.0b013e3280109b7d Google Scholar
A. Soto-Gutierrez, H. Basma, N. Navarro-Alvarez, B. E. Uygun, M. L. Yarmush, N. Kobayashi, and
I. J. Fox,
“Differentiating stem cells into liver,”
Biotechnol. Genet. Eng. Rev., 25 149
–164
(2008). Google Scholar
K. A. D’Amour, A. D. Agulnick, S. Eliazer, O. G. Kelly, E. Kroon, and
E. E. Baetge,
“Efficient differentiation of human embryonic stem cells to definitive endoderm,”
Nat. Biotech., 23
(12), 1534
–1541
(2005). https://doi.org/10.1038/nbt1163 Google Scholar
N. Lavon and
N. Benvenisty,
“Study of hepatocyte differentiation using embryonic stem cells,”
J. Cell. Biochem., 96 1193
–1202
(2005). https://doi.org/10.1002/jcb.20590 Google Scholar
P. Heraud and
M. J. Tobin,
“The emergence of biospectroscopy in stem cell research,”
Stem Cell Res., 3
(1), 12
–14
(2009). https://doi.org/10.1016/j.scr.2009.04.002 Google Scholar
F. L Martin, J. G. Kelly, V. Liabjani, P. L. Martin-Hirsch, I. I. Patel, J. Trevisan, N. J. Fullwood, and
M. J. Walsh,
“Distinguishing cell types or populations based on the computational analysis of their infrared spectra,”
Nat. Protocols, 5 1748
–1760
(2010). https://doi.org/10.1038/nprot.2010.133 Google Scholar
D. Naumann, J. Kneipp, C. Kirschner, N. A. N. Thi, and
P. Lasch,
“FT-IR microspectroscopy of cells and tissues,”
Microbeam Analysis 2000, 61
–62 Inst. of Phys. Publ., Philadelphia
(2000). Google Scholar
P. Dumas and
L. Miller,
“The use of synchrotron infrared microspectroscopy in biological and biomedical investigations,”
Vib. Spectrosc., 32
(1), 3
–21
(2003). https://doi.org/10.1016/S0924-2031(03)00043-2 Google Scholar
D. Naumann,
“Infrared spectroscopy in microbiology,”
Encyclopedia of Analytical Chemistry: Applications, Theory, and Instrumentation, 102
–131 Wiley, Hoboken, NJ
(2001). Google Scholar
P. Heraud, E. S. Ng, S. Caine, Q. C. Yua, C. Hirst, R. Mayberry, A. Bruce, B. R. Wood, D. McNaughton, E. G. Stanley, and
A. G. Elefanty,
“Fourier transform infrared microspectroscopy identifies early lineage commitment in differentiating human embryonic stem cells,”
Stem Cell Res., 4
(2), 140
–147
(2010). https://doi.org/10.1016/j.scr.2009.11.002 Google Scholar
C. Krafft, R. Salzer, S. Seitz, C. Ern, and
M. Schieker,
“Differentiation of individual human mesenchymal stem cells probed by FTIR microscopic imaging,”
Analyst, 132
(7), 647
–653
(2007). https://doi.org/10.1039/b700368d Google Scholar
A. D. Ami, T. Neri, A. Natalello, P. Mereghetti, S. M. Doglia, M. Zanoni, M. Zuccotti, S. Garagna, and
C. A. Redi,
“Embryonic stem cell differentiation studied by FT-IR spectroscopy,”
Biochim. Biophys. Acta-Mol. Cell Res., 1783
(1), 98
–106
(2008). https://doi.org/10.1016/j.bbamcr.2007.08.003 Google Scholar
M. J. Walsh, T. G. Fellous, A. Hammiche, N. J. Fullwood, O. Grude, F. Bahrami, J. M. Nicholson, M. Cotte, J. Susini, H. M. Pollock, M. Brittan, P. L. Martin-Hirsch, M. R. Alison, and
F. L. Martin,
“Fourier transform infrared microspectroscopy identifies symmetric [TeX:] ${\rm PO}_2^ - $ modifications as a marker of the putative stem cell region of human intestinal crypts,”
Stem Cells, 26
(1), 108
–118
(2008). https://doi.org/10.1634/stemcells.2007-0196 Google Scholar
M. J. Walsh, A. Hammiche, T. G. Fellous, J. M. Nicholson, M. Cotte, J. Susini, N. J. Fullwood, P. L. Martin-Hirsch, M. R. Alison, and
F. L. Martin,
“Tracking the cell hierarchy in the human intestine using biochemical signatures derived by mid-infrared microspectroscopy,”
Stem Cell Res., 3 15
–27
(2009). https://doi.org/10.1016/j.scr.2009.02.003 Google Scholar
A. J. Bentley, T. Nakamura, A. Hammiche, H. M. Pollock, F. L. Martin, S. Kinoshita, and
N. J. Fullwood,
“Characterization of human corneal stem cells by synchrotron infrared micro-spectroscopy,”
Mol. Vis., 13
(27–28), 237
–242
(2007). Google Scholar
J. G. Kelly, T. Nakamura, S. Kinoshita, N. J. Fullwood, and
F. L. Martin,
“Evidence for a stem-cell lineage in corneal squamous cell carcinoma using synchrotron-based Fourier-transform infrared microspectroscopy and multivariate analysis,”
Analyst, 135 3120
–3125
(2010). https://doi.org/10.1039/c0an00507j Google Scholar
T. Yamada, M. Yoshikawa, S. Kanda, Y. Kato, Y. Nakajima, S. Ishizaka, and
Y. Tsunoda,
“In vitro differentiation of embryonic stem cells into hepatocyte-like cells identified by cellular uptake of indocyanine green,”
Stem Cells, 20
(2), 146
–154
(2002). https://doi.org/10.1634/stemcells.20-2-146 Google Scholar
D. Choi, H. J. Lee, S. Jee, S Jin, S. K. Koo, S. S. Paik, S. C. Jung, S. Y. Hwang, K. S. Lee, and
B. Oh,
“In vitro differentiation of mouse embryonic stem cells: Enrichment of endodermal cells in the embryoid body,”
Stem Cells, 23
(6), 817
–827
(2005). https://doi.org/10.1634/stemcells.2004-0262 Google Scholar
A. Soto-Gutierrez, N. Navarro-Alvarez, D. Zhao, J. D. Rivas-Carrillo, J. Lebkowski, N. Tanaka, I. J. Fox, and
N. Kobayashi,
“Differentiation of mouse embryonic stem cells to hepatocyte-like cells by co-culture with human liver nonparenchymal cell lines,”
Nat. Protocols, 2
(2), 347
–356
(2007). https://doi.org/10.1038/nprot.2007.18 Google Scholar
N. Shiraki, K. Umeda, N. Sakashita, M. Takeya, K. Kume, and
S. Kume,
“Differentiation of mouse and human embryonic stem cells into hepatic lineages,”
Genes Cells, 13
(7), 731
–746
(2008). https://doi.org/10.1111/j.1365-2443.2008.01201.x Google Scholar
Y. F. He, Y. K. Liu, D. M. Gao, J. Chen, and
P. Y. Yang,
“An efficient method of sorting liver stem cells by using immuno-magnetic microbeads,”
World J. Gastroenterol., 12
(19), 3050
–3054
(2006). Google Scholar
K. Pearson,
“On lines and planes of closest fit to systems of points in space,”
Philos. Mag., 2
(6), 559
–572
(1901). Google Scholar
P. Geladi,
“Notes on the history and nature of partial least squares (PLS) modelling,”
J. Chemomet., 2 231
–246
(1988). https://doi.org/10.1002/cem.1180020403 Google Scholar
H. Martens, J. P. Nielsen, and
S. B. Engelsen,
“Light scattering and light absorbance separated by extended multiplicative signal correction: application to near infrared transmission analysis of powder mixtures,”
Anal. Chem., 75 394
–404
(2003). https://doi.org/10.1021/ac020194w Google Scholar
P. Heraud, B. R. Wood, B. J. Beardall, and
D. McNaughton,
“Effects of pre-processing of Raman spectra on in vivo classification of nutrient status of microalgal cells,”
J. Chemomet., 20 193
–197
(2006). https://doi.org/10.1002/cem.990 Google Scholar
J. B. MacQueen,
“Some methods for classification and analysis of multivariate observations,”
(1967). Google Scholar
H. Y. Pei, Y. F. Wang, and
X. T. Pei,
“Differentiation of human embryonic stem cells along a hepatocyte lineage and its application in liver regeneration,”
Chin. Sci. Bull., 53
(1), 1
–7
(2008). https://doi.org/10.1007/s11434-008-0026-x Google Scholar
P. Bassan, H. J. Byrne, F. Bonnier, J. Lee, P. Dumas, and
P. Gardner,
“Resonant Mie scattering in infrared spectroscopy of biological materials—understanding the dispersion artefact,”
Analyst, 134 1586
–1593
(2009). https://doi.org/10.1039/b904808a Google Scholar
R. A. Laskowski, E. G. Hutchinson, A. D. Michie, A. C. Wallace, M. L. Jones, and
J. M. Thornton,
“PDBsum: a Web-based database of summaries and analyses of all PDB structures,”
Trends Biochem. Sci., 22 488
–490
(1997). https://doi.org/10.1016/S0968-0004(97)01140-7 Google Scholar
D. R. Whelan, K. R. Bambery, P. Heraud, M. J. Tobin, M. Diem, D. McNaughton, and
B. R. Wood,
“Monitoring the reversible B to A-like transition of DNA in eukaryotic cells using Fourier transform infrared spectroscopy,”
Nucl. Acids Res.,
(2011). https://doi.org/10.1093/nar/gkr175 Google Scholar
P. Dumas,
“Microanalysis and imaging capabilities of synchrotron infrared microscopy,”
J. Phys. IV France, 104 359
–364
(2003). https://doi.org/10.1051/jp4:20030100 Google Scholar
P. Dumas, G. D. Sockalingum, and
J. Sule-Suso,
“Adding synchrotron radiation to infrared microspectroscopy: what's new in biomedical applications?,”
Trends Biotechnol., 25
(1), 40
–44
(2007). https://doi.org/10.1016/j.tibtech.2006.11.002 Google Scholar
L. M. Miller, G. D. Smith, and
G. L. Carr,
“Synchrotron-based biological microspectroscopy: from the mid-infrared through the far-infrared regimes,”
J. Biol. Phys., 29 219
–230
(2003). https://doi.org/10.1023/A:1024401027599 Google Scholar
E. Levenson, P. Lerch, and
M. C. Martin,
“Infrared imaging: synchrotrons vs. arrays, resolution vs. speed,”
Infrared Phys. Technol., 49 45
–52
(2006). https://doi.org/10.1016/j.infrared.2006.01.026 Google Scholar
W. Tanthanuch, K. Thumanu, C. Lorthongpanich, P. Heraud, and
R. Parnpai,
“Neural differentiation of embryonic stem cells studied by FT-IR spectroscopy,”
J. Mol. Struct., 967
(1–3), 189
–195
(2010). https://doi.org/10.1016/j.molstruc.2010.01.007 Google Scholar
M. Tobin, L. Puskar, R. Barber, E. Harvey, P. Heraud, B. Wood, K. Bambery, C. Dillon, and
K. Munroe,
“FTIR spectroscopy of single live cells in aqueous media by synchrotron IR microscopy using microfabricated sample holders,”
Vib. Spectrosc., 53
(1), 34
–38
(2010). https://doi.org/10.1016/j.vibspec.2010.02.005 Google Scholar
|


