
|
|
1.IntroductionLaser polarimetry (polarization sensitive optical coherence tomography, Mueller matrix decomposition formalism, coherency matrix analysis, etc.) 1, 2, 3, 4, 5, 6, 7, 8, 9, 10, 11, 12, 13, 14, 15, 16, 17, 18, 19, 20, 21, 22, 23, 24, 25, 26, 27, 28, 29 is able to obtain information about optical anisotropy (linear retardance, optical activity, dichroism, etc.) of biological tissues (BT). It has the potential to be an important technology for noninvasive diagnostics of organic phase-inhomogeneous layers. One model approach underlies these researches, which generalizes the optical properties of BT:5, 6, 14, 21, 30
Specifically, the above-mentioned model was used for finding and substantiating the interrelations between the ensemble of statistic moments of the first to fourth orders that characterize the orientation-phase structure (distribution of optical axes and phase shifts for directions of protein fibril networks) of birefringent BT architectonics and of 2-D distributions for azimuths and ellipticities in their laser images.5 It was determined 6, 7, 14, 15, 20, 23, 27, 28 that the third and fourth statistic moments for coordinate distributions of ellipticities are the most sensitive to the change (caused by dystrophic and oncological processes) of optical anisotropy inherent to protein crystals. On this basis, the criteria for early diagnostics of muscle dystrophy, precancer states of connective tissue, collagenoses, etc., were determined. In parallel with traditional statistical investigations, formed in the most recent 10–15 years is the new optical approach to describe a structure of polarization inhomogeneous fields, in the case of scattered coherent radiation. The main feature of this approach is the analysis of definite (in contrast to continuous 2-D distributions) polarization states to determine the whole structure of coordinate distributions for azimuths and ellipticities of polarization. The so-called polarization singularities are commonly used as these states: 31, 32, 33, 34, 35, 36, 37 states with linear polarization, when the direction of rotation for the electric field vector is indefinite, the so-called L-points, and circularly polarized states, when the azimuth of polarization for the electric field vector is indefinite, the so-called C-points. Investigations of polarization inhomogeneous object fields for BT with different morphology allowed ascertaining that they possess a developed network of L- and C-points.36 For example in Ref. 37, the authors found interrelations between conditions providing formation of polarization singular points and particularity of the orientation-phase structure of biological crystals present in the territorial matrix of the human tissue architectonic network. These interrelations served as a base to make statistical and fractal analyses of distribution densities for the number of singular points in BT images. As a result, the authors confirmed the efficiency of this method for investigation of object fields to differentiate optical properties of BT with a different morphological structure and physiological state. It is worth noting that the singular approach is mainly used out of the analysis of the mechanisms providing formation of polarization inhomogeneous laser images of BT by an extracellular matrix. Thus, development of laser-polarimetric techniques based on determination of singular interrelations “object-field” in order to find new methods of diagnostics of transformation of the BT extracellular matrix orientation-phase structure related with precancer changes in their physiological state is very important. To solve this problem, we should revert to the analysis of optical properties of biological crystal networks because these properties are comprehensively described by the Mueller matrix within the framework of the singular approach. 2.Brief Theory of the Singular Approach in the Analysis of Biological Tissue Birefringent NetworksTo analytically describe the L- and C-states of polarization, the most suitable is to use the extreme values of the fourth Stokes vector parameter. It is a widely applied mean and appears to be reasonable to represent these singularities as follows: Eq. 2[TeX:] \documentclass[12pt]{minimal}\begin{document}\begin{equation} \left\{ \begin{array}{l} V_4 = \sin 2\beta, \\[3pt] V_4 = 0 \leftrightarrow L(\beta = 0), \\[3pt] V_4 = \pm 1 \leftrightarrow \pm C\left({\beta = \pm \frac{\pi }{4}} \right)\hspace*{-1.5pt}. \\ \end{array} \right. \end{equation}\end{document}Here, β is the value of polarization ellipticity; the +C-point is assumed to designate a right-circulated polarization state, which can be characterized by the phase shift δ = π/2 between the orthogonal components of laser beam amplitude; the –C-point is assumed to designate a left-circular polarization state [δ = −(π/2)]. Thus, ±C-points are the orthogonal states of a circularly polarized wave. For the L-points, the phase shift reaches δ = 0; π. Using Eqs. 1, 2, it is possible to determine the interrelations between the characteristic values [TeX:] $M_{ik}^ *$ of Mueller-matrix elements, which correspond to the “extreme” values of BT optical anisotropy, and to the extreme values of V 4. Thus, in order to characterize the BT structure, we obtain the coordinate network generated by a finite number of characteristic values of Mueller-matrix elements [Eq. 1] (see Table 1). Fig. 7Distributions of the amount of singularities N(x), N +(x), N −(x) of myometrium tissues of (a,d,g) A, (b,e,h) B, and (c,f,i) C types.  Table 1Interrelation between the characteristic values of Mueller-matrix M ik elements of biological tissues and polarization singularities described by the fourth parameter of the Stokes vector V 4.
Thus, measuring the coordinate distributions of the characteristic values ( [TeX:] $M_{ik}^ * = 0, \pm 1$ ) of the BT Mueller-matrix elements enables not only to foresee the scenario ( [TeX:] $M_{ik}^ * \to V_4^ *$ ) of forming the ensemble of polarization singularities (V 4 = 0, ±1) of its image, but also to additionally realize their differentiation, conditioned by the specificity of orientation structure of biological crystals. Here, +L-point corresponds to a linear polarization state with δ = 0; –L-point corresponds to a linear polarization state with δ = π. In this case, as for ±C-points, we will identify ±L-points as orthogonal. 3.Scheme and Methods of Experimental InvestigationsFigure 1 shows the traditional optical scheme of polarimeter for measuring the elements of Mueller matrix of the BT histological sections.5, 20 Fig. 1Optical scheme of the polarimeter: 1 is the He-Ne laser; 2, the collimator; 3, the stationary quarter-wave plates; 5 and 8, mechanically movable quarter-wave plates; 4 and 9, polarizer and analyzer, correspondingly; 6, object of the investigation; 7, micro-objective; 10, the CCD camera; and 11, a personal computer.  The parallel (ø = 104 μm) beam of He-Ne laser (λ = 0.6328 μm, W = 5.0 μW) was used as an illuminator. The polarization illuminator consists of the quarter-wave plates 3, 5, and polarizer 4, and it sequentially forms a series of linearly polarized (I 0, I 45, I 90, I 135) with azimuths 0°, 90°, 45°, 135°, and right-hand (I ⊗) and left-hand (I ⊕) circularly polarized probing BT laser beams. The BT images made by the micro-objective 7 (4×) were projected into the plane of a light-sensitive area (800 × 600 pixels) of CCD camera 10. Polarization images of BT were projected by means of the micro-objective 7 (focal distance – 1.5 cm, aperture – 0.2, magnification – 4×) into the plane of light-sensitive area of the CCD camera (overall amount of pixels, 800 × 600; light-sensitive area size, 4000 × 3000 μm; deviation of photosensitive characteristics from the linear one was no more than 15%), which provided the range of measuring the structural elements of BT with the resolution 2–2000 μm. Maximal resolution verification (2 μm) was performed using the stage micrometer (linear scale), where the image was projected into the light-sensitive area of the CCD camera using the micro-objective 7. Minimal resolution (2000 μm) corresponds to the situation when the light-sensitive area of the CCD camera is entirely filled by two equal-sized structural elements (light and dark) of a stage micrometer. The experimental conditions were chosen in such a way that it enabled one to reduce the space-angular aperture filtering when forming the BT images. It was ensured by conformance of angular characteristics of the indicatrix of light scattering by the BT samples (Ω ≈ 160) and the angular aperture of the micro-objective (Δω = 200). Here, Ω is the solid angle within which 98% of all the energy of light-scattered radiation is concentrated. Polarization analysis of the BT images was performed using the polarizer 9 and quarter-wave plate 8 according to the following technique:
At the first stage, the interrelations ( [TeX:] $M_{ik}^ * \to V_4^ *$ ) of matrix and polarization singularities were investigated on the sample of a histological section prepared from healthy skin derma. Figure 2 represents coordinate distributions of matrix elements M 44,24,34(m × n) corresponding to the skin derma histological section and the fourth Stokes vector parameter V 4(m × n) of its image with the characteristic values (0, ±1) plotted on them [within the marked (100 × 100)-pixel sampling plot]. Fig. 2Networks of (a–c) characteristic values [TeX:] $M_{44,24,34}^* (m \times n)$ of matrix elements M 44,24,34 and (d) singularities of polarization image inherent to the skin derma layer histological section V 4: ± C-points (❑) (M 44 = 0) + L-points (Δ) (M 44 = + 1); + C-points (⧅) [TeX:] $ (M_{24,34} = + 1,\;V_4 = + 1); { \; - {\rm L} {\text -}{\rm points }\; (\nabla)\;(M_{44} = - 1);} $ −C-points (⧄) (M 24,34 = −1, [TeX:] $V_4 = - 1); \; \pm {\rm L} {\text -} {\rm points }\; (\diamondsuit)\; (M_{24,34} = 0,$ V 4 = 0).  It can be seen from the data obtained that there is a direct correlation between the coordinate (k,g 1 ≤ k ≤ m, 1 ≤ g ≤ n) positions of characteristic values of the matrix element [TeX:] $M_{44}^ *$ for skin derma and the network of L- and C-points in its laser image [TeX:] $ {M_{44}^ * \left({k,g} \right) = \left\{ \begin{array}{l} 0 \\ \pm 1 \\ \end{array} \right\} \Leftrightarrow V_4^ * \left({k,g} \right) = \left\{ {\begin{array}{*{20}c} { \pm 1} & - & { \pm C} \\ 0 & - & L \\\end{array}} \right\}} $ [Figs. 2a, 2d]. Coordinate distributions of characteristic values of matrix elements [TeX:] $M_{24,42}^ * \left({m,n} \right)$ , [TeX:] $M_{34,43}^ * \left({m,n} \right)$ and corresponding networks of orthogonal ±L- and ±C-points (Table 1) possess the individual structure [Figs. 2b, 2c]. Analytically substantiated and experimentally proven interrelations between the matrix and polarization singularities were used as the basis for Mueller-matrix singular diagnostics of oncological changes in the tissues of a woman's reproductive sphere. 4.Mueller-Matrix Singular Diagnostics and Differentiation of Pathological Changes in the Tissues of Woman Reproductive SphereThree groups of histological sections of the main tissue of a woman's reproductive sphere—myometrium—were used as the objects of the investigation: biopsy of the healthy tissue of a woman's reproductive sphere [type A, Fig. 3a], biopsy of the inflamed tissue (ectonia) [type B, Fig. 3b], and biopsy of the tissue in the state of dysplasia (precancer state) [type C, Fig. 3c]. Fig. 3Polarization images of woman reproductive sphere tissue – myometrium (a) A, (b) B, and (c) C types in the scheme of coaxial polarizer and analyzer. 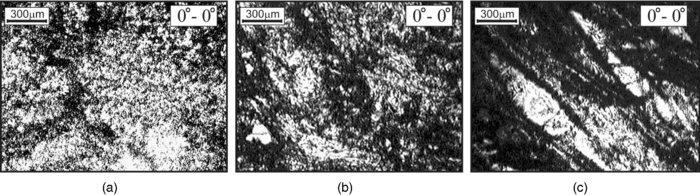 To determine the criteria of Mueller-matrix singular diagnostics of the myometrium oncological state and differentiate its severity degree, the following technique was used:
Fig. 4Networks of (a–c) characteristic values [TeX:] $M_{44,24,34}^ * (m \times n)$ of matrix elements M 44,24,34 and (d) singularities of polarization image of myometrium histological section of A type V 4: ±C-points (❑) (M 44 = 0); + L-points (Δ) (M 44 = + 1); + C-points (⧅) (M 24,34 = +1, V 4 = + 1); −L-points (∇) (M 44 = −1); −C-points (⧄) (M 24,34 = −1, [TeX:] $ V_4 = - 1); \; \pm {\rm L} {\text -} {\rm points }\;(\diamondsuit)\;(M_{24,34} = 0,\;V_4 = 0).$  Fig. 5Networks of (a–c) characteristic values [TeX:] $M_{44,24,34}^ * (m \times n)$ of matrix elements M 44,24,34 and (d) singularities of polarization image of myometrium histological section of B type V 4: ±C-points (❑) (M 44 = 0); [TeX:] $+ {\rm L} {\text -} {\rm points }\;(\Delta)\;(M_{44}\, =\, + 1)$ ; +C-points (⧅) (M 24,34 = + 1, V 4 = + 1); [TeX:] $- {\rm L} {\text -} {\rm points }\;(\nabla)\;(M_{44} = - 1)$ ; −C-points (⧄) (M 24,34 = −1, [TeX:] $V_4\break = - 1); \pm {\rm L} {\text -} $ points (◇) (M 24, 34 = 0, V 4 = 0).  Fig. 6Networks of (a–c) characteristic values [TeX:] $M_{44,24,34}^ * (m \times n)$ of matrix elements M 44,24,34 and (d) singularities of polarization image of myometrium histological section of C type V 4: ±C-points (❑) (M 44 = 0); [TeX:] $+ {\rm L} {\text -} {\rm points }\;(\Delta)\;(M_{44} = + 1)$ ; +C-points (⧅) (M 24, 34 = +1, V 4 = +1); [TeX:] $- {\rm L} {\text -} {\rm points }\;(\nabla)\;(M_{44} = - 1);$ −C-points (⧄) (M 24,34 = −1, V 4 = −1); ±L-points (◇) (M 24,34 = 0, V 4 = 0).  Figure 7 illustrates the distributions of the number of singularities N(x), N +(x), N −(x) of myometrium tissues of (a,d,g) A, (b,e,h) B, and (c,f,i) C types. The comparative analysis of the data obtained shows that the following:
The obtained results can be related with the increase of birefringence (Δn ≈ 1.5 × 10⁻²) of collagen and myosin fibrils in pathologically changed myometrium of B and C types. Besides, at early stages (ectonia), the directions of the growth of newly formed fibrils are being formed. In dysplasia states, these pathologically changed fibrils form a specifically oriented network of biological crystals. In terms of physics, these morphological processes are manifested in the increase of probability of forming the ±C-points (myometrium samples of B and C types), as well as in appearance of asymmetry between ranges of dependences values N +(x) and N −(x), which characterize the number of orthogonal L- and C-points (Table 1). Finally, comparative investigations of the diagnostic efficiency typical to famous techniques of laser polarimetry {Z 1, 2, 3, 4[M 44, 34, 24(m × n)]};14 polarization-correlation mapping26, 27
[TeX:]
\documentclass[12pt]{minimal}\begin{document}\begin{equation*}
{Z_{1,2,3,4} \left[ {V_4 \left({m \times n} \right) = \left\{ \begin{array}{l}
0, \\[3pt]
\pm 1 \\
\end{array} \right.} \right]}
\end{equation*}\end{document}
and the technique of Mueller-matrix singular diagnostics Z
1,2,3,4[N(x), N
+(x), N
−(x)] were suggested.Summarized in Table 2 are the statistical averaged values within these three groups of samples of myometrium tissue {Z 1, 2, 3, 4[M 44, 34, 24(m × n)]},
[TeX:]
\documentclass[12pt]{minimal}\begin{document}\begin{equation*}
{Z_{1,2,3,4} \left[ {V_4 \left({m \times n} \right) = \left\{ \begin{array}{l}
0, \\[3pt]
\pm 1 \\
\end{array} \right.} \right]} \hspace*{-1.5pt},
\end{equation*}\end{document}
and Z
1,2,3,4[N(x), N
+(x), N
−(x)].Table 2Values {Z 1, 2, 3, 4[M 44, 34, 24(m × n)]}, $ {Z_{1,2,3,4} \left[ {V_4 \left({m \times n} \right) = \left\{ \begin{array}{l} 0, \\ \pm 1 \\ \end{array} \right.} \right]} $ Z1,2,3,4V4m×n=0,±1 , and Z 1,2,3,4[N(x), N +(x), N −(x)] statistically averaged within the three groups of myometrium tissue samples.
It follows from the data presented that:
5.ConclusionsIt has been ascertained that correlation between coordinate locations of characteristic points for 2-D elements of the Mueller matrix corresponding to an optically thin layer of biological tissue and the network of L- and C-points in its laser image. Shown is the potentiality of Mueller-matrix sampling for polarization singularities formed by biological crystals. The efficiency of Mueller-matrix singular diagnostics has been demonstrated, not only for oncological changes of myometrium tissue, but also for differentiating their degree of severity. ReferencesJ. F. de Boer and
T. E. Milner,
“Review of polarization sensitive optical coherence tomography and Stokes vector determination,”
J. Biomed. Opt., 7 359
–371
(2002). https://doi.org/10.1117/1.1483879 Google Scholar
J. F. de Boer, T. E. Milner, and
J. S. Nelson, Trends in Optics and Photonics (TOPS): Advances in Optical Imaging and Photon Migration, OSA, Washington
(1998). Google Scholar
M. J. Everett, K. Shoenenberger, B. W. Colston, and
L. B. Da Silva,
“Birefringence characterization of biological tissue by use of optical coherence tomography,”
Opt. Lett., 23 228
–230
(1998). https://doi.org/10.1364/OL.23.000228 Google Scholar
Sh. Jiao, W. Yu, G. Stoica, and
L. V. Wang,
“Optical-fiber based Mueller optical coherence tomography,”
Opt. Lett., 28 1206
–1208
(2003). https://doi.org/10.1364/OL.28.001206 Google Scholar
A. G. Ushenko and
V. P. Pishak,
“Laser Polarimetry of Biological Tissue: Principles and Applications,”
Handbook of Coherent-Domain Optical Methods: Biomedical Diagnostics, Environmental and Material Science, 93
–138 Kluwer Academic Publishers, Boston
(2004). Google Scholar
O. V. Angelsky, A. G. Ushenko, Yu. A. Ushenko, and
V. P. Pishak,
“Statistical and Fractal Structure of Biological Tissue Mueller Matrix Images,”
Optical Correlation Techniques and Applications, 213
–266 SPIE Press, Bellingham, WA
(2007). Google Scholar
O. V. Angelsky, A. G. Ushenko, Yu. A. Ushenko, V. P. Pishak, and
A. P. Peresunko,
“Statistical, correlation, and topological approaches in diagnostics of the structure and physiological state of birefringent biological tissues,”
Handbook of Photonics for Biomedical Science, 21
–67 CRC Press, Boca Raton
(2010). Google Scholar
A. G. Ushenko,
“Polarization structure of laser scattering fields,”
Opt. Eng., 34 1088
–1093
(1995). https://doi.org/10.1117/12.197186 Google Scholar
A. G. Ushenko,
“Laser diagnostics of biofractals,”
Quantum Electron., 29
(12), 1078
–1084
(1999). https://doi.org/10.1070/QE1999v029n12ABEH001635 Google Scholar
O. V. Angel'skii, A. G. Ushenko, A. D. Arkhelyuk, S. B. Ermolenko, and
D. N. Burkovets,
“Structure of matrices for the transformation of laser radiation by biofractals,”
Quantum Electron., 29
(12), 1074
–1077
(1999). https://doi.org/10.1070/QE1999v029n12ABEH001634 Google Scholar
O. V. Angel'skii, A. G. Ushenko, A. D. Arheluk, S. B. Ermolenko, and
D. N. Burkovets,
“Scattering of laser radiation by multifractal biological structures,”
Opt. Spectrosc., 88
(3), 444
–448
(2000). https://doi.org/10.1134/1.626815 Google Scholar
A. G. Ushenko,
“Polarization structure of biospeckles and the depolarization of laser radiation,”
Opt. Spectrosc., 89
(4), 597
–601
(2000). https://doi.org/10.1134/1.1319922 Google Scholar
A. G. Ushenko,
“Stokes correlometry of biotissues,”
Laser Phys., 10
(5), 1286
–1292
(2000). Google Scholar
A. G. Ushenko,
“The vector structure of laser biospeckle fields and polarization diagnostics of collagen skin structures,”
Laser Phys., 10
(5), 1143
–1149
(2000). Google Scholar
A. G. Ushenko,
“Laser polarimetry of polarization-phase statistical moments of the object field of optically anisotropic scattering layers,”
Opt. Spectrosc., 91
(2), 313
–316
(2001). https://doi.org/10.1134/1.1397917 Google Scholar
A. G. Ushenko,
“Polarization contrast enhancement of images of biological tissues under the conditions of multiple scattering,”
Opt. Spectrosc., 91
(6), 937
–940
(2001). https://doi.org/10.1134/1.1429711 Google Scholar
A. G. Ushenko,
“Laser probing of biological tissues and the polarization selection of their images,”
Opt. Spectrosc., 91
(6), 932
–936
(2001). https://doi.org/10.1134/1.1429710 Google Scholar
A. G. Ushenko,
“Correlation processing and wavelet analysis of polarization images of biological tissues,”
Opt. Spectrosc., 91
(5), 773
–778
(2002). https://doi.org/10.1134/1.1420861 Google Scholar
A. G. Ushenko,
“Polarization correlometry of angular structure in the microrelief pattern or rough surfaces,”
Opt. Spectrosc., 92
(2), 227
–229
(2002). https://doi.org/10.1134/1.1454033 Google Scholar
O. V. Angelsky, A. G. Ushenko, Ye. G. Ushenko,
“2-D Stokes polarimetry of biospeckle tissues images in pre-clinic diagnostics of their pre-cancer states,”
J. Holography Speckle, 2
(1), 26
–33
(2005). https://doi.org/10.1166/jhs.2005.006 Google Scholar
O. V. Angelsky, A. G. Ushenko, and
Y. G. Ushenko,
“Complex degree of mutual polarization of biological tissue coherent images for the diagnostics of their physiological state,”
J. Biomed. Opt., 10
(6), 060502
(2005). https://doi.org/10.1117/1.2149844 Google Scholar
O. V. Angelsky, A. G. Ushenko, and
Ye. G. Ushenko,
“Investigation of the correlation structure of biological tissue polarization images during the diagnostics of their oncological changes,”
Phys. Med. Biol., 50
(20), 4811
–4822
(2005). https://doi.org/10.1088/0031-9155/50/20/005 Google Scholar
A. Ushenko, S. Yermolenko, A. Prydij, S. Guminetsky, I. Gruia, O. Toma, and
K. Vladychenko,
“Statistical and fractal approaches in laser polarimetry diagnostics of the cancer prostate tissues,”
Proc. SPIE, 7008 70082C
(2008). https://doi.org/10.1117/12.797383 Google Scholar
A. G. Ushenko, A. I. Fediv, and
Yu. F. Marchuk,
“Correlation and fractal structure of Jones matrices of human bile secret,”
Proc. SPIE, 7368 73681Q
(2009). https://doi.org/10.1117/12.831559 Google Scholar
O. V. Angelsky, A. G. Ushenko, Y. G. Ushenko, and
Y. Y. Tomka,
“Polarization singularities of biological tissues images,”
J. Biomed. Opt., 11
(5), 054030
(2006). https://doi.org/10.1117/1.2360527 Google Scholar
S. B. Yermolenko, A. G. Ushenko, and
P. Ivashko,
“Spectropolarimetry of cancer change of biotissues,”
Proc. SPIE, 7388 73881D
(2009). https://doi.org/10.1117/12.853585 Google Scholar
A. G. Ushenko, I. Z. Misevich, V. Istratiy, I. Bachyns'ka, A. P. Peresunko, O. K. Numan, and
T. G. Moiysuk,
“Evolution of statistic moments of 2D-distributions of biological liquid crystal net Mueller matrix elements in the process of their birefringent structure changes,”
Adv. Opt. Technol., 2010 423145
(2010). https://doi.org/10.1155/2010/423145 Google Scholar
Yu. O. Ushenko, I. Z. Misevich, A. P. Angelsky, V. T. Bachinsky, O. Yu. Telen'ga, and
O. I. Olar,
“Polarization-singular structure in laser images of phase-inhomogeneous layers to diagnose and classify their optical properties,”
Semicond. Phys., Quantum Electron. Optoelectron., 13
(3), 248
–258
(2010). Google Scholar
V. T. Bachinsky, Yu. O. Ushenko, Yu. Ya. Tomka, O. V. Dubolazov, V. O. Balanets'ka, and
A. V. Karachevtsev,
“Wavelet analysis for polarization maps of networks formed by liquid biological crystals in blood plasma: statistical and fractal approaches,”
Semicond. Phys., Quantum Electron. Optoelectron., 13
(2), 189
–201
(2010). Google Scholar
S. C. Cowin,
“How is a tissue built,”
J. Biomed. Eng., 122 553
–568
(2000). https://doi.org/10.1115/1.1324665 Google Scholar
J. F. Nye, Natural Focusing and the Fine Structure of Light, Institute of Physics, Bristol
(1999). Google Scholar
J. F. Nye,
“Polarization effects in the diffraction of electromagnetic waves: the role of disclinations,”
Proc. R. Soc. A, 387 105
–132
(1983). https://doi.org/10.1098/rspa.1983.0053 Google Scholar
M. V. Berry and
M. R. Dennis,
“Polarization singularities in isotropic random vector waves,”
Proc. R. Soc. A, 457 141
–155
(2001). https://doi.org/10.1098/rspa.2000.0660 Google Scholar
J. F. Nye,
“Lines of circular polarization in electromagnetic wave fields,”
Proc. R. Soc. A, 389 279
–290
(1983). https://doi.org/10.1098/rspa.1983.0109 Google Scholar
“Coherency matrix description of optical polarization singularities,”
J. Opt. A., 6 S229
–S234
(2004). https://doi.org/10.1088/1464-4258/6/5/015 Google Scholar
O. V. Dubolazov, A. G. Ushenko, V. T. Bachynsky, A. P. Peresunko, and
O. Ya. Vanchulyak,
“On the feasibilities of using the wavelet analysis of Mueller matrix images of biological crystals,”
Adv. Opt. Technol., 2010 162832
(2010). https://doi.org/10.1155/2010/162832 Google Scholar
A. G. Ushenko, A. I. Fediv, and
Yu. F. Marchuk,
“Singular structure of polarization images of bile secret in diagnostics of human physiological state,”
Proc. SPIE, 7368 73681S
(2009). https://doi.org/10.1117/12.831560 Google Scholar
|
||||||||||||||||||||||||||||||||||||||||||||||||||||||||||||||||||||||||||||||||||||||||||||||||||||||||||||||||||||||||||||||||||||||||||||||||||||||||||||||||||||||||||||||||||||||||||||||||||||||||||||||||


