|
|
|
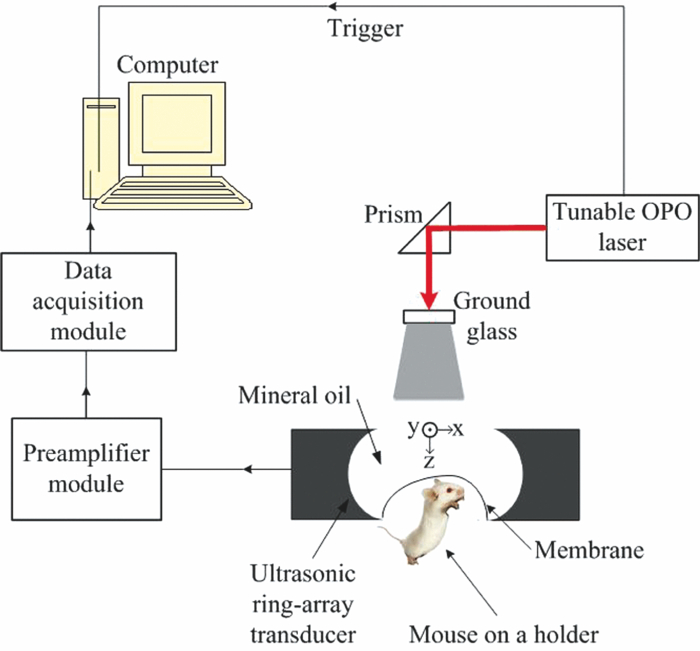
The homeostasis of the intracellular and extracellular fluids inside the brain is established under the precise regulation of water transportation across the major cellular barrier: blood-brain barrier (BBB).1 Cerebral edema is a pathological status in which tissues swell as a result of excess water accumulation. In cerebral edema, the BBB tight endothelial junctions are weakened, thus increasing the osmolality. As a result, intravascular fluids and proteins penetrate into cerebral extracellular space.1 There are several types of cerebral edema.2, 3 Diffuse cerebral edema is formed due to a head injury. Vasogenic edema arises from transvascular leakage, and is usually associated with focal contusions or hematomas. Cytotoxic edema is an intracellular process resulting from the failure of the membrane pump. It is also induced by a head injury, and will cause post-traumatic ischemia and tissue hypoxia. Cerebral edema plays an important role in a wide variety of nervous system disorders, including head trauma, tumors, stroke, infections, and metabolic disorders.3 Detecting, monitoring, and especially imaging edema is helpful in understanding its mechanisms and offering therapeutic options. Cerebral edema has been detected by morphological imaging modalities such as x-ray computerized tomography and magnetic resonance imaging (MRI).4, 5 Itabashi 5 combined MRI and perfusion studies of brain edema to obtain both structural and functional imaging, followed by histological examination. Photoacoustic tomography (PAT) has been implemented to image various tissues.6 Many types of optical absorbers, such as hemoglobin, melanoma, and various natural and artificial exogenous contrast agents, have been imaged for their high contrast. We have previously demonstrated that PAT has the potential to image water in tissue, taking advantage of the fact that water has a peak absorption coefficient around 975 nm, with a full width at half maximum (FWHM) of 920 to 1040 nm.7 Here we applied PAT to imaging cerebral edema. To our knowledge, it is the first successful attempt to image water in vivo by PAT. Our new full-ring array PAT system,8 shown in Fig. 1, was used in the study. The illumination source was a tunable laser [Vibrant (HE) 355 I, OPOTEK], which provided laser pulses at a repetition rate of 10 Hz. Two wavelengths, 610 and 975 nm, were used to image a mouse brain in vivo in order to image both blood vessels and water content. A ground glass homogenized the laser beam before it reached the brain surface. The average fluence on the mouse surface is 4.78 and 0.95 mJ/cm2 for 610 and 975 nm, respectively, which were lower than the American National Standards Institute (ANSI) safety standard (20 mJ/cm2). The beam diameter is ∼1 cm. A 512-element full-ring array, with a 5 cm diameter and a 5 MHz center frequency, served as the ultrasonic detector. It took 16 s to obtain one cross-sectional image with 10 times averaging. Three mice weighing 25 g were used for the repeated experiments. In each experiment, the mouse was anesthetized with ketamine/xylazine to facilitate the placement of the animal on an experimental stage and keep it motionless. The skull region of interest was depilated using a commercial hair remover. Before the imaging period, 0.4 ml/ 20 gm saline was injected intra-abdominally in order to replenish lost fluids.9 The mouse remained under anesthesia during the experiment, with isofluorane delivered through a nose cone. The head was covered by a plastic film, above which mineral oil was filled as an acoustic coupling medium. Prior to the induction of cerebral edema, baseline images of the mouse brain were collected for comparison with images collected after the cold injury. After the baseline image was obtained, mineral oil was extracted temporarily with a syringe. A cold-induced cerebral edema10 was created by filling an aluminum tube with liquid nitrogen and placing the tube in contact with the mouse scalp for 30 s. To prevent adhesion, the plastic membrane remained between the aluminum tube and the scalp. After the tube was withdrawn, the mineral oil was replaced. The animal remained on the experimental stage for the entire duration of imaging. For two of the animals, changes in blood volume and water accumulation at the edema site were tracked 12, 24, and 36 h after the cold injury. For the third animal, only changes at 12 and 24 h after the cold injury were tracked. After that, the mouse was sacrificed and an MRI image of the cortex was taken immediately. The solid-angle-weighted image reconstruction algorithm approximated by Li and Wang11 was used for the image reconstruction. Due to the limited bandwidth of the system response, there are negative values on some of the reconstructed image pixels. Here an iterative algorithm was applied12 while the positivity constraint was added during each iterative step. Figure 2 shows the brain images acquired in vivo by PAT at both 610 and 975 nm and subsequently acquired ex vivo by MRI. The imaging depth is ∼1 mm beneath the mouse brain surface. The upper (610 nm) images in Figs. 2a, 2b, 2c indicate the decreased amount of blood in the vessel during the first 24 h after the cold injury, which is consistent with the findings of Frei 13 At the same time, the lower (975 nm) images show an accumulation of water after the cold injury. The region with water accumulation increased to a maximum size 24 h after the cold injury. Figure 2d shows the integrated signals of both blood and water. The region of the edema as encircled by the dashed line in the lower (975 nm) part of Fig. 2c, which is the contour line at 60% of the maximum pixel value. Here, when integrating the signal within the contour, we eliminated the blood signal at 975 nm by obtaining the least squares solution to the linear equation with three unknowns (concentration of water, oxy-, and deoxy-hemoglobin), based on the photoacoustic (PA) signal from both the upper (610 nm) images and the lower (975 nm) ones. The linear equation was formed by applying different oxy- and deoxy-hemoglobin molar extinction coefficients at two wavelengths, the molar extinction coefficient of water14 at 975 nm, and the laser energy for calibration, described as
[TeX:]
\documentclass[12pt]{minimal}\begin{document}\begin{eqnarray*}
{\rm P}_{\rm a} (\lambda _1)/[F(\lambda _1)\eta _{{\rm th}} \Gamma ] \,& =& \,\varepsilon _{{\rm ox}} (\lambda _ 1)C_{\rm ox}\nonumber\\
&& \, +\, \varepsilon _{\rm de} (\lambda _{1}){\rm C}_{{\rm de}} \, + \, \varepsilon _{{\rm water}} (\lambda _{\rm 1}){\rm C}_{{\rm water}},
\end{eqnarray*}\end{document}
[TeX:]
\documentclass[12pt]{minimal}\begin{document}\begin{eqnarray*}
{\rm P}_{\rm a} (\lambda _{\rm 2})/[{\rm F}(\lambda _{\rm 2})\eta _{{\rm th}} \Gamma ] &=& \varepsilon _{{\rm ox}} (\lambda _{\rm 2} {\rm)C}_{{\rm ox}}\nonumber\\
&& +\,\varepsilon _{{\rm de}}(\lambda _{\rm 2}){\rm C}_{{\rm de}} + \varepsilon _{{\rm water}} {\rm (}\lambda _{\rm 2} {\rm)C}_{{\rm water}},
\end{eqnarray*}\end{document}
where λ1 = 610 nm, λ2 = 975 nm; εox, εde, and εwater are the known molar extinction coefficients of oxy-, deoxy-hemoglobin, and water, respectively; Cox, Cde and Cwater are the molar concentrations of oxy-, deoxy-hemoglobin, and water, respectively, in the brain; F(λ) is the laser fluence at λ; ηth is the percentage of deposited optical energy that is converted into heat; Γ is the the Grueneisen parameter, which is regarded as a constant;14 P
a(λ) is the reconstructed photoacoustic signal amplitude at λ.Fig. 2Transcranial photoacoustic images of the mouse brain acquired through the intact scalp and skull noninvasively acquired (a) before cold injury, (b) 12 h after injury, and (c) 24 h after injury. The upper and lower row images were acquired at 610 and 975 nm optical wavelengths, respectively. Three mice were imaged: two of them were kept alive until 36 h after cold injury, and the third was sacrificed 24 h after the cold injury for MRI imaging. (d) Integrated water and blood signal strengths in the dashed line area computed for the three mice. The signal strengths were normalized to the water signal acquired before cold injury. (e) MRI image of the mouse cortex, taken immediately after the mouse was sacrificed [24 h after cold injury]. The edema is indicated by the arrow. The dashed line area in lower (c) outlines the contour area according to 60% of the maximum water signal acquired at 975 nm.  Here, the photodiode (DET210, Thorlabs, Inc., Newton, New Jersey) was used to record the energy of every laser pulse for the calibration. We assumed the oxygen saturation is 95% and ignored the slight difference in scattering coefficients at the two wavelengths.15 From Fig. 2d, we could see that 36 h after the cold injury, the water signal at the edema region had decreased, while the blood signal had increased slightly compared to the signal 24 h after cold injury, indicating that the mouse began to recover from the edema 36 h after the cold injury. We applied linear regressions to all the data within the first 24 h (3 animals multiplied by 3 time points) for both the blood and water signals, respectively, and then performed a t-test of the slopes against zero. The p-values for the blood and water signals were less than 0.0001 and 0.0022, respectively. The T2-based MRI image [shown in Fig. 2e] validated the edema region observed by PAT. The image of the ex vivo mouse was acquired at 4.7 T using a Varian/Agilent DirectDrive small-animal MRI scanner. A Doty linear volume coil was used for excitation and signal reception. Fast spin-echo image was acquired using repetition time TR = 5 s, echo train length (ETL) = 8, a 12 ms echo spacing, effective echo time TEeff = 48 ms, and 10 signal averages. The contrast-to-noise ratios (CNRs) were calculated to quantify the water contrast in both the MRI and PAT images, which were 22.2 ± 4.1 and 25.3 ± 5.2 dB, respectively. Here the regions of interests were selected within the contour line at 60% of the maximum pixel value, and the CNRs were calculated with the method proposed by Scott 16 The standard deviations were obtained by applying the formula of propagation of uncertainty.17 In addition to the MRI image in Fig. 2e, to demonstrate that what we observed was water, we integrated the signals in the water accumulation region labeled in the lower part (975 nm) of Fig. 2c at five different wavelengths: 925, 95, 975, 1000, and 1025 nm [images shown in Figs. 3a, 3b, 3c, 3d]. The data were compared with the expected water absorption from spectrophotometric measurement in Fig. 3e. The relative absorption spectrum was converted to absolute values by calibrating with the absorption coefficient of deionized water at 975 nm measured by a spectrophotometer (Cary 5E, Varian, Walnut Greek, California). From the Fig. 3 we could see that the PAT measurement of water showed good agreement with the spectrophotometric measurement, which indicated that the photoacoustic contrast in the labeled region was due to water. Fig. 3(a)–(d) Transcranial photoacoustic images acquired at 24 h after cold injury at 925, 950, 1000, and 1025 nm wavelengths, respectively. The dashed line area is the same as the one shown in the lower part of Fig. 2c. (e) Comparison between the water absorption coefficients calculated by signal integrations in the reconstructed water accumulation region and the coefficients from spectrophotometric measurements.  In this paper, we first imaged water in vivo with our PAT system. We monitored the formation of edema and its expansion and recovery with PAT. Due to disruption to the BBB, the venules and capillaries become leaky; thus, both proteins and water may have flowed into the extracellular space, leading to a net water increase. The photoacoustic approach demonstrated its ability to image the cold-induced cerebral edema and its potential to image water. In imaging cerebral edema, PAT required less time than MRI. Imaging water with PAT offers the possibility of accurately monitoring physiological parameters in addition to oxygen saturation and hemoglobin concentration, by differentiating several contrasts with more optical wavelengths. AcknowledgmentsThis work was sponsored in part by National Institutes of Health Grant Nos. R01 EB000712, R01 EB008085, R01 CA134539, U54 CA136398, R01 EB010049, and 5P60 DK02057933. L.W. has a financial interest in Microphotoacoustics, Inc. and Endra, Inc., which, however, did not support this work. ReferencesA. I. Qureshi and
J. I. Suarez,
“Use of hypertonic saline solutions in treatment of cerebral edema and intracranial hypertension,”
Crit. Care Med., 28
(9), 3301
–3313
(2000). https://doi.org/10.1097/00003246-200009000-00032 Google Scholar
G. T. Manley, M. Fujimura, T. H. Ma, N. Noshita, F. Filiz, A. W. Bollen, P. Chan, and
A. S. Verkman,
“Aquaporin-4 deletion in mice reduces brain edema after acute water intoxication and ischemic stroke,”
Nat. Med., 6
(2), 159
–163
(2000). https://doi.org/10.1038/72256 Google Scholar
I. Klatzo,
“Pathophysiological aspects of brain edema,”
Acta Neuropathol., 72
(3), 236
–239
(1987). https://doi.org/10.1007/BF00691095 Google Scholar
J. B. Bederson, H. M. Bartkowski, K. Moon, M. Halksmiller, M. C. Nishimura, M. Brantzawadski and
L. H. Pitts,
“Nuclear-magnetic-resonance imaging and spectroscopy in experimental brain edema in a rat model,”
J. Neurosug., 64
(5), 795
–802
(1986). https://doi.org/10.3171/jns.1986.64.5.0795 Google Scholar
Y. Itabashi, G. L. M. Prado, M. Abo, H. Miura, and
Y. Abe,
“Dissociation of brain edema induced by cold injury in rat model: MR imaging and perfusion studies with C-14-iodo-antipyrine,”
Ann. Nucl. Med., 15
(4), 337
–342
(2001). https://doi.org/10.1007/BF02988240 Google Scholar
L. H. V. Wang,
“Prospects of photoacoustic tomography,”
Med. Phys., 35
(12), 5758
–5767
(2008). https://doi.org/10.1118/1.3013698 Google Scholar
Z. Xu, C. H. Li, and
L. V. Wang,
“Photoacoustic tomography of water in phantoms and tissue,”
J. Biomed. Opt., 15
(3), 036019
(2010). https://doi.org/10.1117/1.3443793 Google Scholar
C. H. Li, A. Aguirre, J. Gamelin, A. Maurudis, Q. Zhu, and
L. V. Wang,
“Real-time photoacoustic tomography of cortical hemodynamics in small animals,”
J. Biomed. Opt., 15
(1), 010509
(2010). https://doi.org/10.1117/1.3302807 Google Scholar
S. D. Sullivan, L. C. Howard, A. H. Clayton, and
S. M. Moenter,
“Serotonergic activation rescues reproductive function in fasted mice: Does serotonin mediate the metabolic effects of leptin on reproduction,”
Biol. Reprod., 66
(6), 1702
–1706
(2002). https://doi.org/10.1095/biolreprod66.6.1702 Google Scholar
T. D. Oury, C. A. Piantadosi, and
J. D. Crapo,
“Cold-induced brain edema in mice – involvement of extracellular-superoxide dismutase and nitric-oxide,”
J. Biol. Chem., 268
(21), 15394
–15398
(1993). Google Scholar
C. H. Li and
L. H. V. Wang,
“Photoacoustic tomography of the mouse cerebral cortex with a high-numerical-aperture-based virtual point detector,”
J. Biomed. Opt., 14
(2), 024047
(2009). https://doi.org/10.1117/1.3122365 Google Scholar
Z. J. Guo, C. H. Li, L. A. Song, and
L. H. V. Wang,
“Compressed sensing in photoacoustic tomography in vivo,”
J. Biomed. Opt., 15
(2), 021311
(2010). https://doi.org/10.1117/1.3381187 Google Scholar
H. J. Frei, T. Wallenfa, W. Poll, H. J. Reulen, R. Schubert, and
M. Brock,
“Regional cerebral blood-flow and regional metabolism in cold induced edema,”
Acta Neurochir., 29
(1–2), 15
–28
(1973). https://doi.org/10.1007/BF01414613 Google Scholar
L. V. Wang and
H.-I. Wu, Biomedical Optics: Principles and Imaging, Wiley, New York
(2007). Google Scholar
S. Srinivasan, B. W. Pogue, S. Jiang, H. Dehghani, C. Kogel, S. Soho, J. J. Gibson, T. D. Tosteson, S. P. Poplack, and
K. D. Paulsen,
“Interpreting hemoglobin and water concentration, oxygen saturation and scattering measured in vivo by near-infrared breast tomography,”
Proc. Natl. Acad. Sci. USA, 100 12349
–12354
(2003). https://doi.org/10.1073/pnas.2032822100 Google Scholar
J. Scott, J. Ward, J. A. Guthrie, D. Wilson, and
P. J. Robinson,
“MRI of liver: a comparison of CNR enhancement using high dose and low dose ferumoxide infusion in patients with colorectal liver metastases,”
J. Magn. Reson Imaging, 18
(3), 297
–303
(2000). https://doi.org/10.1016/S0730-725X(00)00116-8 Google Scholar
S. L. Meyer, Data Analysis for Scientists and Engineers, Wiley, New York
(1975). Google Scholar
|