|
|
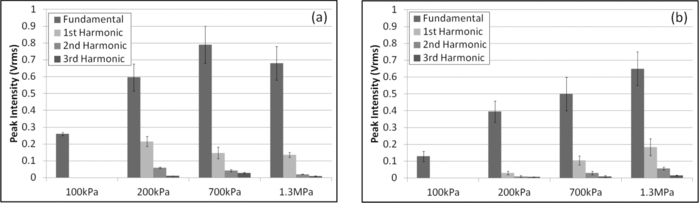
1.IntroductionMicrobubbles are common, food and drug administration (FDA)-approved diagnostic ultrasound contrast agents (UCAs), and have also been explored as externally-activated gene and drug delivery agents. It is important to know the optimal acoustic parameters of the UCAs to observe specific contrast agents while reducing background noise. For therapeutic applications, knowing the specific acoustic properties of the UCA of interest will enable tuning the acoustic system for more precise and efficient drug and gene delivery while minimizing adverse effects to surrounding tissues. During insonation, microbubbles oscillate, emitting linear and nonlinear backscatter at low to medium acoustic pressures, and exhibit inertial cavitation at high pressures. Nonlinear echoes may be detected with high signal-to-noise ratios (SNRs),1 providing excellent contrast for ultrasound imaging. Important parameters include acoustic scatter, stability, resonance frequency, and cavitation thresholds. Common methods for UCA characterization include measurement of acoustic scatter and attenuation. However, acoustic resolution limits the observation of individual bubble oscillations and bandwidth-limited acoustic receivers limit harmonic detection capabilities for free microbubbles, though acoustic properties of individually bound microbubbles have recently been explored.2 Optical imaging techniques, such as high-speed cameras and streak cameras,3, 4 have been developed to obtain visual information of oscillating microbubbles and produce high quality images for a direct observation of an individual microbubble's response to ultrasound. However, because of the large amount of data processed per video, only a few cycles of ultrasound may be recorded at most. Furthermore, the aforementioned high-speed cameras are expensive, which prohibits their widespread use for high throughput microbubble characterization. A low-cost alternative to the aforementioned characterization techniques is the use of light scattering, which can provide an indirect view of the interaction of ultrasound with an individual free microbubble.5, 6 Furthermore, due to the small amount of data per oscillation cycle, high throughput characterization of many microbubbles is possible, resulting in measurement of dynamics and statistics of the whole microbubble population. The light scattering intensity of an individual microbubble is dependent on factors such as particle size, optical index of refraction of the core and shell, and shell thickness.7 Mie scattering of coated spheres and optimal scattering angles for air-filled bubbles is described by Marston and Billette.8 Models of coated microbubbles based on the Rayleigh–Plesset equations have been described.9, 10, 11 A pressure induced size change of the UCA will induce a change in the scattered light intensity which combines Mie theory with microbubble models.5 Guan and Matula have demonstrated the use of optical scattering to observe microbubble size changes in response to pulsed ultrasound5 and fit them to models both with and without averaging, while Tu compare various bubble dynamic models to estimate shell parameters.6 Fourier spectra of raw unaveraged data however, were not shown. Herein, we present an improvement on the optical scatter concept presented by Guan and Matula to investigate individual microbubble dynamics in response to pulsed ultrasound in real-time with Fourier analysis of nonaveraged experimental data. Using a stable laser source with increased intensity, a dark optical environment, and low-noise optical detector and electronics, SNR of >240 are achieved, a factor of 10 increase in SNR at comparable ultrasound intensities from previously published work,5 with SNR defined as the ratio of signal amplitude to the variance of the noise. With improved SNR, individual microbubble dynamics in response to a single ultrasound pulse train can be acquired with ease without the need of averaging, permitting a direct observation of the individual microbubble's ability to expand and contract with consecutive ultrasound cycles without any latency between ultrasound pulses. In addition, using an optical detector with 10 MHz bandwidth, we are able to detect multiple higher order harmonic signatures simultaneously and carry out Fourier analysis of raw experimental data without averaging. We demonstrate the power of this tool by characterizing the linear, nonlinear oscillation, and cavitation thresholds of different clinically relevant microbubble formulations. 2.Materials and methodsWe have improved on a light scattering technique to characterize dynamics of various perfluorocarbon gas-filled microbubbles. Commercial Definity (Lantheus Medical Imaging, N. Billerica, Massachusetts) microbubbles with a phospholipid shell and perfluoropropane gas core, have been characterized using both acoustic and high-speed video techniques. In-house prepared albumin-shelled microbubbles, also with a perfluorocarbon gas core, were formulated for comparison. Albumin-shelled microbubbles are stiffer than phospholipid-shelled microbubbles, making them good models for comparison. The experimental setup is shown in Fig. 1. We used a 2 l black water bath for a clean sound field with transparent optical windows for light delivery and collection. A Verdi-V5 continuous-wave 532 nm laser source (Coherent Inc., Santa Clara, California) was focused with a 20× objective with a power density greater than 5 μW/cm2 at the laser focus. We used a 2.25 MHz focused single-element Panametrics V306 ultrasound transducer (Olympus NDT Inc., Waltham, Massachusetts), with its focus confocal with the laser focus. The ultrasound was pulsed at a 1-Hz repetition rate, with 15 cycles per pulse at 2.25 MHz, which was within the resonance frequency range of Definity microbubbles in the 1.1 to 3.3 μm size range.12 Transducer positioning and ultrasound pressure were calibrated with a HNC-0200 needle hydrophone (Onda Corp., Sunnyvale, California). Scattered light was collected at 75 to 95 deg, which includes the critical angle of 83 deg for air bubbles in water,13 focused and collimated onto a low dark current R6095 photomultiplier tube (PMT) optical detector (Hamamatsu Corp., Bridgewater, New Jersey) with a 10-MHz bandwidth. The PMT signal was then passed through a low noise M7279 amplifier (Hamamatsu Corp., Bridgewater, New Jersey), held at constant gain, to a high-speed digital TDS2020 sampling oscilloscope (Tektronix Inc., Beaverton, Oregon) which was controlled using Labview software on a personal computer. Ultrasound contrast agents were delivered using a PHD 3000 syringe pump (Harvard Apparatus, Holliston, MA) and a capillary tube placed in-line with the laser optical axis and outside the ultrasound interaction region. The ultrasound contrast agents were diluted such that at most one microbubble was present in the laser focus at a time, which was confirmed using a standard video-rate 1322 CCD camera (Cohu Inc., San Diego, California). Commercial Definity microbubbles were diluted to a concentration on the order of 106 microbubbles/ml with a mean diameter of 1.1 to 3.3 μm and fractionated via floatation for a more monodispersed sample. To convert relative scatter intensity to microbubble diameter, initial microbubble sizes must first be measured. Initial microbubble sizes of ∼2 μm diameter were measured microscopically and calibrated to light scatter intensity in our system. For the low-amplitude relative intensity regime the relationship with microbubble diameter can be assumed to be linear.5 Here, the constant of proportionality was found to be ∼ 1.6 to yield the initial microbubble diameter of ∼2 μm. As a model for rigid shelled bubbles, bovine serum albumin microbubbles were prepared. Formulation was based on published techniques using probe sonication.14 Solid 1.8 μm diameter monodispersed silica microspheres (Bangs Laboratories Inc., Fishers, Indiana) were used as controls because of their inability to change size at diagnostic ultrasound pressures. 3.Experimental resultsWith a 10-fold increase in SNR of the detection system, we used light scattering to compare microbubble dynamics of commercial Definity phospholipid microbubbles to in-house prepared albumin-shelled microbubbles. When there was no particle present, as expected, there is no optical signal leading to a dark background. At 100 kPa, both the Definity and albumin microbubbles exhibited a linear response. Figure 2a shows the relative light scatter intensity of an individual Definity microbubble. The uniform modulation amplitude indicates that the phospholipid-shelled microbubbles are able to sustain linear oscillations over these 15 cycles without bubble cavitation or significant gas leakage. It is interesting to note that the microbubble diameter remains above the initial microbubble diameter, indicating ease of expansion compared to compression under these measurement conditions. Figure 2b shows the root-mean-square (rms) Fourier transform of the diameter change from solid silica microspheres, albumin-shelled, and Definity microbubbles and shows the presence of the fundamental driving frequency. Due to the greater shell stiffness of the albumin microbubbles, the microbubble oscillation is dampened and results in a smaller relative intensity. As expected, silica microspheres do not change size and exhibit no light scattering oscillation. Fig. 2(a) Time domain waveform of symmetric radial oscillation of Definity microbubble at 100 kPa. (b) Corresponding frequency response at 100 kPa of silica microsphere, albumin microbubble, and Definity microbubbles.  At an increased pressure of 200 kPa, a nonlinear scatter intensity change was observed, which can be attributed to the asymmetric expansion and collapse of the microbubble gas core.15 Figure 3 shows the asymmetry in the time-domain waveform (a) and the second, third, and fourth harmonics in the Fourier domain (b). Due to the greater shell stiffness of the albumin bubbles, the gas core was not compressed and expanded enough to have a strong asymmetric response. As expected, solid silica microspheres again exhibited zero oscillation at this pressure. Fig. 3(a) Time domain waveform of asymmetric radial oscillation of Definity microbubble at 200 kPa. (b) Corresponding frequency response at 200 kPa of silica microsphere, albumin microbubble, and Definity microbubbles with the presence of higher harmonics. 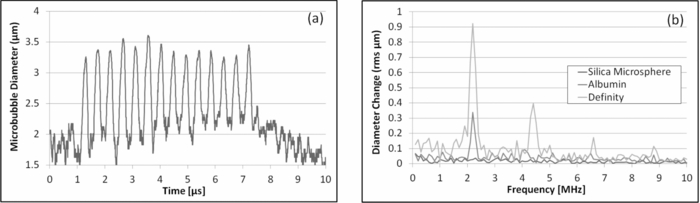 Microbubble dynamics were subsequently explored. Small amounts of perfluorocarbon gas escape via diffusion during each shell expansion and contraction due to the stretching and breaking of a lipid shell. Under increased nondestructive pressures, the shell will be compromised and gas is released at a faster rate. The loss of gas resulted in an increasingly nonacoustically responsive microbubble, reducing its ability to expand and contract. At high pressures, one can demonstrate instantaneous microbubble destruction or cavitation. Characterization of microbubble destruction is of particular interest to determine cavitation thresholds. Microbubble cavitation is marked by one or two large oscillations followed by immediate microbubble destruction or collapse which is confirmed with the optical scatter signal. The disappearance of the optical signal indicates destruction in the phospholipid shell and consequent release of the encapsulated perfluorocarbon gas due to the loss of the gas–water index mismatch. The spectral components are broadened due to the few number of oscillation cycles and broadband frequency spread associated with microbubble cavitation. Figure 4 summarizes the average acoustic response and peak harmonic signatures of multiple individual microbubble measurements of Definity (a) and albumin-shelled (b) microbubbles at 2.25 MHz with 15 cycles per pulse. At 1.3 MPa, instant microbubble cavitation was observed resulting in spreading of the frequency spectrum and a reduction in the peak amplitude at the fundamental and harmonic frequencies, though total broadband energy is greater. Nonlinear oscillation and cavitation thresholds are in agreement with ultrasound backscatter measurements.3, 4, 16 Stiffer albumin-shelled microbubbles were not observed to have cavitation under these conditions, with their energy distribution remaining at the fundamental and harmonic frequencies. 4.ConclusionsWe reported here a practical and simple approach to obtain real-time dynamic characteristics of ultrasound contrast microbubbles. Due to the low background noise of the system, high SNR is attained allowing for single sweep acquisition of microbubble dynamics in real-time. We acquired relative light scatter intensity oscillations in response to pulsed ultrasound insonation. Due to high signal-to-noise ratios, with at least a 10-fold increase over previously published work,5 individual microbubble dynamics were acquired at various ultrasound intensities corresponding to linear and nonlinear oscillation and microbubble cavitation regimes. In addition, higher-order harmonic signatures are acquired simultaneously using a single optical detector. Individual commercial Definity microbubbles were compared to in-house formulated albumin-stabilized microbubbles to demonstrate the system's sensitivity and accuracy over thousands of microbubbles and ultrasound cycles. Fundamental frequency and harmonic signatures were observed from Fourier analysis of raw nonaveraged experimental data. Due to the sensitivity and accuracy of this light scattering tool for ultrasound contrast agent characterization, it will be used for further characterization of custom-formulated microbubbles and ultrasound sensitive particles. AcknowledgmentsWork described in this paper was supported in part by NIH Grant No. T32EB005970, RSNA research resident award RR0917, and DOD Award W81XWH-07–1-0125. ReferencesP. Jiang, Z. Peng, and
J. C. Lazenby,
“A new tissue harmonic imaging scheme with better fundamental frequency cancellation and higher signal-to-noise ratio,”
1589
–1594
(1998). Google Scholar
M. R. Sprague, E. Chérin, D. E. Goertz, and
F. S. Foster,
“Nonlinear emission from individual bound microbubbles at high frequencies,”
Ultra. Med. Biol., 36 313
–324
(2010). https://doi.org/10.1016/j.ultrasmedbio.2009.08.010 Google Scholar
J. E. Chomas, P. A. Dayton, D. May, J. Allen, A. Klibanov, and
K. Ferrara,
“Optical observation of contrast agent destruction,”
Appl. Phys. Lett., 77 1056
–1058
(2000). https://doi.org/10.1063/1.1287519 Google Scholar
V. Garbin, D. Cojoc, E. Ferrari, E. Di Fabrizio, M. L. J. Overvelde, S. M. van Der Meer, N. de Jong, D. Lohse, and
M. Versluis,
“Changes in microbubble dynamics near a boundary revealed by combined optical micromanipulation and high-speed imaging,”
Appl. Phys. Lett., 90 114103
(2007). https://doi.org/10.1063/1.2713164 Google Scholar
J. Guan and
T. J. Matula,
“Using light scattering to measure the response of individual ultrasound contrast microbubbles subjected to pulsed ultrasound in vitro,”
J. Acoust. Soc. Am., 116 2832
–2842
(2004). https://doi.org/10.1121/1.1795334 Google Scholar
J. Tu, J. Guan, Y. Qiu, and
T. J. Matula,
“Estimating the shell parameters of SonoVue microbubbles using light scattering,”
J. Acoust. Soc. Am., 126 2954
–2962
(2009). https://doi.org/10.1121/1.3242346 Google Scholar
D. L. Kingsbury and
P. L. Marston,
“Mie scattering near the critical angle of bubbles in water,”
J. Opt. Soc. Am., 71 358
–361
(1981). https://doi.org/10.1364/JOSA.71.000358 Google Scholar
P. L. Marston and
S. C. Billette,
“Scattering of light by a coated bubble in water near the critical and Brewster scattering angles,”
J. Acoust. Soc. Am., 80 S59
(1986). https://doi.org/10.1121/1.2023875 Google Scholar
M. S. Plesset and
A. Prosperetti,
“Bubble dynamics and cavitation,”
Ann. Rev. Fluid Mech., 9 145
–185
(1977). https://doi.org/10.1146/annurev.fl.09.010177.001045 Google Scholar
C. C. Church,
“The effects of an elastic solid surface layer on the radial pulsations of gas bubbles,”
J. Acoust. Soc. Am., 97 1510
–1521
(1995). https://doi.org/10.1121/1.412091 Google Scholar
K. E. Morgan, J. S. Allen, P. A. Dayton, J. E. Chomas, A. L. Klibaov, and
K. W. Ferrara,
“Experimental and theoretical evaluation of microbubble behavior: effect of transmitted phase and bubble size,”
IEEE Trans. Ultrasonics, Ferroelectrics and Frequency Control, 47
(6), 1494
–1509
(2000). https://doi.org/10.1109/58.883539 Google Scholar
“Lantheus Medical Imaging, Definity Prescribing Information,”
(2008). Google Scholar
P. L. Marston and
D. L. Kingsbury,
“Scattering by a bubble in water near the critical angle: interference effects,”
J. Opt. Soc. Am., 71 192
–196
(1981). https://doi.org/10.1364/JOSA.71.000192 Google Scholar
M. W. Grinstaff and
K. S. Suslick,
“Air-filled proteinaceous microbubbles: synthesis of an echo-contrast agent,”
Proc. Natl. Acad. Sci. U. S. A., 88 7708
–7710
(1991). https://doi.org/10.1073/pnas.88.17.7708 Google Scholar
M. Postema and
G. Schmitz,
“Ultrasonic bubbles in medicine: Influence of the shell,”
Ultrason. Sonochem., 14 438
–444
(2007). https://doi.org/10.1016/j.ultsonch.2006.09.013 Google Scholar
V. Sboros, C. M. Moran, S. D. Pye, and
W. N. McDicken,
“An in vitro study of microbubble contrast agent using a clinical ultrasound imaging system,”
Phys. Med. Biol., 49 159
–173
(2004). https://doi.org/10.1088/0031-9155/49/1/011 Google Scholar
|