

|
|
1.IntroductionOrganic dyes have found wide application as optical markers in medical diagnostics of various diseases. One such dye is indocyanine green (ICG). ICG strongly absorbs light in a wavelength range of 600–900 nm1, 2 for which biological tissues are relatively transparent.3 In this spectral region, the near-infrared light has its maximum depth of penetration in tissue due to the low absorption of oxygenated hemoglobin, deoxygenated hemoglobin, and water. Indocyanine green is actively used in various areas of medicine. In photodynamic therapy, ICG can be considered as a promising treatment for superficial cancer, specifically for topical therapy of melanoma.4 In oncology, the diagnostic methods based on optical imaging with use of ICG as a contrast-enhancing dye have the potential to localize tumors, identify tumor remaining at the resection margins, and determine the tumor grade.5, 6, 7 It was also reported that ICG-fluorescent imaging enables the highly sensitive real-time identification of small and grossly unidentifiable liver cancers during surgery, enhancing the accuracy of liver resection and operative staging.8 In 1970s, it was shown that infrared angiography of the retina of the eye is feasible with a venous injection of ICG.9 Furthermore, ICG has found a wide use in ophthalmic imaging and videography.10, 11, 12 ICG was also considered as a contrast agent for capillaroscopy carried out on the nail folds of the fingers.13 Such a method potentially allows for improved detection of skin capillary aneurysms in patients with progressive systemic sclerosis and related disorders. Clearance of ICG in blood has been proposed as an objective test for assessment of liver function.14, 15, 16, 17 It has been demonstrated that ICG reflects the degree of reperfusion injury and is a good early marker of primary graft function following liver transplantation.18 It was also shown that, in patients undergoing liver resection, the liver function assessment with the use of ICG injection allows for prediction and early detection of posthepatectomy liver dysfunction.19 ICG was applied as a contrast agent allowing for assessment of overall circulating blood volume.20 The dye was also tested in studies of blood volume in the brain21, 22 and muscles.23 A tissue dye densitometry technique has been developed and applied for simultaneous measurements of cerebral blood volume and total circulating blood volume using near-infrared spatially resolved spectroscopy and the injection of ICG.24 Furthermore, ICG was used as a tracer for the minimally invasive assessment of cerebral blood flow.25, 26, 27 The method developed is based on a combination of ICG injection with optical monitoring of its inflow by bilateral placing of the optodes on the forehead. In last decade, it was shown that the time-resolved reflectance measurement on the healthy adult head during intravenous injection of ICG allows one to assess inflow a washout of the dye with discrimination of extra- and intracerebral compartments.28, 29, 30 In the above-mentioned studies focused on brain perfusion and blood-flow measurements, the high absorption of light from the near-infrared wavelength region by the ICG is utilized. Recently, it was also reported that fluorescence of ICG circulating inside the brain can be excited and detected noninvasively on the surface of the human adult head in vivo.31, 32 This novel modality may be potentially used not only for detection of nonspecific dyes, such as ICG, but also for the fluorescent contrast agents specifically accumulated in the tissue.33 The above-described studies related to the use of ICG as a contrast agent show that this dye can be applied with benefit for patients in various branches of medicine. The basic physical and chemical properties of ICG and some clinical features related to these properties were reviewed by Desmettre 34 The absorption properties of ICG in liquid solution have been studied in detail by many authors.35, 36, 37 It has been found35 that after intravenous injection, the main peak of the absorption spectrum of ICG shifts ∼25 nm toward the higher wavelengths, from 780 to 805 nm. This shift corresponds to the change in the physicochemical environment of the molecules within the first seconds after injection.38, 39 The spectral properties of the ICG were studied in more detail considering different solvent polarity.40, 41 The intensity of fluorescence light emitted by the dye depends either on the optical properties of the tissue (at excitation and emission wavelengths) or concentration of the fluorophore. The quantum yield of triplet formation for ICG dissolved in dimethylsulfoxide, methanol, water, and aqueous albumin solution at room temperature measured by a picosecond laser double-pulse fluorescence excitation technique was reported by Reindl 42 Photoisomerization, triplet formation, and photodegradation dynamics of ICG-sodium iodide in dimethylsulfoxide, methanol, water, and human plasma was also studied by Gratz 43 These authors reported that triplet-state molecules are characterized by low quantum yields of triplet formation (of order 10−5) and short triplet-state lifetime. Another parameter that can provide information about the characteristics of the surrounding medium of the dye is its fluorescence lifetime. Fluorescence lifetime τ is an important parameter that influences the results of in vivo measurements and potentially allows for sensing the environment of the dye in the tissue. The fluorescence lifetime of organic dyes is highly sensitive to the properties of the environment described by such quantities as pH, oxygen saturation, polarity, and protein-binding properties. The measurements of the fluorescence lifetime of the dye serves as a tool in molecular imaging44 due to its high contrast and diagnostic capabilities. It has been reported in the literature that the fluorescence lifetime value of endogenous dyes is greater in malignant than in normal tissue.45, 46, 47 Recently, Akers made an attempt to establish the correlation between the in vitro (in various solvents) and in vivo results for eight near-infrared fluorescent molecular probes.48 Comparing different media, the authors reported that double-exponential fittings of the fluorescence decays of dyes dissolved in aqueous albumin (a major transport protein in blood) solutions allows one to accurately predict the range of fluorescence lifetimes observed in vivo. In this paper, we present results of measurements of the fluorescence lifetime of ICG. The measurements were carried with a setup that was equipped with a femtosecond Ti:Sa laser, the sensitive detection based on multichannel photomultiplier tube system and time-correlated single-photon counting (TCSPC) electronics. Multidimensional time-correlated single photon counting is based on the excitation of the sample by a high-repetition-rate laser and the detection of single photons of the fluorescence signal in several detection channels. The measurement system allowed one to determine the distribution of times of arrival (DTA) of fluorescence photons for different fluorescence emission wavelengths. Furthermore, tuning of the excitation laser light allows one to study excitation-emission properties of the dye. Fluorescence lifetimes of the ICG were determined for various concentrations of the dye in different solvents. As a reference, we studied ICG in water solutions obtaining results matching well with the data published by other authors. Furthermore, we focused on solution of ICG in intralipid and milk because these solvents are frequently used in multiple scattering media studies.49, 50, 51, 52, 53, 54 We will show that when these solvents are used in studies considering fluorescence of ICG, its lifetime should be analyzed with care because it may depend on concentration of the dye. 2.Materials and Methods2.1.Instrumentation and Measurement ProcedureWe constructed a time-resolved multichannel spectral system based on time-correlated single-photon counting electronics. Fluorescence of the dye was excited by femtosecond pulses generated with Ti:Sa laser source MAITAI (Spectra Physics, Santa Clara, California) working at a repetition frequency of 80 MHz. The photon counting was controlled with the use of specialized PCI cards mounted in the PC. Detector controller card (DCC)-100 card (Becker & Hickl, Berlin, Germany) was used for driving the power supply of photomultiplier tubes (PMTs). SPC-830 board (Becker & Hickl, Germany) was applied for photon counting with subnanosecond time resolution. Measured distributions of times of arrival of fluorescence photons contained 4096 data points with time channels of the width Δt = 2.93 ps. An integrated polychromator PMLSpec equipped with PMTs allows for simultaneous observation of arrival of photons on 16 spectral channels. The width of the spectral channel was ∼12 nm, and the spectral range covered was 208 nm. This spectral range was adjusted in such a way that the measurement covered wavelengths of 772–930 nm. Application of the TCSPC technique with routing of single-photon signals from multiple detector setup allows for derivation of distributions of arrival times of photons detected by multiple PMTs. For the setups with multiple detection channels and a single time-correlated single-photon counting board, the count rate must be limited because the TCSPC electronics cannot operate at more than one count per excitation cycle. This limitation is connected to the fact that, for higher count rates, only first photon appearing in the cycle is counted (“pile-up” effect), which leads to distortion of the distribution of times of arrival of photons.55 In the measurements carried out, the detection system operated at low count rates. The count-rate ratio was ≪10% of the excitation repetition rate for all counts from all detection channels operating with maximum of fluorescence. Although it was shown by Suhling 56 that the allowed count-rate ratio is 38% for 16-channel detection system. Measurements of the distributions of arrival times of fluorescence photons were carried out in three steps: (i) the registration of a single photon, (ii) measurement of the time of the registration of the photon within the period of the laser repetition, and (iii) accumulation of the distribution of times of arrivals of the photons. The accumulation of the arrival times lasts 5 s. Considering frequency of laser pulse repetition of 80 MHz, the period in which the single-photon events were recorded was 12.5 ns. All the spectra have been obtained with the setup presented in Fig. 1. A sample of dye in the plastic cuvette transparent for electromagnetic waves in region of 350–900 nm (Ocean Optics, Dunedin, Florida) was placed between the source and detector, which are located in the same plane with a 90-deg angle. To avoid the anisotropy effects, the emission polarizer was installed at a magic angle of 54.7 deg. The fluorescence of dye was excited by the light with wavelength tuned within the range of 740–790 nm (with steps of 5 nm). The fluorescence photons from the sample were collimated by the first lens (Fig. 1). The interference filter RLP793 (Thin Film Imaging Technologies, Inc., Greenfield, Massachusetts) was used to filter out the excitation light and pass the emission light with a wavelength of 800–860 nm. A second lens was used to focus the light on the detector. The light reemitted from the sample was gathered by a polychromator PMLSpec. To generate the synchronization signal for SPC modules from a laser pulse sequence, a fast photodiode module PHD-400 (Becker & Hickl, Berlin, Germany) was used. This photodiode module was powered directly from the SPC card. The power of the laser beam illuminating the sample was restricted to 3 mW. The instrumental response function of the setup for all excitation wavelengths was obtained by measurements carried out in the same geometry of the setup using a Rayleigh scatter of Ludox-40 (0.04% in water; Sigma-Aldrich, Seelze, Germany). 2.2.Sample PreparationICG powder for medical application (Pulsion®, Pulsion Medical System AG, Germany) was first dissolved in microbiologically and chemically pure water for the injections (Aqua pro injectione, Polpharma, Poland) and further diluted in the appropriate solvent: sterile water, ultra high temperature (UHT) milk (with 3.2% content of fat), and 1% intralipid solution (Fresenius Kabi AG, Germany). Solutions of different dye concentration, 160, 80, 40, 20, 10, and 1.7 μM, were investigated. The last concentration corresponds to that which is estimated in the brain tissue after injection of ICG bolus in the in vivo examinations.31 In order to avoid effects of nonstability of the lifetime spectra of the dye (photodegradation of ICG), the measurements were carried out immediately after preparation of the solutions. 2.3.Data Analysis and Fluorescence Lifetime EstimationFor the collected fluorescence spectra of ICG, the analysis of the DTA of fluorescence photons was carried out. Analysis of DTA allowed for evaluation of lifetimes of the fluorophore for all solutions used. In order to estimate the value of the fluorescence lifetime of ICG on the basis of the measured data, the fitting procedure of corresponding theoretical decay of fluorescence emission with measured distributions of times of arrival of photons was applied. Because of the systematic wobble in the transit time of the channels in the photomultipliers of these types, the fitting procedure must take into account measured instrument response function (IRF). This function measured on every channel contained information about the time profile of the laser excitation and the time characteristics of the whole measurement system. Full width at half maximum of the IRF of our experimental setup (Fig. 2) was 140 ± 10 ps for all detection channels. Fig. 2(a) Instrumental response function of the experimental setup at 760 nm and (b) time-resolved spectrum of ICG with a concentration of 1.7 μM dissolved in 1% intralipid solution. The excitation wavelength λexc = 760 nm.  The fluorescence lifetime was estimated with the use of fitting procedures. Single- or double-exponential decay models were used, depending on the solvent in which ICG was dissolved. For the single exponential decay model, the theoretical curve is described by Eq. 1[TeX:] \documentclass[12pt]{minimal}\begin{document}\begin{equation} y = A{\rm exp}^{ - (t - t_0)/\tau } + y_0. \end{equation}\end{document}For determination of ICG fluorescence lifetime, the FluoFit v.4.4 software was used (PicoQuant, Germany). The procedure of data analysis with the FluoFit program applied in our studies is shown in Fig. 3. Distribution of arrival times of fluorescence photons (dark gray curve) emitted by ICG dissolved in water is shown at emission wavelength of 823 nm. The black curve is the calculated fit of a single-exponential function. This curve represents a convolution of the IRF (light gray line) with the theoretical intensity decay function described by Eq. 1. Fig. 3Time-resolved data for 1.7-μM solution of ICG in water. Dark gray line: distribution of arrival times of fluorescence photons for ICG emission at 823 nm. The excitation wavelength λexc = 765 nm. Light gray line: instrumental response function. Black line: the fitted curve. The lower panel shows the residual function shows minor systematic error of the fit.  3.Results3.1.Indocyanine Green Emission SpectraThe emission spectrum of ICG in water was observed in spectral channels covering the wavelength range of 798–872 nm for the ICG solutions with a concentration of 1.7, 10, 20, and 40 μM. For the higher concentrations of ICG solutions (80 and 160 μM), the fluorescence spectra seem to be a little broader, covering the region of 798–884 nm. The spectra are dominated by a main peak at a wavelength of ∼823 nm. The precise wavelength of the maximum is difficult to determine because of limited spectral resolution of the setup (the wavelength interval between the channels is ∼12 nm). Figure 4a shows the profile of fluorescence spectra for different concentrations of the dye dissolved in water. A shift of the main emission peak toward shorter wavelengths can be observed when the concentration of ICG decreases. For the solution of 1.7 μM of ICG, it can be found that the maximum of emission is ∼810 nm. The dependence of emission maxima may refer to two forms of the dye, that is the monomeric form with emission maximum at 835 nm and an oligomeric form with emission maximum at 820 nm. It can be noted that the number of fluorescence photons detected increases with concentration up to a certain concentration level and than decreases. In our case, this boundary value of concentration was ∼10 μM. Fig. 4Fluorescence spectra of freshly prepared solutions of ICG of different concentration in (a) water, (b) milk, and (c) 1% intralipid solution. The excitation wavelength λexc = 760 nm. Sum of photons detected at different wavelengths are presented. Lines are shown as a guide for the eyes. 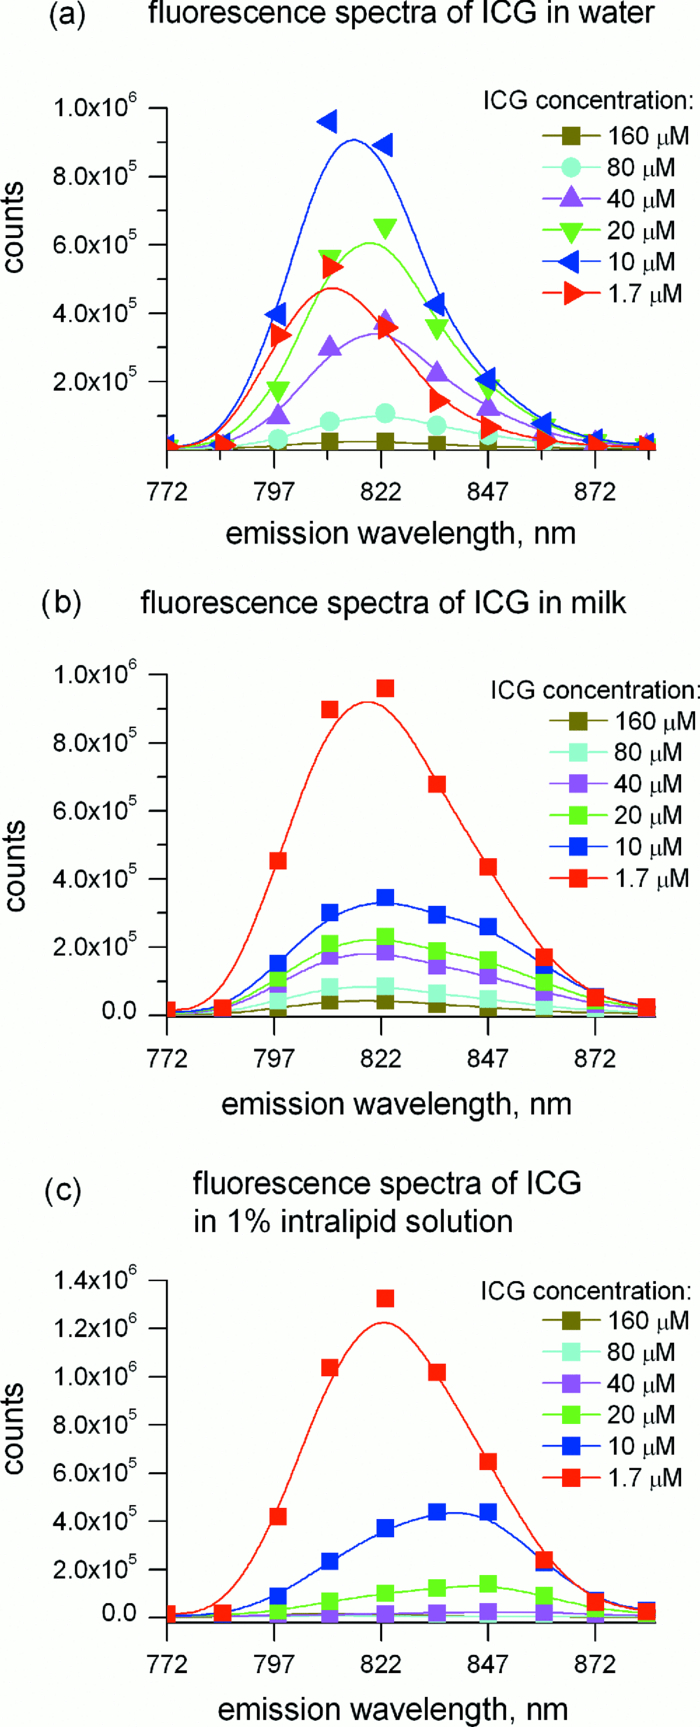 Figure 4b shows the fluorescence spectra for different concentrations of the dye in the milk, and Fig. 4c for ICG dissolved in 1% intralipid solution. For both solvents, the fluorescence spectra were found in the wavelength region of 798–860 nm. The emission spectrum of ICG in milk shows the tendency of an increase of the emission intensity with a decrease of ICG concentration. The main peak was found at ∼822 nm, and the second peak of weaker intensity can be observed at a longer wavelength of ∼845 nm. In the intralipid solution, the intensity of fluorescence of high ICG concentration was low. For both solvents at the concentration of 10 μM, the maximum of emission spectra is at ∼845 nm. With a decrease of the concentration, the maxima shift to the shorter wavelengths and a rapid increase of the spectra amplitude were observed. For all studied solvents, the yield of fluorescence depends of two factors: the concentration of the dye and of the excitation wavelength. The dependence of the excitation wavelength is shown in Fig. 5 for all the solvents at concentration of ICG 1.7 μM in the form of excitation-emission color maps. In a series of measurements, it was found that the fluorescence intensity increased with an increase of λexc. The maximum intensity can be found between λexc = 780 and 785 nm. At long excitation and short emission wavelength, the excitation peak dominates the measured distributions of arrival time of fluorescence photons. Thus, the measurement cannot be carried out because the excitation photons cannot be blocked by the filter. Fig. 5Number of emitted fluorescence photons as a function of excitation and emission wavelengths for 1.7-μM ICG solution in water, 1% intralipid, and milk. Emission intensities are displayed by a contour plot with color scale. The black areas in the bottom left corner mark ranges of excitation and emission wavelengths at which the measurements were impossible. At long excitation and short emission wavelengths, the measurement cannot be carried out because the excitation photons cannot be blocked by the filter.  3.2.Indocyanine Green Fluorescence LifetimeThere were only small differences in fluorescence lifetimes of the ICG in water solution for various concentrations of the dye [Fig. 6a]. The fluorescence lifetimes of the solution of various concentrations were determined by the single-exponent fitting procedure, and the τ values were estimated independently for all the spectral channels where the fluorescence decay was recorded (the emission wavelength from 798 to 872 nm with steps of 12.5 nm). The fluorescence decays were measured for 11 excitation wavelengths (λexc) from 740 to 790 with steps of 5 nm. Single-exponential decay functions with similar parameters were fitted for all λexc, showing that the lifetime is independent of excitation wavelength [(see Fig. 6a]. The mean value of fluorescence lifetime of ICG dissolved in water estimated by analysis of all considered excitation-emission wavelengths and concentrations was 0.166 ± 0.02 ns. Fig. 6Distributions of fluorescence lifetime of ICG measured at various combinations of excitation-emission wavelengths for a single concentration of 1.7 μM (left column). Results of statistical analysis of fluorescence lifetime distributions obtained for various concentrations of the dye and combinations of excitation-emission wavelengths (right column). The small box represents the mean value of the fluorescence lifetime. The box shows 25 and 75 percentiles of fluorescence lifetime, and whiskers mark the minimum and maximum values. The median inside the box is the 50th percentile.  For the different concentration of ICG in milk, the single-exponential model allowed one to get a good fit of the theoretical curves to the measured data. The mean fluorescence lifetimes estimated for various excitation-emission wavelength combinations were presented in Fig. 6b. In order to reduce variance of the obtained lifetimes, a global fit was also applied for estimation of the fluorescence lifetimes of the ICG-milk solution. In this procedure, the fitting parameter τ was calculated assuming that for all emission wavelengths the decay curves can be described by the same τ. The fitting was carried for all data obtained for different emission wavelengths. Our results show that the lifetimes are similar for all considered excitation wavelengths and at all emission wavelengths. Results of the independent fit and global fitting procedure are also similar (data not shown). For the ICG-milk solution, the tendency of an increase of the fluorescence lifetime value with a decrease of the ICG concentration can be observed. The fluorescence lifetimes of the solutions of 1%-intralipid ICG of different concentrations were determined by the single-exponent fitting procedure and are presented in Fig. 6c. Again, the values of τ, which were estimated independently for all the spectral channels in which the distribution of times of arrival of fluorescence photons was recorded, were compared to lifetime values obtained by the global fit procedure. Similar results were obtained by both procedures. The calculated lifetimes are independent of excitation wavelength. For the ICG-intralipid solution, the decrease of the fluorescence lifetime with an increase of ICG concentration can be observed. This effect is similar to the tendency noted for ICG-milk solution. 4.DiscussionAnalysis of the number of fluorescence photons emitted by ICG dissolved in different solvents shows that the fluorescence yield of the dye depends on two factors: the concentration of ICG and the excitation wavelength. This effect for solvents with a concentration of ICG 1.7 μM can be observed in Fig. 5. A similar effect was previously reported by Van den Biesen 57 for different ICG concentrations in plasma, where the intensity of fluorescence signal increased for concentrations up to 0.1 mg/ml (≈130 μM) and than rapidly decreased. Decrease of fluorescence intensity at high concentrations of the dye may be connected with the quenching effect, which is explained by the fact that at higher ICG concentrations, dimers and aggregates of indocyanine green are formed that have lower emitting energy.58 Another effect that may explain the decrease of fluorescence intensity at high concentrations of the dye is reabsorption that is connected with the fact that the fluorescence photons may be reabsorbed by the dye itself at high concentrations.57 The ICG emission properties as a function of its concentration in 0.6% Intralipid solution were reported by Yuan 59 This study is focused on the ICG concentration at a range of 0–20 μM. The authors suggest that the reduction of emission strength is caused by the inner-cell effect for large-size samples, such as an infinite medium, while the reabsorption is the main reason for the small size samples. The reduction of the number of emitted photons due to the inner-cell effect is connected with the restricted propagation depth of the excitation light. The depth of light penetration decreases with the increase of ICG concentration due to the increased total absorption of the excitation light. For water solution of ICG, we observed a shift of the wavelength at which the number of fluorescence photons emitted by the dye reaches its maximum caused by changes of concentration of ICG. The limited spectral resolution of the setup did not allow for quantitative analysis; however, it was noted that for higher concentrations of ICG the maximum of emission is observed at longer wavelengths. A similar effect was observed in absorption properties reported by Desmettre 34 Dependence of the optical properties of ICG on the concentration of the dye in water and albumin solution was reported by Landsman 35 These authors show that the aggregation process influences the shape of the absorption spectrum in water and the maximum of absorption shifts from 785 nm for monomers to 690 nm for aggregates. This effect of the shift of the maximum of the absorption spectra was reported also by Urbanska 60 Two absorption peaks were considered to be assigned with the monomeric form of the dye (giving the absorption peak at 778 nm) and an oligomeric form (with maximum absorption at 708 nm). With the increase of concentration, the content of monomeric form decreases, which results with a shift of the wavelengths of maximum absorption toward shorter wavelengths. According to the molecular exciton model of Kasha,61 which qualitatively explains the spectral properties of dye aggregates, this shift in the spectra is explained by the aggregation properties of the dye molecules. Dye molecules can aggregate either in a parallel (H-aggregate) or in a head-to-tail (J-aggregate) fashion. J- and H-aggregates lead to the appearance of intense red-62 and blueshifted63 absorption peaks, strong and weak fluorescence,64, 65, 66 and reduced and increased fluorescence lifetimes,67 compared to monomers. We studied in detail the fluorescence lifetime of ICG dissolved in water for different combinations of excitation-emission wavelengths. We found that the lifetime is relatively independent on these wavelengths as well as on the concentration of the dye. The mean value of the lifetime was 0.166 ± 0.02 ns. The lifetime of ICG in water was previously reported by Akers 48 and Lee 68 to be 0.17 ns. Our result is close to this value. Similarly, for ICG dissolved in milk and intralipid, we found no significant dependence of the lifetime on the excitation-emission wavelength combination. However, the dependence on concentration of the dye was strong [see Fig. 6c]. For the milk, we did not find any study of ICG lifetime in the literature. For the intralipid, some authors report values of lifetime between 0.54 and 0.56 ns for ICG concentrations between 0.0625 and 0.125 μM.69, 70 They suggest that the lifetime is independent on the concentration of the dye. However, their studies covered only small values of ICG concentrations (<2 μM). Our result of lifetime measurements at a concentration of 1.7 μM (0.59 ns) is close to the results reported in these studies. For much higher concentrations of ICG, we found a drop of the lifetime that may be connected with the previously mentioned composition of the sample and domination of oligomeric form of the ICG for high concentration case. In this context, the dynamic quenching effect becomes more significant for the solution with a high concentration of the dye. The fluorescence of H-aggregates is strongly quenched; thus in our case, the decrease in lifetime most probably occurs because of the quenching process, which leads to nonradiative depopulation of the excited state.71 Unfortunately, we could not measure lifetimes of the two forms (monomeric and oligomeric) of ICG independently. Most of the dyes exhibit multiexponential decay kinetics or exist within two or more different states. Thus, lifetime spectroscopy within scattering media should consider a multiple exponential fit.72 Therefore, we tried to perform a double-exponential fit assuming that these two forms of ICG will dominate differently at different concentrations. Unfortunately, results of these tests (not shown in the present paper) showed that the variance of the two lifetimes obtained in the fit was high. This effect suggested that the fit obtained was not a unique solution of the problem. Summarizing, the time- and wavelength-resolved optical system based on the time-resolved multichannel spectral detection was constructed. This system allows for measurements of the fluorescence lifetime of ICG as a function of excitation and emission wavelengths as well as of concentration of the dye. Recording the distribution of arrival times of fluorescent photons at different emission wavelengths and a single-exponential fit procedure allow for quite accurate evaluation of the τ (standard deviation of τ for all excitation-emission wavelengths is <3.3% for the ICG of 1.7 μM concentration dissolved in water). The constructed optical system can be implemented for detection of the fluorescence light originating from ICG circulating in the human head with the evaluation of the spectrum of fluorescence emission.73 In this case, the fluorescence light is passing through tissue with characteristic scattering and absorption properties. Thus, the fluorescence spectrum measured from a fluorophore contained in the tissue is affected by the spectral absorption and scattering properties of the tissue. The shape of the recorded emission spectrum changes according to the detection geometry and composition of optical properties of the medium at excitation and emission wavelength.74 Results presented in this paper may be of use for experimental studies on fluorescence light penetration in multiple scattering media. In many of these studies, milk and intralipid were used frequently as solvents for indocyanine green.49, 50, 51, 52, 53, 54 We have shown that for these solvents the lifetime of fluorescence of ICG may depend on the dye concentration. This effect should be taken into account when analyzing changes in the mean arrival time of fluorescence photons in such optically turbid media. AcknowledgmentsThe research leading to these results has received funding from the European Community's Seventh Framework Programme (No. FP7/2007-2013) under Grant Agreement No. 201076. The study is also partly financed by the Polish–German project: “Hypo- and Hyperperfusion during Subacute Stroke. Tracking Perfusion Dynamics in Stroke Patients with Optical Imaging.” ReferencesJ. M. Maarek, D. P. Holschneider, and
J. Harimoto,
“Fluorescence of indocyanine green in blood: intensity dependence on concentration and stabilization with sodium polyaspartate,”
J. Photochem. Photobiol. B, 65
(2–3), 157
–164
(2001). https://doi.org/10.1016/S1011-1344(01)00264-0 Google Scholar
R. Philip, A. Penzkofer, W. Baumler, R. M. Szeimies, and
C. Abels,
“Absorption and fluorescence spectroscopic investigation of indocyanine green,”
J. Photochem. Photobiol. A, 96
(1–3), 137
(1996). https://doi.org/10.1016/1010-6030(95)04292-X Google Scholar
F. F. Jobsis,
“Noninvasive, infrared monitoring of cerebral and myocardial oxygen sufficiency and circulatory parameters,”
Science, 198
(4323), 1264
–1267
(1977). https://doi.org/10.1126/science.929199 Google Scholar
A. M. Mamoon, A. M. Gamal-Eldeen, M. E. Ruppel, R. J. Smith, T. Tsang, and
L. M. Miller,
“In vitro efficiency and mechanistic role of indocyanine green as photodynamic therapy agent for human melanoma,”
Photodiagnosis Photodyn. Ther., 6
(2), 105
–116
(2009). https://doi.org/10.1016/j.pdpdt.2009.05.002 Google Scholar
D. J. Hawrysz and
E. M. Sevick-Muraca,
“Developments toward diagnostic breast cancer imaging using near-infrared optical measurements and fluorescent contrast agents,”
Neoplasia, 2
(5), 388
–417
(2000). https://doi.org/10.1038/sj.neo.7900118 Google Scholar
M. Gurfinkel, A. B. Thompson, W. Ralston, T. L. Troy, A. L. Moore, T. A. Moore, J. D. Gust, D. Tatman, J. S. Reynolds, B. Muggenburg, K. Nikula, R. Pandey, R. H. Mayer, D. J. Hawrysz, and
E. M. Sevick-Muraca,
“Pharmacokinetics of ICG and HPPH-car for the detection of normal and tumor tissue using fluorescence, near-infrared reflectance imaging: a case study,”
Photochem. Photobiol., 72
(1), 94
–102
(2000). https://doi.org/10.1562/0031-8655(2000)072<0094:POIAHC>2.0.CO;2 Google Scholar
K. Motomura, H. Inaji, Y. Komoike, T. Kasugai, S. Noguchi, and
H. Koyama,
“Sentinel node biopsy guided by indocyanine green dye in breast cancer patients,”
Jpn. J. Clin. Oncol., 29
(12), 604
–607
(1999). https://doi.org/10.1093/jjco/29.12.604 Google Scholar
T. Ishizawa, N. Fukushima, J. Shibahara, K. Masuda, S. Tamura, T. Aoki, K. Hasegawa, Y. Beck, M. Fukayama, and
N. Kokudo,
“Real-time identification of liver cancers by using indocyanine green fluorescent imaging,”
Cancer, 115
(11), 2491
–2504
(2009). https://doi.org/10.1002/cncr.24291 Google Scholar
B. F. Hochheimer,
“Angiography of the retina with indocyanine green,”
Arch. Ophthalmol., 86
(5), 564
–565
(1971). https://doi.org/10.1001/archopht.1971.01000010566014 Google Scholar
L. A. Yannuzzi, M. Hope-Ross, J. S. Slakter, D. R. Guyer, J. A. Sorenson, A. C. Ho, D. E. Sperber, K. B. Freund, and
D. A. Orlock,
“Analysis of vascularized pigment epithelial detachments using indocyanine green videoangiography,”
Retina, 14
(2), 99
–113
(1994). https://doi.org/10.1097/00006982-199414020-00003 Google Scholar
M. Hope-Ross, L. A. Yannuzzi, E. S. Gragoudas, D. R. Guyer, J. S. Slakter, J. A. Sorenson, S. Krupsky, D. A. Orlock, and
C. A. Puliafito,
“Adverse reactions due to indocyanine green,”
Ophthalmology, 101
(3), 529
–533
(1994). https://doi.org/10.1016/S0161-6420(94)31303-0 Google Scholar
D. R. Guyer, L. A. Yannuzzi, J. S. Slakter, J. A. Sorenson, M. Hope-Ross, and
D. R. Orlock,
“Digital indocyanine-green videoangiography of occult choroidal neovascularization,”
Ophthalmology, 101
(10), 1727
–1735
(1994). https://doi.org/10.1016/S0161-6420(94)31124-9 Google Scholar
A. Bollinger, B. Saesseli, U. Hoffmann, and
U. K. Franzeck,
“Intravital detection of skin capillary aneurysms by videomicroscopy with indocyanine green in patients with progressive systemic sclerosis and related disorders,”
Circulation, 83
(2), 546
–551
(1991). Google Scholar
P. Faybik, C. G. Krenn, A. Baker, D. Lahner, G. Berlakovich, H. Steltzer, and
H. Hetz,
“Comparison of invasive and noninvasive measurement of plasma disappearance rate of indocyanine green in patients undergoing liver transplantation: a prospective investigator-blinded study,”
Liver Transpl., 10
(8), 1060
–1064
(2004). https://doi.org/10.1002/lt.20205 Google Scholar
J. Caesar, S. Shaldon, L. Chiandussi, L. Guevara, and
S. Sherlock,
“The use of indocyanine green in the measurement of hepatic blood flow and as a test of hepatic function,”
Clin. Sci., 21
(1), 43
–57
(1961). https://doi.org/10.1172/JCI104365 Google Scholar
A. El-Desoky, A. M. Seifalian, M. Cope, D. T. Delpy, and
B. R. Davidson,
“Experimental study of liver dysfunction evaluated by direct indocyanine green clearance using near infrared spectroscopy,”
Br. J. Surg., 86
(8), 1005
–1011
(1999). https://doi.org/10.1046/j.1365-2168.1999.01186.x Google Scholar
Y. Cao, C. Pan, J. M. Balter, J. F. Platt, I. R. Francis, J. A. Knol, D. Normolle, E. Ben-Josef, R. K. Ten Haken, and
T. S. Lawrence,
“Liver function after irradiation based on computed tomographic portal vein perfusion imaging,”
Int. J. Radiat. Oncol. Biol. Phys., 70
(1), 154
–160
(2008). https://doi.org/10.1016/j.ijrobp.2007.05.078 Google Scholar
J. N. Plevris, R. Jalan, K. I. Bzeizi, M. M. Dollinger, A. Lee, O. J. Garden, and
P. C. Hayes,
“Indocyanine green clearance reflects reperfusion injury following liver transplantation and is an early predictor of graft function,”
J. Hepatol., 30
(1), 142
–148
(1999). https://doi.org/10.1016/S0168-8278(99)80018-X Google Scholar
N. de Liguori Carino, D. A. O’Reilly, K. Dajani, P. Ghaneh, G. J. Poston, and
A. V. Wu,
“Perioperative use of the LiMON method of indocyanine green elimination measurement for the prediction and early detection of post-hepatectomy liver failure,”
Eur. J. Surg. Oncol., 35
(9), 957
–962
(2009). https://doi.org/10.1016/j.ejso.2009.02.003 Google Scholar
M. Haruna, K. Kumon, N. Yahagi, Y. Watanabe, Y. Ishida, N. Kobayashi, and
T. Aoyagi,
“Blood volume measurement at the bedside using ICG pulse spectrophotometry,”
Anesthesiology, 89
(6), 1322
–1328
(1998). https://doi.org/10.1097/00000542-199812000-00008 Google Scholar
J. Patel, K. Marks, I. Roberts, D. Azzopardi, and
A. D. Edwards,
“Measurement of cerebral blood flow in newborn infants using near infrared spectroscopy with indocyanine green,”
Pediatr. Res., 43
(1), 34
–39
(1998). https://doi.org/10.1203/00006450-199801000-00006 Google Scholar
P. Hopton, T. S. Walsh, and
A. Lee,
“Measurement of cerebral blood volume using near-infrared spectroscopy and indocyanine green elimination,”
J. Appl. Physiol., 87
(5), 1981
–1987
(1999). Google Scholar
J. A. Guenette, I. Vogiatzis, S. Zakynthinos, D. Athanasopoulos, M. Koskolou, S. Golemati, M. Vasilopoulou, H. E. Wagner, C. Roussos, P. D. Wagner, and
R. Boushel,
“Human respiratory muscle blood flow measured by near-infrared spectroscopy and indocyanine green,”
J. Appl. Physiol., 104
(4), 1202
–1210
(2008). https://doi.org/10.1152/japplphysiol.01160.2007 Google Scholar
T. S. Leung, N. Aladangady, C. E. Elwell, D. T. Delpy, and
K. Costeloe,
“A new method for the measurement of cerebral blood volume and total circulating blood volume using near infrared spatially resolved spectroscopy and indocyanine green: application and validation in neonates,”
Pediatr. Res., 55
(1), 134
–141
(2004). https://doi.org/10.1203/01.PDR.0000099775.87684.FB Google Scholar
E. Keller, A. Nadler, H. Alkadhi, S. S. Kollias, Y. Yonekawa, and
P. Niederer,
“Noninvasive measurement of regional cerebral blood flow and regional cerebral blood volume by near-infrared spectroscopy and indocyanine green dye dilution,”
Neuroimage, 20
(2), 828
–839
(2003). https://doi.org/10.1016/S1053-8119(03)00315-X Google Scholar
C. Terborg, S. Bramer, S. Harscher, M. Simon, and
O. W. Witte,
“Bedside assessment of cerebral perfusion reductions in patients with acute ischaemic stroke by near-infrared spectroscopy and indocyanine green,”
J. Neurol. Neurosurg. Psychiatry, 75
(1), 38
–42
(2004). Google Scholar
R. Springett, Y. Sakata, and
D. T. Delpy,
“Precise measurement of cerebral blood flow in newborn piglets from the bolus passage of indocyanine green,”
Phys. Med. Biol., 46
(8), 2209
–2225
(2001). https://doi.org/10.1088/0031-9155/46/8/312 Google Scholar
M. Kohl-Bareis, H. Obrig, J. Steinbrink, J. Malak, K. Uludag, and
A. Villringer,
“Noninvasive monitoring of cerebral blood flow by a dye bolus method: separation of brain from skin and skull signals,”
J. Biomed. Opt., 7
(3), 464
–470
(2002). https://doi.org/10.1117/1.1482719 Google Scholar
A. Liebert, H. Wabnitz, J. Steinbrink, H. Obrig, M. Moller, R. Macdonald, A. Villringer, and
H. Rinneberg,
“Time-resolved multidistance near-infrared spectroscopy of the adult head: intracerebral and extracerebral absorption changes from moments of distribution of times of flight of photons,”
Appl. Opt., 43
(15), 3037
–3047
(2004). https://doi.org/10.1364/AO.43.003037 Google Scholar
A. Liebert, H. Wabnitz, J. Steinbrink, M. Moller, R. Macdonald, H. Rinneberg, A. Villringer, and
H. Obrig,
“Bed-side assessment of cerebral perfusion in stroke patients based on optical monitoring of a dye bolus by time-resolved diffuse reflectance,”
Neuroimage, 24
(2), 426
–435
(2005). https://doi.org/10.1016/j.neuroimage.2004.08.046 Google Scholar
A. Liebert, H. Wabnitz, H. Obrig, R. Erdmann, M. Moller, R. Macdonald, H. Rinneberg, A. Villringer, and
J. Steinbrink,
“Non-invasive detection of fluorescence from exogenous chromophores in the adult human brain,”
Neuroimage, 31
(2), 600
–608
(2006). https://doi.org/10.1016/j.neuroimage.2005.12.046 Google Scholar
J. Steinbrink, A. Liebert, H. Wabnitz, R. Macdonald, H. Obrig, A. Wunder, R. Bourayou, T. Betz, J. Klohs, U. Lindauer, U. Dirnagl, and
A. Villringer,
“Towards noninvasive molecular fluorescence imaging of the human brain,”
Neurodegener. Dis., 5
(5), 296
–303
(2008). https://doi.org/10.1159/000135614 Google Scholar
R. Weissleder,
“A clearer vision for in vivo imaging,”
Nat. Biotechnol., 19
(4), 316
–317
(2001). https://doi.org/10.1038/86684 Google Scholar
T. Desmettre, J. M. Devoisselle, and
S. Mordon,
“Fluorescence properties and metabolic features of indocyanine green (ICG) as related to angiography,”
Surv. Ophthalmol., 45
(1), 15
–27
(2000). https://doi.org/10.1016/S0039-6257(00)00123-5 Google Scholar
M. L. Landsman, G. Kwant, G. A. Mook, and
W. G. Zijlstra,
“Light-absorbing properties, stability, and spectral stabilization of indocyanine green,”
J. Appl. Physiol., 40
(4), 575
–583
(1976). Google Scholar
C. Haritoglou, A. Gandorfer, M. Schaumberger, R. Tadayoni, and
A. Kampik,
“Light-absorbing properties and osmolarity of indocyanine-green depending on concentration and solvent medium,”
Invest. Ophthalmol. Vis. Sci., 44
(6), 2722
–2729
(2003). https://doi.org/10.1167/iovs.02-1283 Google Scholar
C. Haritoglou, W. Freyer, S. G. Priglinger, and
A. Kampik,
“Light absorbing properties of indocyanine green (ICG) in solution and after adsorption to the retinal surface: an ex-vivo approach,”
Graefes Arch. Clin. Exp. Ophthalmol., 244
(9), 1196
–1202
(2006). https://doi.org/10.1007/s00417-005-0216-z Google Scholar
S. Mordon, J. M. Devoisselle, S. Soulie-Begu, and
T. Desmettre,
“Indocyanine green: physicochemical factors affecting its fluorescence in vivo,”
Microvasc. Res., 55
(2), 146
–152
(1998). https://doi.org/10.1006/mvre.1998.2068 Google Scholar
J.-M. Devoisselle, S. Soulie-Begu, H. Maillols, T. Desmettre, and
S. R. Mordon,
“Fluorescence properties of indocyanin green: II. In-vitro study related to in-vivo behavior,”
Proc. SPIE, 2980 293
–302
(1998). https://doi.org/10.1007/s101030050008 Google Scholar
M. Y. Berezin, W. J. Akers, K. Guo, G. M. Fischer, E. Daltrozzo, A. Zumbusch, and
S. Achilefu,
“Long fluorescence lifetime molecular probes based on near infrared pyrrolopyrrole cyanine fluorophores for in vivo imaging,”
Biophys. J., 97
(9), L22
–L24
(2009). https://doi.org/10.1016/j.bpj.2009.08.022 Google Scholar
M. Y. Berezin, H. Lee, W. Akers, and
S. Achilefu,
“Near infrared dyes as lifetime solvatochromic probes for micropolarity measurements of biological systems,”
Biophys. J., 93
(8), 2892
–2899
(2007). https://doi.org/10.1529/biophysj.107.111609 Google Scholar
S. Reindl, A. Penzkofer, S.-H. Gong, M. Landthaler, R. M. Szeimies, C. Abels, and
W. Baumler,
“Quantum yield of triplet formation for indocyanine green,”
J. Photochem. Photobiol. A, 105
(1), 65
–68
(1997). https://doi.org/10.1016/S1010-6030(96)04584-4 Google Scholar
H. Gratz, A. Penzkofer, C. Abelsb, R.-M. Szeimiesb, M. Landthalerb, and
W. Bäumlerb,
“Photo-isomerisation, triplet formation, and photo-degradation dynamics of indocyanine green solutions,”
J. Photochem. Photobiol., 128
(1–3), 101
–109
(1999). https://doi.org/10.1016/S1010-6030(99)00174-4 Google Scholar
C. Bremer, V. Ntziachristos, and
R. Weissleder,
“Optical-based molecular imaging: contrast agents and potential medical applications,”
Eur. Radiol., 13
(2), 231
–243
(2003). https://doi.org/10.1007/s00330-002-1610-0 Google Scholar
D. B. Tata, M. Foresti, J. Cordero,
“Fluorescence polarization spectroscopy and time-resolved fluorescence kinetics of native cancerous and normal rat kidney tissues,”
Biophys. J., 50
(3), 463
–469
(1986). https://doi.org/10.1016/S0006-3495(86)83483-X Google Scholar
S. Andersson-Engels, S. Johansson, U. Stenram, K. Svanberg, and
S. Svanberg,
“Time-resolved laser-induced fluorescence spectroscopy for enhanced demarcation of human atherosclerotic plaques,”
J. Photochem. Photobiol. B, 4
(4), 363
–369
(1990). https://doi.org/10.1016/1011-1344(90)85015-O Google Scholar
A. Pradhan, B. B. Das, K. M. Yoo, J. Cleary, R. Prudente, E. Celmer, and
R. R. Alfano,
“Time-resolved UV photoexcited fluorescence kinetics from malignant and nonmalignant human breast tissues,”
Lasers Life Sci., 4
(4), 225
–234
(1992). Google Scholar
W. J. Akers, M. Y. Berezin, H. Lee, and
S. Achilefu,
“Predicting in vivo fluorescence lifetime behavior of near-infrared fluorescent contrast agents using in vitro measurements,”
J. Biomed. Opt., 13
(5), 054042
(2008). https://doi.org/10.1117/1.2982535 Google Scholar
A. Liebert, H. Wabnitz, D. Grosenick, M. Moller, R. Macdonald, and
H. Rinneberg,
“Evaluation of optical properties of highly scattering media by moments of distributions of times of flight of photons,”
Appl. Opt., 42
(28), 5785
–5792
(2003). https://doi.org/10.1364/AO.42.005785 Google Scholar
D. Milej, M. Kacprzak, N. Zolek, P. Sawosz, A. Gerega, R. Maniewski, and
A. Liebert,
“Advantages of fluorescence over diffuse reflectance measurements tested in phantom experiments with dynamic inflow of ICG,”
Opto-Electron. Rev., 18
(2), 208
–213
(2010). https://doi.org/10.2478/s11772-010-0013-z Google Scholar
M. Kacprzak, A. Liebert, P. Sawosz, N. Zolek, D. Milej, and
R. Maniewski,
“Time-resolved imaging of fluorescent inclusions in optically turbid medium—phantom study,”
Opto-Electron. Rev., 18
(1), 37
–47
(2010). https://doi.org/10.2478/s11772-009-0027-6 Google Scholar
A. Eidsath, V. Chernomordik, A. Gandjbakhche, P. Smith, and
A. Russo,
“Three-dimensional localization of fluorescent masses deeply embedded in tissue,”
Phys Med Biol, 47
(22), 4079
–4092
(2002). https://doi.org/10.1088/0031-9155/47/22/311 Google Scholar
E. Kuwana and
E. M. Sevick-Muraca,
“Fluorescence lifetime spectroscopy in multiply scattering media with dyes exhibiting multiexponential decay kinetics,”
Biophys. J., 83
(2), 1165
–1176
(2002). https://doi.org/10.1016/S0006-3495(02)75240-5 Google Scholar
B. W. Pogue, S. L. Gibbs, B. Chen, and
M. Savellano,
“Fluorescence imaging in vivo: raster scanned point-source imaging provides more accurate quantification than broad beam geometries,”
Technol. Cancer Res. Treat., 3
(1), 15
–21
(2004). Google Scholar
W. Becker, Advanced Time-Correlated Single Photon Counting Techniques, Springer, New York
(2005). Google Scholar
K. Suhling, D. McLoskey, and
D. J. S. Birch,
“Multiplexed single-photon counting. II. the statistical theory of time-correlated measurements,”
Rev. Sci. Instrum., 67
(6), 2238
–2246
(1996). https://doi.org/10.1063/1.1147042 Google Scholar
P. R. van den Biesen, F. H. Jongsma, G. J. Tangelder, and
D. W. Slaaf,
“Yield of fluorescence from indocyanine green in plasma and flowing blood,”
Ann. Biomed. Eng., 23
(4), 475
–481
(1995). https://doi.org/10.1007/BF02584447 Google Scholar
K. G. Romanchuk,
“Fluorescein: physiochemical factors affecting its fluorescence,”
Surv. Ophthalmol., 26
(5), 269
–283
(1982). https://doi.org/10.1016/0039-6257(82)90163-1 Google Scholar
B. Yuan, N. Chen, and
Q. Zhu,
“Emission and absorption properties of indocyanine green in Intralipid solution,”
J. Biomed. Opt., 9
(3), 497
–503
(2004). https://doi.org/10.1117/1.1695411 Google Scholar
K. Urbanska, B. Romanowska-Dixon, Z. Matuszak, J. Oszajca, P. Nowak-Sliwinska, and
G. Stochel,
“Indocyanine green as a prospective sensitizer for photodynamic therapy of melanomas,”
Acta Biochim. Pol., 49
(2), 387
–391
(2002). Google Scholar
M. Kasha, H. R. Rawls, and
M. A. El-Bayoumi,
“The exciton model in molecular spectroscopy,”
Pure and Applied Chemistry, 11
(3–4), 371
–392
(1965). https://doi.org/10.1351/pac196511030371 Google Scholar
E. E. Jelly,
“Spectral absorption and fluorescence of dyes in the molecular state,”
Nature, 138 1009
–1010
(1936). https://doi.org/10.1038/1381009a0 Google Scholar
W. West and
S. Pearce,
“The dimeric state of cyanine dyes,”
J. Phys. Chem., 69
(6), 1894
–1903
(1965). https://doi.org/10.1021/j100890a019 Google Scholar
H. Nakahara, K. Fukuda, D. Möbius, and
H. Kuhn,
“Two-dimensional arrangement of chromophores in J aggregates of long-chain merocyanines and its effect on energy transfer in monolayer systems,”
J. Phys. Chem., 90
(23), 6144
–6148
(1986). https://doi.org/10.1021/j100281a019 Google Scholar
E. L. Quitevis, M.-L. Horng, and
S.-Y. Chen,
“Picosecond pump-probe spectroscopy of dyes on surfaces: electronic energy relaxation in aggregates of pseudoisocyanine on colloidal silica,”
J. Phys. Chem., 92
(2), 256
–260
(1988). https://doi.org/10.1021/j100313a004 Google Scholar
S. Kirstein, H. Möhwald, and
M. Shimomura,
“Crystalline two-dimensional domains of cyanine dyes at interfaces,”
Chem. Phys. Lett., 154
(4), 303
–308
(1989). https://doi.org/10.1016/0009-2614(89)85360-6 Google Scholar
D. C. Barber, R. A. Freitag-Beeston, and
D. G. Whitten,
“Atropisomer-specific formation of premicellar porphyrin J-aggregates in aqueous surfactant solutions,”
J. Phys. Chem., 95
(10), 4074
–4086
(1991). https://doi.org/10.1021/j100163a035 Google Scholar
H. Lee, M. Y. Berezin, M. Henary, L. Strekowski, and
S. Achilefu,
“Fluorescence lifetime properties of near-infrared cyanine dyes in relation to their structures,”
J. Photochem. Photobiol. A, 200
(2–3), 438
–444
(2008). https://doi.org/10.1016/j.jphotochem.2008.09.008 Google Scholar
R. H. Mayer, J. S. Reynolds, and
E. M. Sevick-Muraca,
“Measurement of the fluorescence lifetime in scattering media by frequency-domain photon migration,”
Appl. Opt., 38
(22), 4930
–4938
(1999). https://doi.org/10.1364/AO.38.004930 Google Scholar
E. M. Sevick-Muraca, G. Lopez, J. S. Reynolds, T. L. Troy, and
C. L. Hutchinson,
“Fluorescence and absorption contrast mechanisms for biomedical optical imaging using frequency-domain techniques,”
Photochem. Photobiol., 66
(1), 55
–64
(1997). https://doi.org/10.1111/j.1751-1097.1997.tb03138.x Google Scholar
J. Lakowicz, Principles of Fluorescence Spectroscopy, 3rd ed.Springer, New York
(2006). Google Scholar
E. Kuwana and
E. M. Sevick-Muraca,
“Fluorescence lifetime spectroscopy in multiply scattering media with dyes exhibiting multiexponential decay kinetics,”
Biophys. J., 83
(2), 1165
–1176
(2002). https://doi.org/10.1016/S0006-3495(02)75240-5 Google Scholar
A. Gerega, D. Milej, M. Kacprzak, P. Sawosz, N. Zolek, W. Weigl, E. Mayzner-Zawadzka, R. Maniewski, and
A. Liebert,
“Multi-wavelength time-resolved detection of fluorescence of indocyanine green circulating in the human head,”
JMA56
(2010). Google Scholar
J. Swartling, J. Svensson, D. Bengtsson, K. Terike, and
S. Andersson-Engels,
“Fluorescence spectra provide information on the depth of fluorescent lesions in tissue,”
Appl. Opt., 44
(10), 1934
–1941
(2005). https://doi.org/10.1364/AO.44.001934 Google Scholar
|


