
|
|
|
Fluorescence molecular imaging is a very popular method to study biological molecules, pathways, and events in living cells and tissues.1 With its sensitivity, specificity, noninvasiveness, and cost-effectiveness, fluorescence molecular imaging is widely applied in preclinical and clinical applications. However, after propagating over a few hundred micrometers, fluorescence light would become highly diffusive. The state-of-the-art microscope operates only at depths less than one transport mean free path length in tissue. With the intense scattering signal, it becomes difficult to image a fluorescence probe distribution within a thick biological sample using the current fluorescence microscopy.2, 3 In this letter, we propose a fluorescence tomographic method to reconstruct an optical molecular probe distribution using a standard fluorescence microscope on a thick biological sample. The light propagation through the biological tissue is a complicated process that involves both absorption and scattering. The photon propagation model governs the interaction between light and tissues, and is essential for tomographic imaging with visible and near-IR light. The popular diffusion approximation model (DA) is fairly accurate and efficient in the cases of high scattering and weak absorption in a large tissue sample. However, the DA model suffers from a substantial discrepancy near either sources or boundaries,4 which happens to be the case of microscopic imaging. Monte Carlo simulation (MC) is a statistical technique that accurately traces photon paths in the biological environment. The MC method can give an accurate estimation for light propagation.5 However, the MC method takes long computation time. Recently, the massive parallel approach using general-purpose graphic processing units (GPGPU) has been adopted to speed up the MC simulation. Alerstam showed that GPU-based acceleration could be applied in the MC simulation to obtain a massive speedup over the traditional CPU implementation.6 Recently, we implemented a GPU-based Monte Carlo simulator on a multi-GPU system with the CUDA platform. Using four NVidia Tesla C1050 GPUs, we are able to archive a speedup of over 800 times compared to the same implementation on a single CPU core, enabling the Monte Carlo method to be used in the inverse process. Using the GPU-based Monte Carlo simulation, we developed a Monte Carlo algorithm for fluorescence tomography. Usually, microscopic imaging focuses on a region of interest (ROI) in the biological sample and acquires surface fluorescence scattering signals emitted from optical molecular probes in the ROI. The ROI volume can be discretized into finite volumetric elements. The acquired photon fluence rate data on the surface of the ROI is a linear combination of fluorescence source intensities, Eq. 1[TeX:] \documentclass[12pt]{minimal}\begin{document}\begin{equation} {\bf \Phi } = {\bf A} \cdot {\bf S}, \end{equation}\end{document}In practice, the measurable quantity Φ in Eq. 1 can only be collected on a partial external surface of an object, either upside or downside of a biological sample, while the fluorescence sources are distributed in a three-dimensional (3D) domain. Clearly, the source reconstruction is an ill-conditioned problem, which often produces false solutions due to the existence of multiple solutions and the presence of measurement noise. Regularization is often used to stabilize the reconstruction. With the use of regularization, such as Tikhonov regularization, feasible region constraint,7 and compressive sensing-based l 1-norm regularization,8, 9 fluorescence tomography shows improvements, but the ill-posedness of the problem remains. To find a stable solution, here we introduce a well-posed model to regularize the inverse source problem: Given the prior optical parameters of the sample, including the absorption coefficient μa, scattering coefficient μs, and anisotropic factor g, then the positions and powers of luminescent sources can be uniquely determined from the measurable diffused light signal on the boundary of the ROI under the assumption that the number of isolated luminescent sources n is known in the ROI. Based on this concept, Eq. 1 can be converted to an optimization problem:10 Eq. 2[TeX:] \documentclass[12pt]{minimal}\begin{document}\begin{equation} \left\{ \begin{array}{l} \min \left\| {{\bf \Phi } - {\bf A} \cdot {\bf S}} \right\| \\ S_{i_k } > 0,\quad k = 1,2, \ldots,n \\ S_j = 0,\quad j \notin \left\{ {i_1,i_2, \ldots,i_n } \right\} \\ \end{array} \right., \end{equation}\end{document}Equation 2 is an optimization problem subject to the l 0-regulization, which is non-deterministic polynomial time hard (NP-hard), and cannot be efficiently solved using a commonly adopted gradient-based optimization method. In the work, we developed a differential evolution (DE)-based heuristic reconstruction algorithm to solve the optimization problem.10 DE is based on a spontaneous self-adaptive vector difference operator, and displayed a superior converging behavior with high precision. Experience with numerous benchmark and real-life problems suggests that the DE often has a fast and reliable converging behavior with a relatively small population size. Each candidate solution in DE is a weighted combination of the columns in A. Due to the rapid convergence of DE, the optimizer can delineate the feasible region of the fluorescence sources in a few generations (i.e., iterations), and many of the columns in the discrete Green function A are never used. Taking advantage of this observation, we replace the full Green function construction with an on-the-fly evaluation scheme: whenever a column in A is needed in a candidate solution, and has not been evaluated, that column will be computed by performing the Monte Carlo simulation. Compared with the full Green function evaluation, the on-the-fly scheme saves about 40 to 70% of Monte Carlo runs, which further speeds up the reconstruction process. The constraint on the number of light sources, however, cannot be always obtained in advance. We can heuristically determine the number of light sources by gradually increasing the number of sources and solve the optimization problem in Eq. 2. For each reconstructed source distribution, if two or more sources are so close that they cannot be isolated within a user-provided spatial resolution, they are combined into a single source. After the source combination, the source distribution is equivalent to a previous reconstructed counterpart with a smaller number of sources. Such a number can always be iteratively and heuristically determined to interpret measured data effectively and efficiently.10 We investigated the accuracy and robustness of the proposed fluorescence microtomography approach in experiments on biomimetic tissue scaffolds. Three poly (D,L-lactide) (PDLA) scaffolds were fabricated using an electrospinning technique12 with thicknesses of 0.65, 0.8, and 1.4 mm, respectively. The optical properties were measured using a spectrophotometer (Varian Cary 5000 UV-Vis-NIR, GMI, Inc.). The absorption coefficient is approximately 0.01 mm−1, the scattering coefficient 15.0 mm−1, and the anisotropic factor 0.9. Fluorescence microbeads of 90 μm diameter (Spherotech Inc.) were laminated and pressed onto each scaffold sample to mimic green fluorescence labeled cells. The actual microbead distribution was captured under a fluorescence microscope, as shown in Fig. 1, and serves as the control image. The scaffold was illuminated using a uniform field of blue laser light (λ = 473 nm) to excite the microbeads, and the emission signal captured using an EMCCD camera with a 1x long working distance lens (Mitutoyo, M Plan 1×), creating a field of view of 8.192 mm × 8.192 mm, which is the same as the size of the EMCCD sensor. From each set of captured emission signals, we reconstructed the microbead distribution, as shown in Fig. 2. The on-fly matrix evaluation and optimization took about 20 minus. The results show no significant difference in localization accuracy over all the scaffold thicknesses. Figures 2b, 2e, 2h present maximum position errors of ∼250, ∼275, and ∼500 μm respectively. The theoretical spatial resolution is finer based on the numerical studies, which is around 100 to 150 μm (∼2 to 3 pixels) in the lateral and axial directions with the current imaging setup. These reconstruction errors were relative to the size of ROI, and induced from the measurement noise rather than the ill-posedness of the reconstruction. This claim was confirmed in our numerical simulation where a reduced measurement noise was correlated to an improved location accuracy. Fig. 2Scaffold experiment results: (a) An microbead fluorescence emission image from a 0.65-mm thick scaffold; (b) a reconstructed microbead distribution from (a); (c) the projected fluorescence emission image from (b); (d) a microbead fluorescence emission image from a 0.8-mm thick scaffold; (e) the reconstructed microbead distribution from (d); (f) the projected fluorescence emission image from (e); (g) a microbead fluorescence emission image from a 1.4-mm thick scaffold; (h) the reconstructed microbead distribution from (g); and (i) the projected fluorescence emission image from (h). 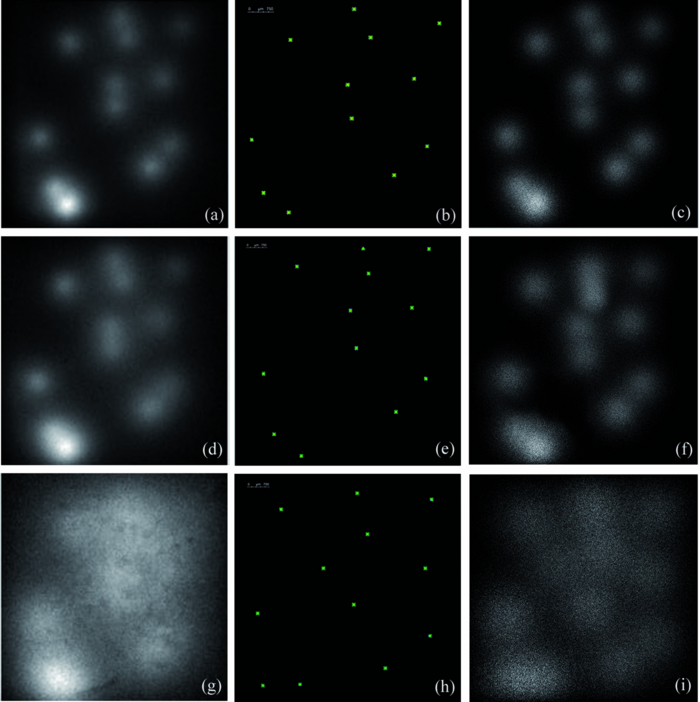 In summary, we have developed a novel fluorescence microtomography approach to reconstruct fluorescence reporters in thick biological samples. This tomographic imaging method is based on a well-posed inverse model we have established, and has a unique and stable solution. Our experiments have demonstrated that the proposed fluorescence microtomographic method is able to localize and quantify an optical molecular probe distribution accurately, up to a spatial resolution of several hundred micrometers in relatively thick and highly opaque samples. Using a powerful microscope setup, we expect further improvements in spatial resolution for fluorescence microtomography. AcknowledgmentsThe authors acknowledge the support by the National Institutes of Health Grant Nos. NIH/NHLBI, HL098912, and NIH/NCI CA135151, as well as the Virginia Tech Institute for Critical Technology and Applied Science grant “Holey Scaffolds.” ReferencesJ. W. Lichtman and
J. Conchello,
“Fluorescence microscopy,”
Nat. Methods, 2 910
–919
(2005). https://doi.org/10.1038/nmeth817 Google Scholar
F. Klauschen, M. Ishii, H. Qi, M. Bajénoff, J. G. Egen, R. N. Germain, and
M. Meier-Schellersheim,
“Quantifying cellular interaction dynamics in 3D fluorescence microscopy data,”
Nature Protocols, 4 1305
–1311
(2009). https://doi.org/10.1038/nprot.2009.129 Google Scholar
C. Vinegoni, C. Pitsouli, D. Razansky, N. Perrimon, and
V. Ntziachristos,
“In vivo imaging of Drosophila melanogaster pupae with mesoscopic fluorescence tomography,”
Nat. Methods, 5 25
–47
(2008). https://doi.org/10.1038/nmeth1149 Google Scholar
G. Y. Panasyuk, V. A. Markel, and
J. C. Schotland,
“Superresolution and corrections to the diffusion approximation in optical tomography,”
Appl. Phys. Lett., 87 101111
(2005). https://doi.org/10.1063/1.2040010 Google Scholar
L. V. Wang, S. L. Jacques, and
L.-Q. Zheng,
“MCML-Monte Carlo modeling of photon transport in multi-layered tissues,”
Comput. Methods Programs Biomed., 47 131
–146
(1995). https://doi.org/10.1016/0169-2607(95)01640-F Google Scholar
E. Alerstam, T. Svensson, and
S. Andersson-Engels,
“Parallel computing with graphics processing units for high-speed Monte Carlo simulation of photon migration,”
J. Biomed. Opt., 13 060504
(2008). https://doi.org/10.1117/1.3041496 Google Scholar
W. Cong, G. Wang, D. Kumar, Y. Liu, M. Jiang, L. Wang, E. Hoffman, G. McLennan, P. McCray, J. Zabner, and
A. Cong,
“Practical reconstruction method for bioluminescence tomography,”
Opt. Express, 13 6756
–6771
(2005). https://doi.org/10.1364/OPEX.13.006756 Google Scholar
Y. Lu, X. Zhang, A. Douraghy, D. Stout, J. Tian, T. F. Chan, and
A. F. Chatziioannou,
“Source reconstruction for spectrally-resolved bioluminescence tomography with sparse a priori information,”
Opt. Express, 17 8062
–8080
(2009). https://doi.org/10.1364/OE.17.008062 Google Scholar
H. Gao and
H. Zhao,
“Multilevel bioluminescence tomography based on radiative transfer equation Part 1: l1 regularization,”
Opt. Express, 18 1854
–1871
(2010). https://doi.org/10.1364/OE.18.001854 Google Scholar
A. Cong, W. Cong, Y. Lu, P. Santago, A. Chatziioannou, and
G. Wang,
“Differential Evolution Approach for Regularized Bioluminescence Tomography,”
IEEE Trans. Biomed. Eng., 57 2229
–2238
(2010). https://doi.org/10.1109/TBME.2010.2041452 Google Scholar
G. Wang, Y. Li, and
M. Jiang,
“Uniqueness theorems in bioluminescence tomography,”
Med. Phys., 31 2289
–2299
(2004). https://doi.org/10.1118/1.1766420 Google Scholar
L. D. Wright, R. T. Young, T. Andric, and
J. W. Freeman,
“Fabrication and mechanical characterization of 3D electrospun scaffolds for tissue engineering,”
Biomed. Mater., 5 055006
(2010). https://doi.org/10.1088/1748-6041/5/5/055006 Google Scholar
|


