
|
|
|
The cell cycle is an ordered series of events that describes the intervals of cell growth, DNA replication, and mitosis that precede cell division. Abnormal cell cycles and increased proliferation are common features of many human cancer cells and quantitative analysis of cell cycle profiles is an important tool for cancer diagnosis.1, 2 Dividing eukaryotic cells progress through the cell cycles that describe four distinct phases during each cell division: G1, S, G2, and M phases. DNA content is often experimentally used to distinguish cells in different phases of the cell cycle. In G1-phase, normal human diploid cells [2N (or 46 chromosomes)] containing 7.14 pg of DNA grow as they accumulate the nutrients required for DNA replication and mitosis. During the synthesis phase (S-phase), chromosomes are replicated and cells double their DNA content from 7.14 (2N) to 14.28 pg [4N (92 chromosomes)].3 In the G2-phase, DNA repair is completed as cells prepare for mitosis (M phase). In mitosis, the chromosomes are equally partitioned into two daughter cells as the parental cell divides. In this letter, we examine the nuclear refractive index, a recently described optical property of cell nucleus, as synchronized cells increase their DNA content and progress through the cell cycle. The refractive index is often used to identify a substance, or quantify the concentration and density of particular macromolecules in cells. This parameter provides fundamental biophysical information about the composition and organizational structure of cells. Cell refractive index has been explored in living cells using interference microscopy, quantitative phase microscopy, and confocal light absorption and scattering spectroscopic microscopy. 4, 5, 6, 7, 8, 9, 10, 11 The significance and great potential of the nuclear refractive index in the diagnosis and treatment of human cancers has not been well recognized. Recently, we quantified the nuclear refractive index in histology tissue specimens derived from patients with various types of cancer using spatial-domain low-coherence quantitative phase microscopy (SL-QPM), a new instrument that allows the quantification of subtle changes in the optical path length with a sensitivity of 0.9 nm.12, 13, 14 We found that the nuclear refractive index is significantly increased in malignant cells derived from cancer patients in comparison to those derived from apparently normal individuals or patients with benign disease. Significantly, we also found that increased nuclear refractive index can be detected in cells derived from patients that were originally labeled as “normal” or “indeterminate” by expert pathologists but subsequently diagnosed as cancer patients, suggesting that SL-QPM is a superior diagnostic tool.12, 13 Since SL-QPM can be directly applied on the clinical histology and cytology specimens, it has the potential for clinical translation. We propose that the nuclear refractive index may represent a novel and innovative approach for early cancer detection as well as improved diagnostic accuracy and risk stratification. Here, we sought to identify potential biological mechanisms underlying our recent observation that the refractive index of the cell nucleus is significantly increased in not only malignant cells, but also histologically normal cells in clinical histology specimens derived from cancer patients. Since abnormalities in the cell cycle are considered to be one of the hallmarks of cancer, we determined the nuclear refractive index of fixed cells from synchronized populations of the well-characterized human cervical cancer HeLa cell line as they progressed through the cell cycle. We quantified the nuclear refractive index of fixed cells in synchronized G1/S-phase and G2/M-phase populations of cells. We synchronized HeLa cells in the G1/S-phase using a double thymidine (an inhibitor of DNA synthesis) block and in the G2/M-phase using nocodazole (a mitotic inhibitor).15 Specifically, HeLa cells were grown in Dulbecco's modified eagle medium supplemented with 10% fetal bovine serum (Mediatech, Inc.) and 1% penicillin-streptomycin in a 70% humidified incubator at 37 °C, 5% CO2. Cells were treated with 2 mM thymidine (Sigma) for 17 h, released from thymidine for 8 h, and then treated with 2 mM thymidine for an additional 15 h. This double thymidine block generated a synchronized population of G1/S-phase arrested cells. To generate G2/M-phase arrested cells, cells were released from a double thymidine block and then treated with 100 ng/ml nocodazole for 11 h. To determine the efficiency of the cell synchronization we used flow cytometry. HeLa cells were synchronized using the aforementioned protocols and then trypsinized and fixed in 70% ethanol. Cells were washed in phosphate buffered saline (PBS), permeabilized with 0.25% Triton X-100 in PBS, and stained with 6% propidium iodide (PI) for 15 min in the presence of RNase (100 μg/mL) in a sodium citrate buffer (40 mM) containing 0.1% Trition X-100 in PBS. Stained cells were then passed through the CyAN flow cytometer (Beckman Coulter Inc.). Since PI is a DNA intercalating dye, the fluorescence intensity is directly proportional to the DNA content in the nucleus. To mimic the conditions of clinical histology specimens, we made cell blocks from populations of synchronized cells. Briefly, cells were trypsinized and resuspended in Cytolyt® solution (Cytec) prior to centrifugation to generate cell pellets. HistoGel (Thermo Scientific) was added to each cell pellet and once the histogel embedded cell pellet solidified, 10% formalin was added to remove the cell block (gel button with specimen cells) from the container. Individual slides from each cell block were prepared following the standard tissue histology processing protocol with paraffin-embedding, sectioning at 4-μm thickness, mounting on a glass slide, paraffin removal, and hematoxylin and eosin staining. The stained specimen was covered with a coverslip. We acquired the data for approximately 150 to 160 cells from each sample using the SL-QPM system and extracted the nuclear refractive index using Fourier analysis, as described in detail in our previous publications.12, 13 The nuclear refractive index distribution resembles the histogram of fluorescence intensity from the flow cytometric analysis. Figure 1 shows the comparison of the nuclear refractive index and flow cytometry of cells synchronized at G1/S and G2/M phases. Flow cytometry is shown in Figs. 1a, 1b and nuclear refractive index is shown in Figs. 1c, 1d. Cells arrested at the G1/S phase have a 2N DNA content due to an inhibition of DNA synthesis while cells arrested at the G2/M phase have a 4N DNA content. HeLa cells arrested at the G2/M phase with 4N DNA content exhibit a significantly higher nuclear refractive index, as further confirmed by the statistical analysis (P < 1E-30) shown in Fig. 1e. Fig. 1(a) and (b) Flow cytometry and (c) and (d) the corresponding nuclear refractive index histogram of HeLa cells arrested at the G1/S and G2/M phases. (e) Statistical analysis of the refractive index from the cell nuclei. The nuclear refractive index from cells arrested at the G2/M phase (4N DNA content) shows a significant increase compared to those at the G1/S phase (2N DNA content) (P = 2.1E-31). Approximately 150 to 160 cells were analyzed for nuclear refractive index at each phase. 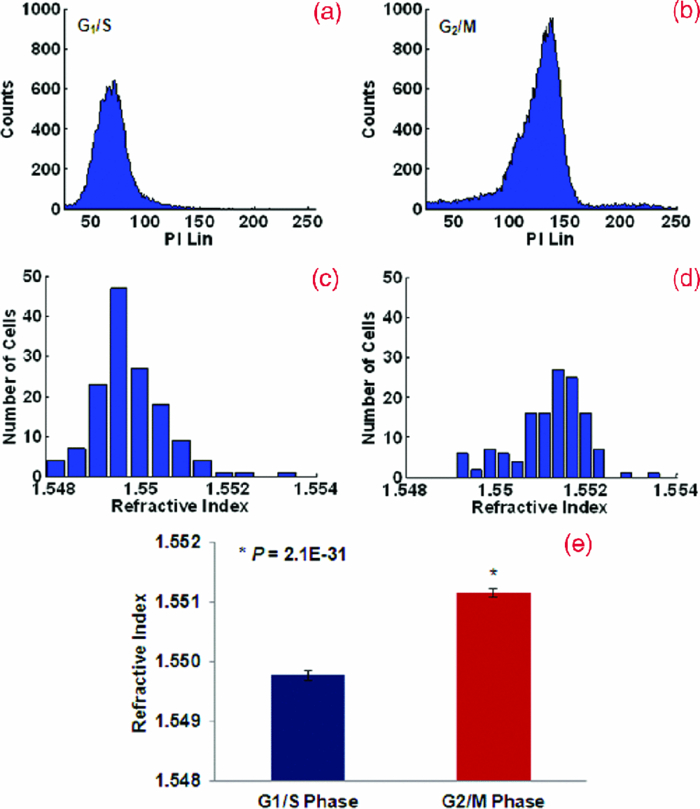 To further confirm the relationship between the nuclear refractive index and DNA content, we monitored the progression of nuclear refractive index as cells progressed through the cell cycle. Cells were arrested using a double thymidine block protocol and then released. Parallel cultures of cells were trypsinized and resuspended in Cytolyt® solution at different time points (4, 8, 10, and 15 h) following the second release from thymidine for cell block processing. We quantified the nuclear refractive index and DNA content at 4, 8 10, and 15 h following release from the second thymidine treatment (G1/S-phase arrest), as shown in Figs. 2 and 3. Again, there is a clear correlation between the nuclear refractive index and DNA content at different phases of the cell cycle. At four hours following the G1/S transition, approximately 50% cells have progressed into the S-phase, as indicated by the peak at 4N DNA content. This change is clearly reflected in the elevated average nuclear refractive index compared to that at G1/S (P = 0.001). At eight hours, only ∼25% cells have a 2N DNA content (G1/S-phase) and the majority of cells have a 4N DNA content (S-phase). The corresponding nuclear refractive index showed a further increase (P = 0.0001). At 10 h, more cells (∼44%) have a 2N DNA content as they complete the cell cycle and re-enter G1-phase. The corresponding nuclear refractive index showed a slight increase (P = 0.0003). At 15 h, when most cells (∼80%) have completed the mitosis, a more prominent peak at 2N DNA content and a further reduced nuclear refractive index was seen (P = 0.000005). At 15 h, the percentage of cells with 2N DNA content was similar to that of the cells originally arrested in the G1/S-phase, as is the nuclear refractive index (P = 0.4). These results confirm that the alteration in the average nuclear refractive index is correlated with DNA content. Fig. 2Flow cytometry of HeLa cells at 4, 8, 10, and 15 h following release from a double thymidine block (G1/S-phase arrest) to monitor progression through the cell cycle.  Fig. 3Statistical averages of (a) fluorescence intensity from PI and (b) nuclear refractive index at different time points during the cell cycle.  Our results suggest a strong correlation between the nuclear refractive index and alterations in DNA contents through the cell cycle. The changes in refractive index alteration have been shown to be proportional to macromolecular concentration or mass density based on a well-established linear dependence: n = n 0 + αC, where C represents the mass density and the proportionality coefficient α (specific refraction increment) can be approximated as 0.185 ml/grams for most biological molecules, such as nucleic acid and protein.4, 5 Therefore, the nuclear refractive index may be a sensitive measure of nuclear mass density or concentration caused by the alterations in DNA content during the cell cycle. For example, when the DNA content doubles from the G1/S to G2/M phase, the average refractive index of the cell nucleus increases by 0.0014, corresponding to a nuclear mass density change of approximately 7.6 femtograms/μm3. Since cancer is characterized as uncontrolled cell growth that is often associated with higher DNA content, the increased DNA content may be one of the mechanisms responsible for the increased nuclear refractive index observed in both malignant cells and histologically normal cells derived from cancer patients. In conclusion, we show that the nuclear refractive index of fixed cells correlates with DNA content through the cell cycle. Thus, the characterization of the nuclear refractive index could be developed as a novel methodology to determine the cell cycle distribution in a population of cells. However, the nuclear refractive index should not be considered to be a DNA specific biomarker. It could, in principle, detect cumulative nuclear density changes arising from any macromolecules (e.g., DNA, RNA, protein). Most significantly, our findings further suggest that the nuclear refractive index may be a novel physical parameter for early cancer detection as well as improving diagnostic accuracy and risk stratification. AcknowledgmentsThis work was funded by research Grants Nos. R21CA138370 and R21CA15293 from the National Institute of Health and University of Pittsburgh Medical Center. ReferencesR. J. Cho, M. Huang, M. J. Campbell, H. Dong, L. Steinmetz, L. Sapinoso, G. Hampton, S. J. Elledge, R. W. Davis, and
D. J. Lockhart,
“Transcriptional regulation and function during the human cell cycle,”
Nat. Genet., 27 48
–54
(2001). https://doi.org/10.1038/83751 Google Scholar
M. A. Shah and
G. K. Schwartz,
“Cell cycle-mediated drug resistance: an emerging concept in cancer therapy,”
Clin. Cancer Res., 7 2168
–2181
(2001). Google Scholar
J. S. Ross, G. P. Linette, J. Stec, M. S. Ross, S. Anwar, and
A. Boguniewicz,
“DNA ploidy and cell cycle analysis in breast cancer,”
Am. J. Clin. Pathol., 120 S72
–S84
(2003). https://doi.org/10.1309/QD096UGF70T5H46G Google Scholar
R. Barer,
“Intereference microscopy and mass determination,”
Nature, 169 366
–367
(1952). https://doi.org/10.1038/169366b0 Google Scholar
R. Barer,
“Refractometry and interferometry of living cells,”
J. Opt. Soc. Am., 47 545
–556
(1957). https://doi.org/10.1364/JOSA.47.000545 Google Scholar
C. L. Curl, C. J. Bellair, T. Harris, B. E. Allman, P. J. Harris, A. G. Stewart, A. Roberts, K. A. Nugent, and
L. M. Delbridge,
“Refractive index measurement in viable cells using quantitative phase-amplitude microscopy and confocal microscopy,”
Cytometry, Part A, 65 88
–92
(2005). https://doi.org/10.1002/cyto.a.20134 Google Scholar
H. Lee, V. Richards, and
C. Klausner,
“Dry mass and cell area changes in Ehrlich mouse ascites carcinoma cells after complement-fixation reaction measured by interference microscopy,”
Cancer Res., 20 1415
–1421
(1960). Google Scholar
G. Popescu, Y. Park, N. Lue, C. Best-Popescu, L. Deflores, R. R. Dasari, M. S. Feld, and
K. Badizadegan,
“Optical imaging of cell mass and growth dynamics,”
Am. J. Physiol. Cell Physiol., 295 C538
–C544
(2008). https://doi.org/10.1152/ajpcell.00121.2008 Google Scholar
H. Fang, L. Qiu, E. Vitkin, M. M. Zaman, C. Andersson, S. Salahuddin, L. M. Kimerer, P. B. Cipolloni, M. D. Modell, B. S. Turner, S. E. Keates, I. Bigio, I. Itzkan, S. D. Freedman, R. Bansil, E. B. Hanlon, and
L. T. Perelman,
“Confocal light absorption and scattering spectroscopic microscopy,”
Appl. Opt., 46 1760
–1769
(2007). https://doi.org/10.1364/AO.46.001760 Google Scholar
I. Itzkan, L. Qiu, H. Fang, M. M. Zaman, E. Vitkin, L. C. Ghiran, S. Salahuddin, M. Modell, C. Andersson, L. M. Kimerer, P. B. Cipolloni, K. H. Lim, S. D. Freedman, I. Bigio, B. P. Sachs, E. B. Hanlon, and
L. T. Perelman,
“Confocal light absorption and scattering spectroscopic microscopy monitors organelles in live cells with no exogenous labels,”
Proc. Natl. Acad. Sci. U.S.A., 104 17255
–17260
(2007). https://doi.org/10.1073/pnas.0708669104 Google Scholar
L. T. Perelman, V. Backman, M. Wallace, G. Zonios, R. Manoharan, A. Nusrat, S. Shields, M. Seiler, C. Lima, T. Hamano, I. Itzkan, J. Van Dam, J. M. Crawford, and
M. S. Feld,
“Observation of periodic fine structure in reflectance from biological tissue: a new technique for measuring nuclear size distribution,”
Phys. Rev. Lett., 80 627
–630
(1998). https://doi.org/10.1103/PhysRevLett.80.627 Google Scholar
P. Wang, R. Bista, R. Bhargava, R. E. Brand, and
Y. Liu,
“Spatial-domain low-coherence quantitative phase microscopy for cancer diagnosis,”
Opt. Lett., 35 2840
–2842
(2010). https://doi.org/10.1364/OL.35.002840 Google Scholar
P. Wang, R. Bista, W. E. Khalbuss, W. Qiu, K. Staton, L. Zhang, T. A. Brentnall, R. E. Brand, and
Y. Liu,
“Nanoscale nuclear architecture for cancer diagnosis beyond pathology via spatial-domain low-coherence quantitative phase microscopy,”
J. Biomed. Opt., 15 066028
(2010). https://doi.org/10.1117/1.3523618 Google Scholar
P. Wang, R. K. Bista, W. Qiu, W. E. Khalbuss, L. Zhang, R. E. Brand, and
Y. Liu,
“An insight into statistical refractive index properties of cell internal structure via low-coherence statistical amplitude microscopy,”
Opt. Express, 18 21950
–21958
(2010). https://doi.org/10.1364/OE.18.021950 Google Scholar
J. V. Harper,
“Synchronization of cell population in G1/S and G2/M phases of the cell cycle,”
Methods Mol. Biol., 296 157
–166
(2005). https://doi.org/10.1385/1-59259-857-9:157 Google Scholar
|


