
|
|
1.IntroductionSince the early 1990s, a great deal of research has been focused on the introduction of new methods for detection of dental caries, especially in the early stages of progression. The significance of early caries detection lies in the fact that if dental caries are detected early enough, preventive action, such as fluoride therapy, can be used to arrest the lesion or even remineralize the demineralized area.1 In fact, the National Institutes of Health consensus statement published in 20032 has identified the development of reliable methods for detecting early carious lesions as one of the major areas in which more research is needed. Out of the methodologies suggested thus far, optical methods have shown great potential for caries detection. This is mostly due to the intrinsic contrast associated with these methods. Light is generally more scattered and absorbed within carious regions, thereby producing contrast between intact and demineralized regions. Perhaps, the earliest optical method used in dental diagnostics is the fiber-optic transillumination (FOTI) method which uses high intensity white light for detecting caries.3 However, due to the significant scattering of light in the visible spectrum, inconsistent results have been reported, mainly suggesting low sensitivity of the method.3 Light-to-fluorescence conversion methods are intrinsically more sensitive to the presence of dental caries than direct optical methods because they feature low background signals and enhanced dynamic range. Quantitative light-induced fluorescence (QLF) is one such method that is based on the decrease in fluorescence transmission due to increased scattering from demineralized spots. Fluorescence is caused by the excitation of fluorophores contained within the enamel-dentine junction using visible light. QLF is an imaging modality capable of detecting early carious lesions;4 however, the need for extensive operator training, detecting approximal caries, and the masking effects of surface stains are major challenges for this technique. DIAGNODent (DD) is another caries detection device based on fluorescence that uses red-light illumination to excite the bacterial porphyrins found in dental caries.5 The major downside of DD is the fact that it measures bacterial activity rather than structural changes in enamel. Moreover, DD is not an imaging device and cannot reliably detect enamel caries.6 Recently, promising results have been reported for detection of caries through near-infrared (NIR) transmission/reflectance methods. The method works on the same basis as FOTI but uses NIR light instead of visible light, resulting in a deeper penetration depth because the scattering and absorption in enamel is significantly reduced in the NIR region. Featherstone and Fried7 have repeatedly reported on the enhanced penetration depth of NIR radiation in teeth as well as the insensitivity of NIR radiation to surface stains and noncalcified plaque.8 In the recent work of Zakian,9 differential NIR reflectance has been used to quantify lesion severity. Although the extent of literature on NIR imaging is limited, it appears that NIR light is uniquely suited for dental inspection. Thermal infrared (Planck) radiation from teeth can also be used to detect carious lesions. This form of detection belongs to the group of energy conversion methodologies with reduced signal baseline and enhanced dynamic range advantages akin to fluorescence. Kaneko 10 were the first to use passive infrared thermography to correlate the changes in enamel temperature to mineral loss and lesion depth. However, the methodology has major limitations because the variations in the temperature of the mouth can influence the temperature readings. In a later work,11 an active thermography method with pulse heating was used to overcome this problem, but the results were still not promising because visible light was used as the excitation source (highly scattering) and the carious lesions examined could clearly be detected even using visual inspection (low sensitivity). However, based on an analysis of the temperature decay after pulse heating, a methodology was proposed to quantify the degree of mineral loss. Perhaps, the most relevant thermographic study to this paper is the work carried out by John and Salerno12 and John 13 They examined the ground section of a resin-embedded extracted human tooth using modulated optical excitation and lock-in thermography. However, due to their nonoptimal choice of optical excitation (highly scattering visible light) and use of very low-modulation frequencies (0.06–0.23 Hz), they only managed to estimate the relative thermal thicknesses of several structures and no diagnostic study was carried out. Mandelis 14 first applied frequency-domain photothermal radiometry (PTR) toward the detection of dental caries. Important features of PTR are the effective measurement depth, which can be controlled by the laser excitation modulation frequency as well as the strongly suppressed signal baseline due to the modulated nature of the optical-to-thermal energy conversion. The later works of this group15, 16, 17, 18, 19 have shown a strong correlation between changes in the PTR amplitude and phase values and the extent of mineral loss. The purpose of this study is to combine the deep penetration advantages of NIR excitation and the highly controlled detection depth and high contrast of PTR and active thermography to introduce a new photothermal imaging modality for early detection of caries in teeth. 2.Thermophotonic Lock-In Imaging InstrumentationFigures 1a and 1b show the experimental setup and the signal-processing algorithm used in this study, respectively. The laser source is a continuous-wave fiber-coupled 808-nm NIR laser diode (JENOPTIK, Jena, Germany) with two integrated thermoelectric coolers. An appropriate laser driver (Thorlabs, Newton, NJ, model LDC 3065) and a thermoelectric controller (Coherent, Santa Clara, CA, model 6060) are used to maintain an average optical intensity of 2.04 W/cm2 on the tooth surface. Although such optical intensity may seem to be above the permissible clinical threshold, reflection at enamel surface and the poor absorption of NIR light by both water and enamel significantly reduce the effective power deposited on the tooth. As a result, this optical power density was found to increase the tooth-pulp chamber temperature no more than 5°C. Such a temperature increase is known to be the threshold for pain perception. However, one can always reduce the optical intensity at the cost of longer lock-in integration time (i.e., more averaging) to overcome this issue. The distance between the laser-power–delivering optical fiber and the sample is adjusted to get a 25-mm-diam beam size on the interrogated surface of a tooth. Considering the size of human tooth (∼1×1.5 cm2), this beam size is more than enough to illuminate the entire tooth surface. Fig. 1(a) Schematic diagram of experimental setup. (b) Signal processing algorithm. PTR (c) amplitude and (d) phase frequency scan obtained at the center of the treatment window of sample A1 at several stages of controlled demineralization (integration time 3 ms). Insets: demineralization times (days, D). 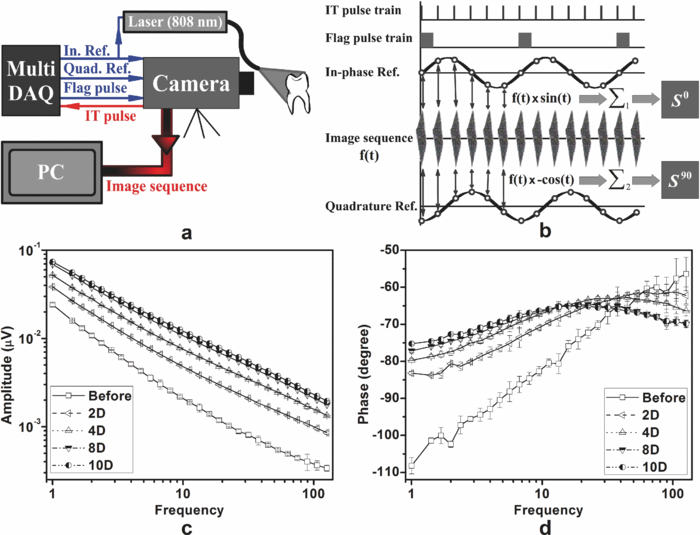 In our experimental setup, the LEGO-mounted sample is placed on a rotation stage (precision 0.5 deg) mounted on a three-axis XYZ translation stage (precision 10 μm). Using these four degrees of freedom, the position of the sample with respect to the camera is adjusted to yield a focused (sharp) image of the interrogated surface on the analog video output of the camera and the XYZ and angular coordinates of the sample are recorded to ensure the identical repositioning of the sample during repeated measurements. Our camera (Cedip Infrared Systems, Croissy-Beaubourg, France, model Titanium 520 M) is a state-of-the-art focal-plane array (FPA) infrared camera with a spectral range of 3.6–5.1 μm and maximum frame rate of 175 Hz at full frame. The camera's detector array consists of 320×256 Indium Antimonide (InSb) elements with element size of 30×30 μm2. Using a custom-made extension tube and a 50-mm-focal-length objective lens (Cedip Infrared Systems, Croissy-Beaubourg, France, model MW50 L0106), magnification of one is obtained from the interrogated surface of the tooth sample. The camera generates an integration-time pulse train output at the frame-rate frequency. The duration of each pulse in this pulse train is equal to the FPA integration time (1 ms). Our multidata acquisition board (National Instruments, Austin, TX, model NI-6229 BNC) receives this pulse train and synchronously generates three analog outputs: flag pulse train, in-phase reference signal, and quadrature reference signal, and sends them to the camera as its external trigger, lock-in signal I, and lock-in signal II inputs, respectively. The purpose of having a flag pulse train is to be able to detect the beginning of each modulation cycle for averaging purposes. The frequency of the reference signals (in-phase and quadrature) is set to the modulation frequency, and the in-phase signal leads the quadrature signal by 90 deg. The in-phase reference signal is used to modulate the intensity of the laser beam. The modulated laser beam then illuminates the tooth sample through the optical fiber. The camera frame headers contain the flag pulse train status (high or low) and the reference signal values (between −1 and 1) at the instance that the frame was captured [Fig. 1b]. Our data acquisition/signal-processing program (designed in the LabView environment) captures an image sequence at the highest frame rate of the camera that corresponds to two modulation cycles. Then, it extracts the header information from the image sequence, finds the beginning of a modulation cycle using the flag pulse train information available in the image header, and exports to a buffer the image sequence and the reference signal values of one complete modulation cycle (starting from a zero phase value). Depending on the signal-to-noise ratio (SNR) of the signal obtained from the sample, the above steps are then repeated numerous times (usually between 700 and 2000 times) and the image sequence and its reference signal values are averaged in the buffer to suppress the stochastic noise. Finally, the averaged image sequence is weighted by the two reference signals [i.e., each frame is a 2-D matrix of integer numbers and is multiplied by its corresponding reference signal values, Fig. 1b], and then the weighted frames are summed to obtain the noise reduced in-phase (S 0) and quadrature (S 90) images. The amplitude and phase images are then calculated from Eq. 1 applied to each pixel, Eq. 1[TeX:] \documentclass[12pt]{minimal}\begin{document}\begin{equation} A = \sqrt {\left({S^0 } \right)^2 + \left({S^{90} } \right)^2 } \quad {\rm and}\quad \Phi = \arctan \,\left({S^{90} /S^0 } \right). \end{equation}\end{document}Our experimental setup is similar to those used in conventional lock-in thermography;20, 21 however, an important challenge for the case of dental diagnostic applications is the fact that dental enamel is translucent and does not strongly absorb the illuminating optical radiation. Therefore, the photothermal signals obtained by the camera are generally poor in terms of signal-to-noise ratio and this makes signal averaging an inevitable part of the signal-processing algorithm. The other significant complication of dental samples is that, due to their turbid nature, the emitted thermal infrared radiation is physically governed by strongly coupled diffused-photon-density and thermal-wave processes as opposed to conventional thermal-wave-generated lock-in thermography. Consequently, this new imaging method is referred to as thermophotonic lock-in imaging. 3.Materials and MethodsThree extracted human molars were used in this study, labeled samples A1, A2, and A3. Sample A1 had relatively healthy surfaces with no visible stains [Fig. 2a] and therefore was chosen to study the progression of controlled demineralization with time. However, samples A2 and A3 [Figs. 3a and 4a, respectively] had stained fissures suspected to be caries and were used in their natural state to evaluate the potential of our thermophotonic lock-in imaging (TPLI) system to handle carious teeth as encountered in clinical practice. Samples were carefully cleaned, mounted on LEGO blocks [15.8 mm (W)×15.8 mm (D)×9.5 mm (H)] and stored in an air-tight humid container before measurements. Inside the humid box, a small rectangular dish was placed with distilled water to keep the ambient humidity constant. Mounting the teeth on LEGO blocks allowed their remounting into the same position in the experimental setup during repeated measurements. The surfaces of the samples were neither polished nor altered in any way prior to the experiments. Fig. 4Sample A3: (a) Occlusal and (b) approximal optical images, TPLI (c) amplitude and (d) phase images obtained at 10 Hz, TPLI (e) amplitude and (f) phase images obtained at 100 Hz, and (g) TMR profile along the depth of the approximal natural caries.  3.1.Controlled DemineralizationIn order to apply controlled demineralization to sample A1, a demineralizing solution was prepared. The solution was an acidified gel, consisting of 0.1 M lactic acid gelled to a thick consistency with 6% w/v hydroxyethylcellulose and the pH adjusted to 4.5 with 0.1 M NaOH. Demineralization with acidified gel approximates the natural lesion because it mimics the properties of actual dental plaques in the oral cavity.22 Our previous studies show that this solution can produce a subsurface lesion in enamel with a sound surface layer.19, 23 Because our goal was to see the contrast between demineralized and healthy areas in a whole tooth, a treatment protocol was followed in which the interrogated surface of sample A1 was covered with two coatings of commercial transparent nail polish, except for a rectangular window of size 1.2 mm (W)×4 mm (H), henceforth referred to as the treatment window. The demineralization on the window was carried out by submerging the sample upside down in a polypropylene test tube containing 30 ml of demineralizing solution. After the treatment period, the sample was removed from the gel, rinsed under running tap water for ∼1 min, and dried in air for 5 min. Then, the transparent nail polish was removed from the interrogated surface with acetone and the sample was again rinsed, dried, and stored in the air-tight humid box for at least 24 h before TPLI. After the imaging, the sample was again covered with the transparent nail polish (except for the treatment window) and demineralized for additional days in order to investigate the progression of demineralization with time. The treatment window of sample A1 was demineralized for up to 10 days, and imaging was carried out on the sample at several lock-in modulation frequencies before the treatment as well as after 2, 4, 8, and 10 days of treatment. 3.2.Image ProcessingAt a given laser modulation frequency, the end products of the TPLI method are amplitude and phase images. Each image can independently be used to detect defects and inhomogeneities in a tooth at any given time (such as the study performed on samples A2 and A3). However, for carrying out a time-dependent study in vitro, such as the one carried out on sample A1, or a clinical follow-up on a suspicious dental lesion, arrangements should be made to ensure that the sequence of images taken at different times is self-consistent. It can be shown20 that thermographic phase images are intrinsically emissivity normalized, which makes them insensitive to small day-to-day changes in the power of the optical excitation source (e.g., laser). As a result, phase imaging dominates the thermography literature. However, for the case of dental imaging, as a result of exposure to the oral cavity environment, the optical and thermal properties of teeth change slightly over time, even at intact areas. Thus, in order to make a series of phase images taken at different times comparable, we introduced a normalization method: we can find a relatively healthy area in the tooth [dashed reference area in Fig. 2c], compute the average phase value of the pixels inside this healthy patch, and subtract the phase value of all the pixels in the same image from that of the healthy patch. This normalization can be done for each phase image of a sequence independently using the same location for the healthy patch. In other words, for a follow-up study we compare phase contrast images (relative imaging) rather than the raw phase images (absolute imaging). This normalization is the only modification made on the raw phase images of Fig. 2. All the thermophotonic lock-in images of Figs. 3 and 4 are raw images, because no follow-up study was carried out on samples A2 and A3. Fig. 2(a) Optical image and (b) front (F) and side (S) x-ray radiographs of sample A1 before treatment. (c) Front (F) and side (S) x-ray radiographs and (d) optical image of sample A1 after 10 days of mineral loss within the treatment window. TPLI phase images of sample A1 (e) before treatment and after (f) 2, (g) 4, (h) 8, and (i) 10 days of demineralization within the treatment window. (j) Phase profiles along the dashed line shown in Fig. 2i for samples at several demineralization stages. The dashed vertical lines show the location of the treatment window. (k) TMR mineral profile along the center of the treatment window of the 10-day demineralized sample.  Fig. 3(a) Optical image of sample A2. Thermophotonic (b) amplitude and (c) phase images of sample A2 obtained at 10 Hz. Thermophotonic (d) amplitude and (e) phase images of sample A2 obtained at 100 Hz. (f)–(i) TMR mineral profiles of points f–i, respectively, indicated in Fig. 3e.  3.3.Photothermal Radiometry MeasurementsThermophotonic lock-in imaging is basically a two-dimensional extension of dental PTR14, 16, 17, 18, 19 with an infrared camera (a 256×320 array of detectors) substituted for a single infrared detector. A single detector (PTR) experiment was also carried out with the A1 sample to investigate the consistency of the results with previous findings. The experimental setup and methodology of the PTR method are described elsewhere.16 A 100-mW, 830-nm laser beam with spot size of 325.9 ± 25.5 μm was used to generate the photothermal signal. The intensity of the laser beam was current modulated in the 1–120 Hz frequency range, and the infrared radiation from the sample was measured using a mercury cadmium telluride detector. Subsequently, using a signal-processing algorithm similar to that used with the new TPLI, the amplitude and phase of the photothermal signal emitted from various points on the tooth surface were calculated at each modulation frequency. 3.4.Transverse MicroradiographyTransverse microradiography (TMR) was used as the gold standard to verify the capabilities of the demineralization and caries imaging system. Tooth slices, ∼100 μm thick, were prepared from several regions of interest on samples using a water-cooled diamond-coated wire saw (Well, Le Locle, Switzerland, model 3242). Both the sample slices and a standard aluminum step wedge (10 steps of 24.5 μm high) were microradiographed on type 1A high-resolution glass x-ray plates (IMTECH, Rochester, NY) with a Phillips x-ray device using a nickel-filtered Cu-Kα target. This system generates a monochromatic x-ray radiation of 184 Å suitable for hydroxyapatite radiography. The plates were exposed for 10 min at 20 kV/10 mA prior to processing. Processing consisted of 5 min in a developer (Kodak HR, Rochester, NY) and 15 min in a rapid-fixer (Kodak, Rochester, NY) before a final 30-min wash period. After drying, the microradiographs were visualized using an optical microscope (Leica Microsystems GmbH, Wetzlar, Germany, model Leica DMR) linked via a closed-circuit television camera (Sony, New York, NY, model XC-75CE) to a computer. The enhanced image of the microradiograph was analyzed under standard conditions of light intensity and magnification, then processed, along with data from the image of the step wedge, using the TMR software (Inspektor Research Inc., Amsterdam, The Netherlands, model TMRW v2.0.27.2) to quantify the lesion parameters of integrated mineral loss (Δz, vol. % μm) and lesion depth [(LD), measured in micrometers]. The mineral loss was computed as the difference in volume percent of mineral between sound and demineralized tissue integrated over the LD. The LD was assessed as the distance from the measured sound enamel surface to the location in the lesion at which the mineral content was >95% of the mineral content in sound enamel. 3.5.Radiographic ExaminationUsing standard dental x-ray equipment, radiographs were taken from sample A1 before and after 10 days of treatment. The tooth was mounted on a jig that fixed the distance between film, tooth, and x-ray tube head, and radiography was carried out on both the proximal and buccal sides. 4.Results and DiscussionEnamel is an optically turbid medium; therefore, when light enters the tooth it scatters and gets absorbed along its path. Optical extinction depth is defined as the effective depth within which the light can get absorbed and generate heat, including both absorption and scattering effects. Interpolating the enamel extinction coefficient from the IR spectrum of dental enamel reported by Jones and Fried,24 the optical extinction depth is ∼250 μm for the light wavelength used in our study. However, because photon-absorption events are responsible for generating thermal signals, it is the optical absorption depth (∼1 cm) that is the controlling factor.17 When modulated optical excitation is absorbed inside the tooth, the subsequent heat generation gives two contributions to the infrared camera signal. First, an oscillatory heat distribution (thermal wave) is formed at or near the surface within a thermal diffusion length (at the frequency of the absorbed optical excitation) that will conductively reach the surface of the tooth and contribute to the camera signal in the form of a depth integral through infrared emission. Second, direct thermal infrared (Planck) emission occurs from all absorption locations (surface and subsurface) with IR photon backpropagation through the enamel due to the 15–20% transmittance of enamel in the midinfrared region.25 Considering the speed of light and the thickness of enamel, the latter contribution is instantaneous and, therefore, there will be no phase shift between the direct infrared (Planck) emission responses received from different depths in the tooth. Consequently, there will be no contrast contribution from this type of direct emission in the TPLI phase image; however, direct emission will contribute to the amplitude image contrast because these images are concerned with the amplitude of infrared emission (number of IR photons) received at a specific modulation frequency, a function of the local absorption coefficient and optical-to-thermal energy conversion efficiency.17 On the other hand, the thermal-wave contribution to the infrared camera signal is not instantaneous as speed of propagation of heat is significantly smaller than that of light. Thus, absorption at different depths will result in different phase values at a fixed modulation frequency. Unlike pure thermal waves generated in opaque media, optically nonsaturated photothermal waves carry optical as well as thermal information. The most important feature of thermal waves is that their effective penetration depth can be controlled through the modulation frequency, Eq. 2[TeX:] \documentclass[12pt]{minimal}\begin{document}\begin{equation} \mu _{{\mathop{\rm th}\nolimits} } (f) = \sqrt {{\alpha / {\pi f}}} \end{equation}\end{document}4.1.Photothermal Radiometry MeasurementsPTR frequency scans using a focused laser beam allow physical insights into the signal generation process not directly available through thermophotonic images. Preferential absorption of incident light at carious and demineralized regions is the intrinsic source of contrast in photothermal dental techniques and directly linked to the mineral content of the enamel. Figure 1c shows the PTR amplitude frequency scans of a spot at the center of the treatment window of sample A1. It can be seen that, at any given treatment time, the photothermal amplitude decreases as the laser modulation frequency increases, a typical dental photothermal response.14 Furthermore, at any given modulation frequency the photothermal amplitude monotonically increases with the progression of enamel demineralization caused by the acidified treatment gel. This is due to the fact that demineralization decreases the mineral density of enamel, thereby making it more porous and degrading the thermophysical properties of enamel while enhancing light scattering and absorption.19 In general, the higher the optical scattering in a dental region is, the higher the probability of light absorption in the region will be. Therefore, both the direct and thermal-wave-generated emissions yield greater contributions in the porous/carious regions than those generated at intact enamel, increasing the photothermal amplitude.16, 17, 18 The PTR phase frequency scans of the same spot at several treatment times are plotted in Fig. 1d. The dominant feature of this plot is the appearance of a maximum point in the curves of the treated (demineralized) cases. The postdemineralization maximum has also been observed in previous PTR studies19 and can be linked to the formation of a demineralized surface layer that supports standing thermal waves. Moreover, as treatment time increases, the phase maximum shifts toward lower frequencies as a result of a thicker surface layer, supporting standing waves of increased thermal wavelength (λth = 2π μth) and decreased frequency.19 As a result of these maxima, it can be seen that the trends between intact and demineralized enamel are reversed by increasing the modulation frequency from 1 to 120 Hz. Unlike the phases of the treated samples, the phase of the intact enamel is a monotonically increasing function of modulation frequency. Trapping of light in demineralized regions of poorer optical and thermal properties than intact enamel confines its penetration and shifts the subsequently generated photothermal temperature distribution closer to the surface compared to that of a healthy region. These confinement effects result in a PTR phase lead at carious spots at a given modulation frequency.17 Generally, the size of the phase channel error bars decreases as demineralization proceeds because demineralization increases the PTR signal amplitude [Fig. 1c] and improves the signal-to-noise ratio. The results of Figs. 1c and 1d suggest that both amplitude and phase channels can be used to detect demineralization in teeth and monitor lesion evolution. 4.2.Thermophotonic Lock-In ImagesFigure 2a shows an optical image of sample A1 before application of demineralization in the treatment window. The dashed rectangle in Fig. 2a shows the area that was imaged using our TPLI system, whereas the solid rectangle depicts the location of the treatment window. The optical image shows traces of a discontinuity on the surface of enamel (feature 1). The two vertical lines on the root area show the approximate lateral position of the treatment window (solid rectangle). These lines were meant to aid the operator with sample alignment and are of no scientific importance. Figure 2b shows the x-ray radiograph of the untreated sample (“before”) at the same front view as the optical image as well as the side view, indicated by the arrow in Fig. 2a. On the basis of these radiographs, sample A1 was a relatively healthy tooth before application of artificial treatment and it is interesting to see that the discontinuity on the enamel surface (feature 1) could not be resolved in either of the x-ray radiographs. Figures 2c and 2d are the x-ray radiographs and the optical image taken from sample A1 after 10 days of treatment, respectively. None of these images can show even a trace of mineral loss in the treatment window, showing the insensitivity of conventional clinical diagnostic methods to early demineralization. Figure 2e depicts the TPLI phase image of sample A1 taken at 10 Hz before application of any treatment. This image not only shows the enamel discontinuity observed in the optical image (feature 1) but also reveals the presence of a vertical crack (feature 2) and the cementoenamel junction [(CEJ), feature 3]. Neither the x-ray radiographs [Fig. 2b] nor the optical image [Fig. 2a], could resolve this vertical crack (feature 2). The reason of the high sensitivity of thermophotonic images to cracks is the fissured nature of cracks, which enhances the photothermal temperature field through thermal-wave flux localization generating high contrast. The appearance of the enamel discontinuity in the phase image [feature 1 in Fig. 2e] has similar physical origin to that of cracks. We postulate that feature 1 was caused by the excessive force applied during the tooth extraction. The effects of cracks and discontinuities on the photothermal phase were first reported in the focused-laser-based PTR experiments of Nicolaides 15 and later verified by Jeon 17 The appearance of a dark band in the phase images of Fig. 2 (feature 3) at the CEJ level suggests the presence of natural caries at this position. According to the dental literature,1 enamel of the cervical margin of the tooth is one of the locations that favors plaque formation and is therefore prone to demineralization. It can be seen that all the thermophotonic phase images of Fig. 2 can detect feature 3 with high sensitivity (contrast). In fact, one of the most important advantages of TPLI imaging compared to single-point PTR measurements is the significant improvement in the wealth of data resulting in excellent contrast and reliability of the results in real time and in direct comparison with conventional radiographs. Point-by-point measurements would require much longer time spans to produce surface images, which would be impractical in clinical applications. Figures 2f, 2g, 2h, 2i show the phase images taken at 2, 4, 8, and 10 days of treatment (mineral loss only within the treatment window), respectively. It should be noted that the same contrast mapping (linear, with identical thresholds) has been used in all TPLI images of Fig. 2 to ensure the validity of comparison between the images. It can be observed that as treatment time increases, the treated window becomes more apparent while the other features in the images remain more or less the same. The mean phase values within the treatment window [empty rectangle in Fig. 1e] for the untreated, 2-, 4-, 8-, and 10-day-treated samples are found to be −7.47, −25.22, −31.75, −42.07, and −49.66 deg, respectively. This monotonic decrease in the phase lag is due to the progression of the lesion into the enamel. As the lesion thickness increases, the thermal-wave centroid shifts closer to the surface, thereby decreasing the phase lag between the applied optical excitation and the received infrared response. The phase lag decreases also with respect to the intact state (“before”). Feature 4 in Fig. 2f is most probably a material inhomogeneity formed as a result of incomplete removal of nail polish from the enamel surface after the second day of demineralization. The feature disappeared after the next demineralization cycle. It appears that feature 5 is stress-induced cracks that were formed during tooth extraction. The cracks become more apparent toward the later stages of demineralization [Figs 2e, 2f, 2g, 2h, 2i] due to successive nail polish penetration into them. It has been known that nail polish can penetrate tens of micrometers into dental enamel.27 Figure 2j is a plot of transverse profiles of the phase images along the dashed line shown in Fig. 2i. The dashed vertical lines represent the location of the treatment window (centered at 6.27 mm). It can be seen that as demineralization progresses, the absolute thermophotonic phase values increase within the treatment window but remain approximately the same outside the treatment window. Furthermore, examination of these phase profiles reveals that the demineralization has not only propagated vertically into the enamel but has also spread out laterally. However, the extent of demineralization is always maximal within the treatment window and decreases rapidly, laterally away from the treatment window. The two dips in the phase values at ∼3.9 and ∼8.8 mm lateral positions are related to the vertical defects at those locations (features 2 and 1, respectively). Figure 2k represents the TMR mineral profile vertically along the center of the treatment window. Mean lesion depth of 326.4 μm and mineral loss of 5710 vol. % μm was reported by the TMR software for the lesion produced at the center of the treatment window. It can be seen that the lesion retains a relatively well-preserved surface layer with a moderate mineral loss over a large depth. It is somewhat surprising to find such a deep lesion formed after only 10 days of demineralization, but it is a well known fact that the rate of demineralization can vary greatly among teeth.23 Figure 3 presents the results obtained from sample A2. Unlike sample A1, the occlusal surface was investigated for this sample. Figure 3b shows the TPLI amplitude image taken at 10 Hz. The amplitude image shows the presence of caries at several locations, but the image is rather diffuse. Using this image, four regions of interest (points i, f, g, and h) were identified within the imaged area of the optical image [Fig. 3a]. The TPLI phase image taken at 10 Hz is shown in Fig. 3c. No feature can be resolved in the blurry phase image. The reason for such poor resolution is the relatively long, diffusion-limited thermal wavelength at 10 Hz. In fact, in these images the contributions from deeper features have resulted in interfering contributions superposed on features closer to the surface. Consequently, to avoid the interfering effects of deep features, we decided to reduce the thermal wavelength by generating the images at 100 Hz in order to be able to effectively detect the areas of mineral loss in the pits and fissures of the occlusal surface and the near-subsurface regions. The resolution improvement at higher frequencies is a well-known behavior of thermal waves and was also reported by Jeon 17 and is clearly visible in the amplitude and phase images obtained at 100 Hz [Figs 3d and 3e]. The pits labeled f, g, and h in Fig. 3e are shown as dark carious regions [similar to the treatment window of images in Figs. 2f, 2g, 2h, 2i] but groove i is shown as a healthy bright spot (similar to intact regions in the images in Figs. 2e, 2f, 2g, 2h, 2i]. The TMR profiles obtained at these points clearly show the presence of mineral losses at points f, g, and h while no significant mineral loss can be observed in the mineral profile obtained at point i. The TMR profiles fully validate the results of our non-contacting, nondestructive imaging method and underscore the importance of TPLI as a dynamic modality as opposed to dc IR imaging.10 Figures 4a and 4b depict the optical images of occlusal and approximal views of sample A3. Although the occlusal surface [interrogated surface, Fig. 4a] looks relatively healthy, the presence of caries is obvious on the approximal side [shown by arrow in Fig. 4b]. The inset in Fig. 4b shows that the center of the natural approximal caries (feature 7) is closer to the occlusal surface than the rest of the lesion (feature 6), which remains below lesion 7. The TPLI amplitude image taken from the occlusal surface at 10 Hz [Fig. 4c] not only detects the approximal caries but also shows the depth difference between features 6 and 7 through differences in contrast levels. The feature closer to the occlusal surface (feature 7) has higher contrast compared to the deeper feature 6. The fact that such deep features cannot be resolved in the TPLI phase image taken at 10 Hz [Fig. 4d] is in agreement with the earlier discussion on deeper detection capability of amplitude images through IR photon emission from heated subsurface regions. The depth profilometric capability of TPLI can be understood by comparing Figs. 4c and 4e. According to Eq. 2, increasing the modulation frequency from 10 to 100 Hz has decreased the thermal diffusion length. This, in return, has decreased the effective detection depth and has resulted in the near fading of the deeper feature (feature 6), while the closer feature 7 can be clearly resolved. However, because of the well-known inverse relationship between the modulation frequency and the photothermal signal amplitude,26 both features have less contrast at 100 Hz [Fig. 4e] compared to that at 10 Hz [Fig. 4c]. Therefore, generating TPLI images at various frequencies cannot only help to detect subsurface lesions with improved spatial resolution at increased frequency, but can also reveal depth information about the features. The TPLI phase image obtained at 100 Hz [Fig. 4f] yields more precise depth profilometric information when compared to the 10-Hz phase image [Fig. 4d]. Finally, Fig. 4g presents the TMR profile taken vertically along the depth of the natural approximal caries lesion shown by the arrow in Fig. 4b. The profile exhibits a classic profile of an enamel lesion with a well-preserved intact surface layer. In dental practice, proximal caries are the most challenging lesions to detect because they cannot be easily probed. One of the advantages of the experimental setup used in this study is that when examining the occlusal surface of the tooth, proximal surfaces can be probed just as well as the approximal surfaces. As a result, the study carried out on sample A3 suggests that TPLI has the potential to detect proximal caries when viewed photothermally from the accessible occlusal surface and underscores two outstanding features of TPLI imaging: subsurface detection and depth profilometry. In summary, we have introduced a novel dynamic dental imaging method for detection of enamel caries in its early stages of progression. Our experimental results show that midinfrared thermophotonic lock-in imaging at appropriate frequencies can detect very early demineralization lesions impossible to diagnose by dental radiographs or visible camera pictures. Furthermore, this methodology is capable of detecting occlusal pit and fissure caries as well as approximal caries. Our results suggest that by generating TPLI images at various modulation frequencies, one can estimate the relative depths of subsurface lesions in addition to their lateral location. Moreover, unlike radiography, TPLI uses safe nonionizing laser illumination. Our study shows that this new imaging modality is a promising candidate of superior contrast and sensitivity to carious lesions, very suitable for replacing, or at least supplementing, today's ubiquitous dental x-ray technology. Current work continues toward the enhancement of the depth profilometric character of TPLI. AcknowledgmentsWesincerely thank Dr. S. H. Abrams for providing the dental x-ray radiographs as well as A. Hellen for his useful comments and consultations. We are grateful to the Ontario Ministry of Research and Innovation for the 2007 (inaugural) Discovery Award in Science and Engineering to A.M., to the Canada Research Chairs Programs, the Federal and Provincial Governments for a CFI-ORF award, and the Natural Sciences and Engineering Research Council of Canada for several Discovery Grants to A.M. ReferencesO. Fejerskov and
E. Kidd, Dental Caries: The Disease and Its Clinical Management, 19
–42 2nd edBlackwell Munksgaard, Oxford (UK)
(2004). Google Scholar
National Institutes of Health Consensus Development Conference Statement,
“Diagnosis and management of dental caries throughout life,”
J. Dent. Educ., 65
(10), 1162
–1168
(2001). Google Scholar
J. D. Bader, D. A. Shugars, and
J. Bonito,
“A systematic review of the performance of methods for identifying carious lesions,”
J. Public Health Dent., 62
(4), 201
–213
(2002). https://doi.org/10.1111/j.1752-7325.2002.tb03446.x Google Scholar
C. Meller, C. Heyduck, S. Tranaeus, and
C. Splieth,
“A new in vivo method for measuring caries activity using quantitative light-induced fluorescence,”
Caries Res., 40
(2), 90
–96
(2006). https://doi.org/10.1159/000091053 Google Scholar
R. Hibst, R. Paulus, and
A. Lussi,
“Detection of occlusal caries by laser fluorescence: basic and clinical investigations,”
Med. Laser Appl., 16 205
–213
(2001). https://doi.org/10.1078/1615-1615-00024 Google Scholar
M. B. Diniz, J. A. Rodrigues, A. B. Paula, and
R. L. Cordeiro,
“In vivo evaluation of laser fluorescence performance using different cut-off limits for occlusal caries detection,”
Caries Res., 40
(2), 90
–96
(2006). Google Scholar
J. D. B. Featherstone and
D. Fried,
“Fundamental interactions of lasers with dental hard tissue,”
Med. Laser Appl., 16 181
–194
(2001). https://doi.org/10.1078/1615-1615-00022 Google Scholar
D. Fried, C. M. Buhler, P. Ngaotheppitak, and
C. L. Darling,
“Near-IR imaging of interproximal lesions from occlusal surfaces and the influence of stains and plaque,”
Proc SPIE, 6137 61370N
(2006). https://doi.org/10.1117/12.661801 Google Scholar
C. Zakian, L. Pretty, and
R. Ellwood,
“Near-infrared hyperspectral imaging of teeth for dental caries detection,”
J. Biomed. Opt., 14
(6), 064047
(2009). https://doi.org/10.1117/1.3275480 Google Scholar
K. Kaneko, K. Matsuyama, and
S. Nakashima,
“Quantification of early carious enamel lesions by using an infrared camera in vitro,”
83
–100
(1999). Google Scholar
T. Sakagami, S. Kubo, T. Naganuma, T. Inoue, K. Matsuyama, and
K. Kaneko,
“Development of a new diagnosis method for caries in human teeth based on thermal images under pulsed heating,”
Proc. SPIE, 4360 504
–510
(2001). https://doi.org/10.1117/12.421031 Google Scholar
C. John and
A. Salerno,
“Raw data set of thermal wave propagation in hard dental tissues,”
986
–1052
(1997). Google Scholar
C. John, D. Wu, A. Salerno, G. Busse, and
C. Lost,
“Applying phase sensitive modulated thermography to ground sections of a human tooth,”
Nondestructive Characterization of Materials VIII, Plenum, New York
(1998). Google Scholar
A. Mandelis, L. Nicolaides, C. Feng, and
S. H. Abrams,
“Novel dental depth profilometric imaging using simultaneous frequency domain infrared photothermal radiometry and laser luminescence,”
Proc. SPIE, 3916 130
–137
(2000). https://doi.org/10.1117/12.386313 Google Scholar
L. Nicolaides, A. Mandelis, and
S. H. Abrams,
“Novel dental dynamic depth profilometric imaging using simultaneous frequency-domain infrared photothermal radiometry and laser luminescence,”
J. Biomed. Opt., 5
(1), 31
–39
(2000). https://doi.org/10.1117/1.429965 Google Scholar
R. J. Jeon, C. Han, A. Mandelis, V. Sanchez, and
S. H. Abrams,
“Diagnosis of pit and fissure caries using frequency-domain infrared photothermal radiometry and modulated laser luminescence,”
Caries Res., 38 497
–513
(2004). https://doi.org/10.1159/000080579 Google Scholar
R. J. Jeon, A. Mandelis, V. Sanchez, and
S. H. Abrams,
“Nonintrusive, noncontacting frequency-domain photothermal radiometry and luminescence depth profilometry of carious and artificial subsurface lesions in human teeth,”
J. Biomed. Opt., 9
(4), 804
–819
(2004). https://doi.org/10.1117/1.1755234 Google Scholar
R. J. Jeon, A. Matvienko, A. Mandelis, B. T. Amaechi, and
G. Kulkarni,
“Detection of interproximal demineralized lesions on human teeth in vitro using frequency-domain infrared photothermal radiometry and modulated luminescence,”
J. Biomed. Opt., 12
(3), 034028
(2007). https://doi.org/10.1117/1.2750289 Google Scholar
R. J. Jeon, A. Hellen, A. Matvienko, A. Mandelis, S. H. Abrams, and
B. T. Amaechi,
“In vitro detection and quantification of enamel and root caries using infrared photothermal radiometry and modulated luminescence,”
J. Biomed. Opt., 13
(3), 034025
(2008). https://doi.org/10.1117/1.2942374 Google Scholar
G. Busse, D. Wu, and
W. Karpen,
“Thermal wave imaging with phase sensitive modulated thermography,”
J. Appl. Phys., 71
(8), 3962
–3965
(1992). https://doi.org/10.1063/1.351366 Google Scholar
O. Breitenstein and
M. LangenKamp, Lock-In Thermography: Basics and Use for Functional Diagnostics of Electronic Components, Springer, New York
(2003). Google Scholar
N. W. Johnson,
“Differences in the shape of human enamel crystallites after partial destruction by caries, EDTA and various acids,”
Archs. Oral Biol., 11 1421
–1424
(1966). https://doi.org/10.1016/0003-9969(66)90032-X Google Scholar
B. T. Amaechi, S. M. Higham, and
W. M. Edgar,
“Factors affecting the development of carious lesions in bovine teeth in vitro,”
Archs. Oral Biol., 43 619
–628
(1998). https://doi.org/10.1016/S0003-9969(98)00043-0 Google Scholar
R. Jones and
D. Fried,
“Attenuation of 1310-nm and 1550-nm laser light through sound dental enamel,”
Proc. SPIE, 4610 187
–190
(2002). https://doi.org/10.1117/12.469324 Google Scholar
L. Bachmann, R. Diebolder, R. Hibst, and
D. M. Zezell,
“Infrared absoption bands of enamel and dentin tissues from human and bovine teeth,”
Appl. Spectrosc. Rev., 38
(1), 1
–14
(2003). https://doi.org/10.1081/ASR-120017479 Google Scholar
A. Mandelis, Diffusion-Wave fields, Mathematical Methods, and Green Functions, Springer, New York
(2001). Google Scholar
Y. Iijima, O. Takagi, H. Duschner, J. Ruben, and
J. Arends,
“Influence of nail varnish on the remineralization of enamel single sections assessed by microradiography and confocal laser scanning microscopy,”
Caries Res., 32 393
–400
(1998). https://doi.org/10.1159/000016476 Google Scholar
|


