|
|
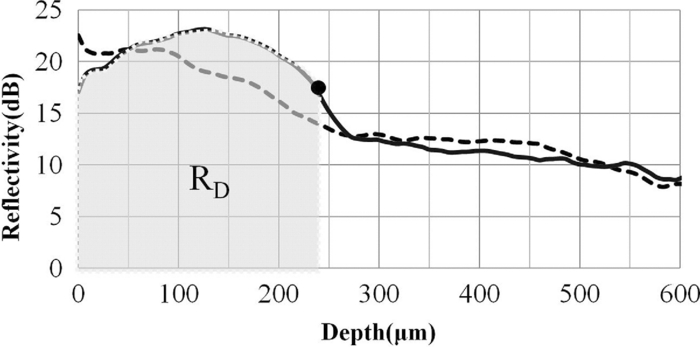
1.IntroductionDiagnosis and assessment of dentin lesions are important tasks in the routine dental practice, especially on the exposed root surfaces in advanced-age populations. Traditionally, the extent of root dentin lesions has been assessed by clinical inspection (color, surface morphology) and probing on the lesion surface.1 The International Caries Detection and Assessment System is a newly developed system for evaluating the lesion extent by clinical inspection.2 The system aims to improve the sensitivity to lesion development, and describes the criteria for root caries assessment. However, in general, the clinical inspection involves some risk of subjective and less objective assessment. Recently, alternative evaluation systems have been successfully introduced for measuring the extent of root dentin lesion. Researchers have evaluated the utility of DIAGNODentTM (Kavo, Biberach, Germany) and Electronic Caries Monitor (Vanguard System, Massachusetts Manufacturing Corporation, Cambridge, Massachusetts) as tools for quantification of root caries lesions.3, 4 However, these methods provide quantitative digital information on the lesions, but not lesion images. Quantitative light-induced fluorescence (QLF; Inspektor Research System, Amsterdam, Netherlands) has also been a frontier technology providing an image of demineralized enamel surface,5 by which one can measure the quantitative mineral loss; meanwhile, QLF does not provide cross-sectional lesion images and has a limited utility on dentin. Optical coherence tomography (OCT) is an emerging and promising tool for detection and assessment of demineralized enamel and dentin lesions. The technology can provide cross-sectional images from biological tissues without use of x ray irradiation in a short time.6, 7 From a clinical view point, OCT is expected to be a valuable tool for dentists and patients, sharing diagnostic information of the dental lesions and other conditions in operative and preventive treatments. Conventionally, OCT imaging systems were based on the principles of time-domain OCT (TD-OCT), where a mirror mechanically scans a distance at the reference arm to enable resolving of the depth information. More recently, the swept source OCT (SS-OCT) system has been developed as an implementation of spectral discrimination, in which the laser light source sweeps the near-IR wavelength at a high rate. SS-OCT time-encodes the wavelength; therefore, the mechanical scanning at the reference mirror has been eliminated and the images are obtained in a shorter time. Moreover, the signal-to-noise ratio (SNR) of spectral discrimination techniques is independent of the source coherence length, where TD-OCT forces an inverse relationship between axial resolution and SNR. It was reported that the sensitivity advantage was typically 2 to 3 orders of magnitude over conventional TD-OCT.8 Despite those advantages, typical SS-OCT systems face some challenges when compared to TD-OCT; for example, the complex conjugate ambiguity due to Fourier transform of real-valued data (mirror images) and a greater number of image artifacts with higher background noise.9 In addition, high-speed imaging by SS-OCT may impose lower bit-depth, e.g., 8-bit depth data acquisition.10 Nevertheless, various solutions have been addressed for each of these drawbacks and, therefore, it appears that the use of an optimized SS-OCT system as a clinical tool may be more feasible in terms of imaging resolution and speed.8, 10, 11, 12 In dental literature, there have been several reports on the use of OCT,6, 7, 13, 14, 15 especially for polarization-sensitive OCT (PS-OCT). It was reported that the PS-OCT was able to quantify the lesion depth and mineral loss in enamel and dentin lesions with the aid of special image analysis algorithms,6 in which the lesion depth and mineral loss were validated by transversal microradiography (TMR). Fried emphasized that the contrast of lesion images captured by PS-OCT was enhanced by depolarization of the incipient light by the lesion,6 and that high reflectivity at the tooth surface interfered with the measurement of early enamel demineralization beneath the surface.15 It was also indicated that the unfavorable strong reflections from the tooth surface were greatly reduced in the orthogonal polarization image, enabling better resolution of the surface zone of the lesion.16, 17 While a combination of PS-OCT with SS-OCT (PS-SS-OCT) would take advantage of both systems,7, 10 conventional SS-OCT may be still more affordable since PS-SS-OCT requires a more complicated design. There are only a few studies measuring demineralization of dental hard tissues by OCT without the use of polarization sensitivity.7, 13 Therefore, the aims of this study were to investigate whether the OCT system could estimate the lesion depth and mineral loss quantitatively as a caries diagnostic tool, and to examine correlation between OCT data (lesion images and depth-profile of dB light intensity), and the lesion parameters (lesion depth: LD and mineral loss: ΔZ) determined by the common technique; quantitative microradiography (TMR). The null hypothesis was that there was no correlation in the lesion parameters between OCT and TMR. 2.Material and Methods2.1.Specimen PreparationFreshly extracted sound bovine incisor teeth, stored in a refrigerator until the experiment, were used in this study. Twenty-four root dentin blocks, 3 mm × 5 mm × 2 mm were cut from the teeth and embedded in quick self-curing acrylic resin (UNIFAST II, GC, Tokyo, Japan). The dentin surface was serially polished using 600, 1200, 1500 grit silicon carbide abrasive papers under running water to create a flat and smooth root dentin surface. The polished dentin surfaces were covered with a thin layer of acid-resistant nail varnish (Shiseido, Tokyo, Japan) except for a demineralization window (1.5 mm × 3 mm). The 24 specimens were randomly allocated to 3 groups and OCT images were taken as control before the demineralization (as described in Sec. 2.4). 2.2.Preparation of Artificial Root Dentin LesionsIn order to prepare the demineralized specimens with a wide range of lesion depth and mineral loss values, the bovine dentin specimens in 3 groups were demineralized for 4, 7, or 14 days in a demineralizing solution (1.5 mM CaCl2, 0.9 mM KH2PO4, 50 mM acetic acid, 3.08 mM NaN3, pH adjusted to 4.5 by NaOH) at 37 °C. For each demineralization group, 8 dentin specimens (in 150 ml demineralizing solution) were used. The demineralizing solution was refreshed twice a week. 2.3.OCT SystemThe SS-OCT system (Santec OCT-2000®, Santec Co., Komaki, Japan) is a frequency domain OCT technique that interprets the magnitude and coherence of the light reflected from the subject into the depth-profile of the subject. This system incorporates a high-speed frequency swept external cavity laser, and the wavelength ranged from 1260 to 1360 nm (centered at 1310 nm) at a 20-kHz sweep rate. Backscattered light from the subject was coupled back to the OCT system, in which the interference signal was digitized in time scale, and then analyzed in the Fourier domain to reveal the depth information of the subject. Two-dimensional cross-sectional images were created from serial backscatter (reflectivity) profiles (A-scans) along the surface. The axial and lateral resolutions of the system in air were 11 and 17 μm, respectively. The system acquired the image data (B-scan) in 0.3 s, including process time. The imaging range in this study was 5 mm (width) by 6.6 mm (height), forming a 2000 × 1019 pixel image with each pixel representing 2.5 μm width by 6.5 μm optical height. The sensitivity of this system and the shot-noise limited sensitivity were 106 and 119 dB, respectively. 2.4.OCT Imaging of the SpecimensThe hand-held scanning probe connected to the OCT system was set at 5 cm distance from the specimen surface, with the scanning beam oriented about 90 deg to the surface. A custom-made jig was mounted on a micrometer stage to keep each specimen surface parallel to the probe plane. For each specimen, the cross-sectional images were acquired before and after the demineralization, at the center of the window (as described in Sec. 2.1). In order to ensure the repeatability of the OCT scan before and after the demineralization, the specimens were placed at the same orientation as accurately as possible, and the B-scan was performed along a line between two points marked by a marker pen on the specimen surface. A small amount of a water-based gel containing 3% hydroxyl ethyl cellulose (HEC, Wako Chemicals, Osaka, Japan) was placed on the tooth surface as a refractive-index matching medium. In order to minimize effects of the gel on signal intensity and depth calculations, it was spread flat on the specimen surface using a microbrush to obtain a film thickness of approximately 100 μm. The homogeneity of the gel layer on the surface was confirmed visually and by OCT on each specimen. The specimens were tilted up to 3 deg to 5 deg to avoid mirror reflections from the surface of specimen on the OCT image. 2.5.Refractive Index MeasurementsRefractive index (n) values are required to convert the optical depth values measured from OCT to real depth values. In order to calculate the refractive index of sound and demineralized dentin in this study, additional specimens were prepared; dentin slices approximately 200 to 240 μm in thickness were cut from bovine incisors root and imaged by OCT while placed on an aluminum plate as a total reflective stage under hydration. OCT images were obtained and n was calculated by dividing the optical thickness over the real thickness using image analysis software (ImageJ version 1.42q; Wayne Rasband, NIH, Bethesda, Maryland), following the optical path length matching method described previously.18 The average values measured were n = 1.54 for the sound dentin (before demineralization, consistent with the previous report18) and n = 1.44 for the dentin slices, which were deprived from minerals following 2-week immersion in the same demineralization solution as described above. This value was consistent with a previous report on the hydrated type I collagen.19 When calculating demineralized lesion depth from OCT images, it was assumed that the refractive index of the lesions created by the severe demineralization pattern employed in the current study was close to that of the mineral-deprived dentin. 2.6.OCT Image AnalysisOCT images of demineralized dentin appeared brighter compared to the sound dentin and showed a boundary [Fig. 1a]. It was investigated whether the distance from the lesion surface to the boundary (hereafter, boundary depth) corresponded to the lesion depth. All optical depth values were converted to true depth values by dividing them to the refractive index of the imaged tissue, presented in Sec. 2.5. Using ImageJ, the obtained OCT image was rotated to compensate for the tilting and reach a horizontal surface. A noise-reducing median filter (size 2) was applied to the data. For boundary depth calculation, an area of interest was set by a reference overlay [approximately 1.5 mm in depth, 1.0 mm in width; Fig. 1b]. The selected area on the OCT image was converted to binary, based on the threshold value of the boundary. The binarization was complete when the outline of the binarized area corresponded to the visual boundary observed on the original image [Fig. 1c]. The average depth of boundary was calculated in the binarized area and corrected for the refractive index to represent the lesion depth from OCT images (LDOCT, micrometers). On the other hand, in order to investigate whether the OCT signal (reflectivity or backscatter from demineralized dentin) indicated mineral loss, the following steps were performed; first, average dB values versus depth profiles were calculated over the width of 1.0 mm on each specimen (Fig. 2). Then, the intensities (dB) of the reflectivity (backscattering in the lesion body) were integrated from the lesion surface to LDOCT and the integrated values (dB micrometers) were defined as R D. Similarly, for the sound dentin (before demineralization), the integrated values to the same depth were calculated and defined as R S. Finally, ΔR was introduced as the change in integrated reflectivity after demineralization (ΔR = R D −R S). Fig. 1Image analysis for determination of demineralized lesion depth (LDOCT). (a) OCT image as obtained after scanning the demineralized specimen (b) A noise reducing median filter was applied and the image cropped to the area of interest, including the lesion. The dotted line indicates the boundary depth. (c) A binary image was produced based on the threshold value of the boundary. Thickness of this area (black double-arrow) represented optical depth of lesion, converted to LDOCT using the refractive index (n).  2.7.TMR AnalysisAfter capturing the dentin lesion images by OCT, the specimens were processed for TMR analysis as follows; first, they were dehydrated in ascending alcohol solutions (totally about 16 h), immersed in styrene monomer (2 h), and embedded in polyester resin (Rigolac, Oken, Tokyo, Japan). Then, the specimens were cut into sections approximately 200 to 240 μm in thickness using a low-speed diamond saw (Isomet 5000; Buehler, Lake Bluff, Illinois). TMR images were taken from a central dentin lesion slice using an x ray generator (SRO-M50; Sofron, Tokyo, Japan) at 25 kV voltage and 4 mA current for 20 min, with a Ni filter. The distance between the x ray tube and the specimen was 15 cm. The TMR images, together with 15 aluminum step-wedges (each 15 μm in thickness), were captured in the x ray glass plate film (High Precision Photo Plate PXHW, Konica Minolta Photo, Tokyo, Japan), and scanned as 8-bit digital images using a CCD camera (DP70, Olympus, Tokyo, Japan) attached to a microscope (BX41, Olympus). Mean mineral profiles (mineral density versus depth) were created using ImageJ and a custom Visual Basic application written in Microsoft Excel. The mineral density (vol. %) was calculated using the calibration curve, considering that the sound (nondemineralized) contained 48 vol. % mineral density.20 The lesion depth (LDTMR, μm) was defined at a distance from the lesion surface where the mineral density was 5% less than that in the sound area. The mineral loss (ΔZ, vol. % μm) was determined by the integrated mineral loss from the lesion surface to the lesion depth. 2.8.Statistical AnalysisThe results of lesion depth were analyzed by the two-way analysis of variance (ANOVA) with the demineralization time (4d, 7d, or 14d) and measurement method (OCT or TMR) being the factors. Student's t-test with Bonferroni corrections were performed to compare between each pair of groups. Pearson's correlation coefficient (r) and confidential intervals (CI) were calculated to investigate the relationship between the LDOCT and LDTMR and between ΔZ and R D, as well as ΔZ and ΔR. All the statistical procedures were performed at a 95% level of confidence with the Statistical Package for Medical Science (SPSS Ver.11 for Windows, SPSS, Chicago, Illinois). 3.ResultsThe OCT images were taken in wet condition, and the lesion surface appeared flat with no remarkable shrinkage or loss of surface as presented in Fig. 3. In most of the demineralized specimens (23 out of 24 specimens), the OCT depth-profile showed decreased reflectivity (dB) at the lesion surface zone, but increased reflectivity beneath the surface zone. In all the OCT images after the demineralization, a boundary was seen below the lesion surface that suggested the lesion front (LDOCT) in this study. Fig. 3Typical examples of SS-OCT images. Gradual progress of demineralized lesion can be observed. Blank triangles indicate the reflection from nail vanish surface and solid triangles point to water gel surface. Arrows indicate the horizontal boundary, and the vertical scale bar presents 300 μm optical axial distance. (a) before demineralization; (b) the same specimen as in (a) after 4-day demineralization, (c) a different specimen after 7-day demineralization; (d) another specimen after 14-day demineralization.  The representative TMR image and corresponding mineral profile are presented in Figs. 4 and 5, respectively. Figure 6 shows ranges of the LDTMR and ΔZ of 24 specimens obtained by TMR analysis in this study. The former ranged from approximately 200 to 500 μm, and the latter approximately 10,000 to 30,000 vol. % μm. A linear relationship was found between them. In the TMR images of the demineralized dentin lesions, all the specimens showed cavitated lesions (no surface layer), and shrinkage of demineralized dentin was found (around 10% of the lesion depth in all groups), probably due to severe mineral loss at the lesion surface layer and dehydration of samples for TMR analysis. To minimize the effects of shrinkage on calculations in this study, the LDTMR and ΔZ were determined, taking the original dentin surface as the reference. Fig. 4(a) A typical example of TMR image after the demineralization, corresponding to the SS-OCT B-scan presented in Fig. 1. Cavitated lesion with slightly shrunken collagen was seen. Broken line is the original level of dentin on the sample.  Fig. 5Mineral profile of the sample shown in Fig. 4. The lesion depth (LDTMR) was defined at a distance from the lesion surface where the mineral concentration was 5% less than that in the sound area (48 vol. %). The mineral loss (ΔZ: vol. % μm) was determined by the integrated mineral concentrations from the lesion surface to the lesion depth. Severe demineralization resulted in a very low mineral content (less than 10 vol. %) in the greater part of the lesion.  Fig. 6Distribution of lesion depth (LDTMR) and mineral loss (ΔZ) of samples; confidence intervals of the fitted line presented by the dotted lines (R 2 = 0.82, p < 0.05). 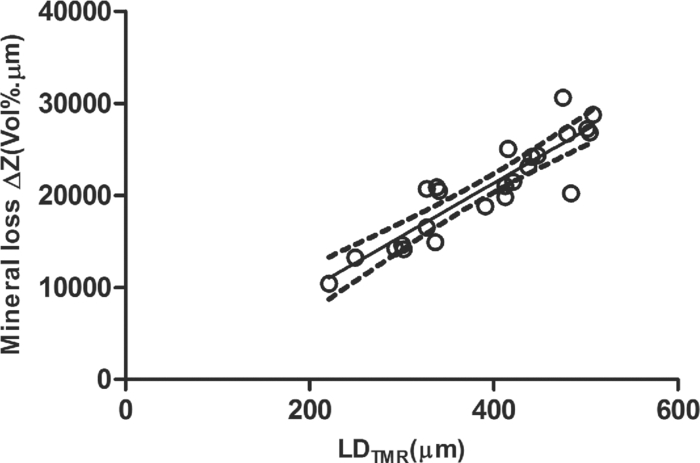 The authors tried to find out a general feature (presence of peak or inflection point in the OCT depth-profiles) regarding the location of optical LDTMR values by plotting them on the corresponding OCT depth-profiles for each specimen. However, no clear features or trends were noted. The locations of the optical LDTMR were widely scattered on the OCT depth-profiles, meaning that estimation of the lesion depth from OCT depth-profiles averaged over an area on the cross-section was difficult. Also, examination of the relationship between the optical LDTMR and LDOCT on OCT depth profiles showed that in 21 out of the 24 specimens, LDOCT was 31.1 ± 11.7% shallower compared to the optical LDTMR, while in the other three specimens, LDOCT was 5.2 ± 3.4% deeper than the optical LDTMR. Furthermore, in order to estimate the mineral density at the actual LDOCT in the TMR mineral profile, the actual LDOCT were located on the profiles. The results revealed that the mineral density at the actual LDOCT were quite lower (45.3 ± 24.5%) compared to the sound density. Figure 7 presents depth comparisons between LDTMR and actual LDOCT at different demineralization times. The two-way ANOVA suggested that both factors of measurement method and demineralization time had a significant effect on the value calculated for lesion depth (p < 0.05); however, the interaction of two factors was not significant, indicating that effect of demineralization time, i.e., the lesion progress, was identified by both TMR and OCT. Pairwise comparisons of LD indicated that at each time, LDOCT and LDTMR were significantly different (p < 0.05). There was no statistically significant difference in LDOCT between 4d and 7d demineralization (p > 0.05). Fig. 7Depth comparisons between LDTMR and actual LDOCT at different demineralization times. The horizontal line indicates no statistically significant difference (p > 0.05).  As in Fig. 8, Pearson correlation found a statistically significant relationship between the LDOCT and LDTMR (p < 0.001, r = 0.68, CI = 0.39 to 0.85). Fig. 8Regression between LDTMR and LDOCT with confidence intervals of the fitted line (R 2 = 0.47, p < 0.05). 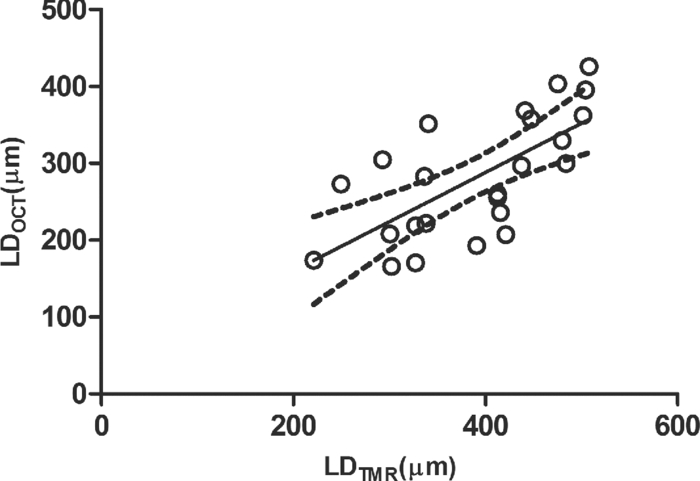 Furthermore, statistically significant correlations were found between ΔZ and R D (LDOCT) (p < 0.001, r = 0.67, CI = 0.36 to 0.84) or ΔR, respectively (p < 0.005, r = 0.57, CI = 0.22 to 0.79) [Figs. 9a and 9b]. 4.DiscussionIt is known that there are at least two types of incipient lesions in root dentin, cavitated and subsurface (noncavitated) lesion. The former has no surface layer, and the latter does the surface layer. This study examined utility of the OCT images and depth-profiles with the cavitated root lesions in bovine tooth that were artificially produced. The first main findings in this study were that the OCT images of the demineralized specimens showed a boundary (Fig. 3), and that a statistically significant correlation was found between LDTMR and LDOCT (Fig. 8). These findings strongly suggested that the boundary observed in OCT images reflected the lesion front. Generally, demineralization in dentin results in an increased porosity due to the mineral loss in the lesion body. It is known that higher porosity causes higher reflectivity due to an enormous number of micro-interfaces between water and demineralized mineral crystals or collagen fibers in the porosity. The increased porosity would, therefore, be associated with an increase in backscattering of light. It should be noted that due to rapid attenuation of light within the demineralized dentin and multiple scattering of light along the lesion-depth, the dentin beneath the boundary appeared darker (weaker signal) when compared to the same specimen before demineralization (at the baseline). However, the correlation between LDTMR and LDOCT was not very strong (r = 0.68) and the CI (0.39 to 0.85) was quite wide. Several factors were considered to explain this wide range, as follows: first, relative mineral densities at the LDOCT were quite low (45.3 ± 24.5%) according to the TMR profiles. The boundary was thought to be representing a depth within the broad range where mineral density of the demineralized dentin continuously increased at a higher rate as shown in TMR profiles (Fig. 5). It was speculated that in the event where LDTMR values were similar between two specimens, their difference in the rate of mineral increase in the base of the lesion (line slopes in TMR profile) could cause a variation in the boundary depth. The binarization process of OCT images, where the examiner determined the boundary location subjectively relying on the black-and-white contrast around the boundary, could be another factor affecting the results. Such subjective measurement might induce some variation when determining the boundary depth, even though the operator was calibrated to these procedures and blind to the study groups. Le 6 tried to use a constant value as a cutoff point in the signal intensity for the lesion depth using PS-OCT B-scan of the reflectivity in the orthogonal polarization to the incident linearly polarized light on enamel specimens. They defined the depth as a location where the intensity decreased to a dB value of (1/e2) from the peak intensity; however, they mentioned that this approach was not always effective. Furthermore, they tried to use an edge finding algorithm by computer processing for determining the lesion depth on enamel.6 In the current study, the authors tried various mathematical functions or algorithms to automatically process the signal or the image and determine the boundary on dentin B-scans with SS-OCT; however, there was little success in development of an optimized method which could work properly on the wide range of lesion depths for specimens in all three groups. Fundamental differences in light scattering and propagation between enamel and dentin, and also differences in the signal between polarization-sensitive and conventional OCT should be considered thereby. In this study, LDOCT values were quite lower (31.1 ± 11.7%) than the corresponding LDTMR values. Also, the coefficient of linear regression between the two variables was not very good (Fig. 8). The finding was in agreement with previous studies conducted by PS-OCT, where the lesion depth measured on the thin slices was 20% to 30% (in the case of TMR on enamel)21 or 35% (in the case of polarized microscopy in dentin) deeper than the depth measured by OCT.22 As shown in Fig. 2, peculiar changes were observed in the reflectivity (dB intensity) profiles at different depths. For instance, a decreased reflectivity at the lesion surface layer was observed compared to sound dentin, while there was an increased reflectivity beneath the lesion surface layer zone. Interpreting the signal is not easy, and the exponential attenuation of light while propagating within dentin makes it more complicated. The authors believe that these signal fluctuations were associated not only with changes in the porosity, but also in structural phase (organic versus mineral-organic) and optical properties in the lesion body.23, 24 It is known that the conventional OCT (non PS-OCT) images may show a strong reflection at the tooth surface due to Fresnel reflections.16, 17 The intensity of the light reaching a particular depth for any position across the sample is affected by how strongly features directly above that position reflect or randomly scatter the light.25 Our preliminary experiments found that the reflection could be reduced by covering the tooth surface with a thin layer of water (n = 1.33), which will decrease the refractive index contrast at the air-sample interface, minimizing the effects of strong surface reflections on calculations of R and improving the quality of OCT image. However, it is difficult to control the thickness of plain water layer, and the variable water thickness may distort the OCT images. In this experiment, a water-based gel was applied on the surface to reduce the specular reflection from the surface, and improve signal intensity at a deeper layer. The HEC content of the gel affected the consistency and viscosity of the gel and was adjusted (3% by weight) so that a uniform and transparent layer could be formed on the surface of dentin. Clinically, the application of such an agent may not be necessary, due to the moist nature of the oral environment and presence of saliva, or acquired pellicle on the exposed root surfaces. In vivo experiments are necessary to examine this assumption. In addition, the lesions in this study were relatively deep, ranging from 200 to 500 μm; finding out whether the approach taken in this study to decrease surface reflections would benefit detection of much shallower or early lesions (less than 100 μm in depth) requires further research. The second main finding in this study was statistically significant but moderate correlations between ΔZ and R D or ΔR (Fig. 9). In the clinical setting, the quantification of R D would be meaningful for estimating lesion progress at different times when monitoring a root dentin surface lesion. On the other hand, ΔR is not a nature to be calculated due to unavailability of R S; theoretically a ΔR value might be calculated for any existing specimen provided that standard R S values could be established and validated against a wide range of dentin specimens. It should be noted that within the limitations of the current in vitro study under controlled conditions, little variation was observed among the baseline reflectivity profiles and images. In relation to R calculations, Fried 16 suggested to use a fixed depth value (200 μm), and found statistically significant correlations between the integrated value and period for demineralization. Another study similarly used a fixed value (400 μm) to calculate ΔR for three groups which had statistically not different lesion depths.15 In the current study, three different demineralization times were investigated which resulted in significantly different lesion depths; therefore, ΔR was calculated according to LDOCT on each individual specimen to account for the relatively wide range of demineralization depths. It should also be pointed that basically, the magnitude of light scattering in sound dentin is markedly higher than in sound enamel due to the more complex structure of dentin composed of both organic and inorganic elements, and dentinal tubules as the main scatterers.24 Moreover, the difference in scattering between sound and demineralized dentin is much less than the difference between sound and demineralized enamel; in this regard, the use of OCT for assessment of mineral loss in dentin based on R tends to be more challenging when compared to that in enamel.13, 14, 16, 22 This study focused on estimation of the lesion depth and mineral loss of cavitated dentin lesions based on a boundary observed on the SS-OCT image, considering that this boundary represented extent of the lesion; however, it is known that there are several types of dentin lesions, including early erosive lesions, deep cavitated lesions, and subsurface lesion with a hypermineralized surface layer.26, 27 Therefore, it is required to examine the utility OCT for these demineralized lesions, in addition to the remineralized lesions. A dental SS-OCT system with an intraoral probe is under development;28 OCT may become a clinical tool for assessment of root lesions provided that further research approves these potentials. 5.ConclusionsIn OCT images, in vitro cavitated dentin lesions appeared visually different from sound dentin, with a clear boundary suggesting extent of the lesion. OCT also showed a potential for quantitative estimation of lesion depth and mineral loss in these lesions as significant, but moderate correlations in the lesion parameters were found between SS-OCT and TMR. The lesion depth estimated by the OCT (boundary depth) was generally shallower than the actual lesion depth measured by TMR. AcknowledgmentsThis work was supported by a grant from the Japanese Ministry of Education, Global Center of Excellence Program (GCOE), International Research Center for Molecular Science in Tooth and Bone Diseases; the Research Grant for Longevity Sciences (21A-8) from Ministry of Health, Labor, and Welfare; and Grant-in-Aid for Scientific Research (No. 22791924) from the Japan Society for the Promotion of Science (JSPS). Finally, the authors wish to thank Dr. Masaomi Ikeda of School for Dental Technology, Tokyo Medical and Dental University for his generous help and advice on the statistical analysis. ReferencesR. V. Katz,
“The clinical diagnosis of root caries: issues for the clinician and the researcher,”
Am. J. Dent., 8
(6), 335
–341
(1995). Google Scholar
Criteria Manual for the International Caries Detection and Assessment System (ICDAS II), http://www.icdas.org Google Scholar
W. Zhang, C. McGrath, and
E. C. Lo,
“A comparison of root caries diagnosis based on visual-tactile criteria and DIAGNOdent in vivo,”
J. Dent., 37
(7), 509
–513
(2009). https://doi.org/10.1016/j.jdent.2009.03.009 Google Scholar
A. Baysan, E. Lynch, R. Ellwood, R. Davies, L. Petersson, and
P. Borsboom,
“Reversal of primary root caries using dentifrices containing 5,000 and 1,100 ppm fluoride,”
Caries Res., 35
(1), 41
–46
(2001). https://doi.org/10.1159/000047429 Google Scholar
M. Ando, M. H. van Der Veen, B. R. Schemehorn, and
G. K. Stookey,
“Comparative study to quantify demineralized enamel in deciduous and permanent teeth using laser- and light-induced fluorescence techniques,”
Caries Res., 35
(6), 464
–470
(2001). https://doi.org/10.1159/000047491 Google Scholar
M. H. Le, C. L. Darling, and
D. Fried,
“Automated analysis of lesion depth and integrated reflectivity in PS-OCT scans of tooth demineralization,”
Lasers Surg. Med., 42
(1), 62
–68
(2010). https://doi.org/10.1002/lsm.20862 Google Scholar
Y. Shimada, A. Sadr, M. F. Burrow, J. Tagami, N. Ozawa, and
Y. Sumi,
“Validation of swept-source optical coherence tomography (SS-OCT) for the diagnosis of occlusal caries,”
J. Dent., 38
(8), 655
–665
(2010). https://doi.org/10.1016/j.jdent.2010.05.004 Google Scholar
M. A. Choma, M. V. Sarunic, C. Yang, and
J. A. Izatt,
“Sensitivity advantage of swept source and Fourier domain optical coherence tomography,”
Opt. Express, 11
(18), 2183
–2189
(2003). https://doi.org/10.1364/OE.11.002183 Google Scholar
K. Zheng, B. Liu, C. Huang, and
M. E. Brezinski,
“Experimental confirmation of potential swept source optical coherence tomography performance limitations,”
Appl. Opt., 47
(33), 6151
–6158
(2008). https://doi.org/10.1364/AO.47.006151 Google Scholar
Z. Lu, D. K. Kasaragod, and
S. J. Matcher,
“Performance comparison between 8- and 14-bit-depth imaging in polarization-sensitive swept-source optical coherence tomography,”
Biomed. Opt. Express, 2
(4), 794
–800
(2011). https://doi.org/10.1364/BOE.2.000794 Google Scholar
R. Leitgeb, C. K. Hitzenberger, and
A. F. Fercher,
“Performance of fourier domain vs. time domain optical coherence tomography,”
Opt. Express, 11
(8), 889
–893
(2003). https://doi.org/10.1364/OE.11.000889 Google Scholar
A. M. Davis, M. A. Choma, and
J. A. Izatt,
“Heterodyne swept-source optical coherence tomography for complete complex conjugate ambiguity removal,”
J. Biomed. Opt., 10
(6), 064005
(2005). https://doi.org/10.1117/1.2136147 Google Scholar
B. T. Amaechi, A. G. Podoleanu, G. Komarov, S. M. Higham, and
D. A. Jackson,
“Quantification of root caries using optical coherence tomography and microradiography: a correlational study,”
Oral Health Prev. Dent., 2
(4), 377
–382
(2004). Google Scholar
S. K. Manesh, C. L. Darling, and
D. Fried,
“Polarization-sensitive optical coherence tomography for the nondestructive assessment of the remineralization of dentin,”
J. Biomed. Opt., 14
(4), 044002
(2009). https://doi.org/10.1117/1.3158995 Google Scholar
C. Lee, C. L. Darling, and
D. Fried,
“Polarization-sensitive optical coherence tomographic imaging of artificial demineralization on exposed surfaces of tooth roots,”
Dent. Mater., 25
(6), 721
–728
(2009). https://doi.org/10.1016/j.dental.2008.11.014 Google Scholar
D. Fried, J. Xie, S. Shafi, J. D. Featherstone, T. M. Breunig, and
C. Le,
“Imaging caries lesions and lesion progression with polarization sensitive optical coherence tomography,”
J. Biomed. Opt., 7
(4), 618
–627
(2002). https://doi.org/10.1117/1.1509752 Google Scholar
R. S. Jones, C. L. Darling, J. D. B. Featherstone, and
D. Fried,
“Imaging artificial caries on the occlusal surface with polarization-sensitive optical coherence tomography,”
Caries Res., 40
(2), 81
–89
(2006). https://doi.org/10.1159/000091052 Google Scholar
Z. Meng, X. S. Yao, H. Yao, Y. Liang, T. Liu, Y. Li, G. Wang, and
S. Lan,
“Measurement of the refractive index of human teeth by optical coherence tomography,”
J. Biomed. Opt., 14
(3), 034010
(2009). https://doi.org/10.1117/1.3130322 Google Scholar
X. Wang, T. E. Milner, M. C. Chang, and
J. S. Nelson,
“Group refractive index measurement of dry and hydrated type I collagen films using optical low-coherence reflectometry,”
J. Biomed. Opt., 1
(2), 212
–216
(1996). https://doi.org/10.1117/12.227699 Google Scholar
M. H. van der Veen, H. Tsuda, J. Arends, and
J. J. ten Bosch,
“Evaluation of sodium fluorescein for quantitative diagnosis of root caries,”
J. Dent. Res., 75
(1), 588
–593
(1996). https://doi.org/10.1177/00220345960750011201 Google Scholar
A. M. Can, C. L. Darling, C. Ho, and
D. Fried,
“Non-destructive assessment of inhibition of demineralization in dental enamel irradiated by a λ = 9.3-microm CO2 laser at ablative irradiation intensities with PS-OCT,”
Lasers Surg. Med., 40
(5), 342
–349
(2008). https://doi.org/10.1002/lsm.20633 Google Scholar
S. K. Manesh, C. L. Darling, and
D. Fried,
“Nondestructive assessment of dentin demineralization using polarization sensitive optical coherence tomography after exposure to fluoride and laser irradiation,”
J. Biomed. Mater. Res., Part B: Appl. Biomater., 90
(2), 802
–812
(2009). https://doi.org/10.1002/jbm.b.31349 Google Scholar
D. Spitzer and
J. J. ten Bosch,
“The absorption and scattering of light in bovine and human dental enamel,”
Calcif. Tissue Res., 17 129
–137
(1975). https://doi.org/10.1007/BF02547285 Google Scholar
X. J. Wang, J. Y. Zhang, T. E. Milner, J. F. Boer, Y. Zhang, D. H Pashley, and
J. S. Nelson,
“Characterization of dentin and enamel by use of optical coherence tomography,”
Appl. Opt., 38
(10), 586
–590
(1999). https://doi.org/10.1364/AO.38.002092 Google Scholar
J. P. Dunkersa, R. S. Parnasa, C. G. Zimbaa, R. C. Petersona, K. M. Flynna, J. G. Fujimoto, and
B. E. Bouma,
“Opticalcoherence tomography of glass reinforced polymer composites,”
Composites, Part A, 30
(2), 139
–145
(1999). https://doi.org/10.1016/S1359-835X(98)00084-0 Google Scholar
B. Nyvad, J. M. ten Cate, and
O. Fejerskov,
“Arrest of root surface caries in situ,”
J. Dent. Res., 76
(12), 1845
–1853
(1997). https://doi.org/10.1177/00220345970760120701 Google Scholar
J. M. ten Cate, J. J. Damen, and
M. J. Buijs,
“Inhibition of dentin demineralization by fluoride in vitro,”
Caries Res., 32
(2), 141
–147
(1998). https://doi.org/10.1159/000016444 Google Scholar
A. Sadr, Y. Shimada, J. R. Mayoral, I. Hariri, T. A. Bakhsh, Y. Sumi, and
J. Tagami,
“Swept source optical coherence tomography for quantitative and qualitative assessment of dental composite restorations,”
Proc. SPIE, 7884 78840C
(2011). https://doi.org/10.1117/12.877351 Google Scholar
|