
|
|
1.IntroductionAutofluorescence is based on the presence of endogenous fluorophores residing in the enamel and dentin.1, 2 It is well known that dental enamel and dentin exhibit laser-induced fluorescence at wavelengths longer than the excitation wavelength. Among the earliest reports of dental autofluorescence is the detection of an orange and red fluorescence of the “tooth film” in patients.3 Later, tooth autofluorescence was observed under ultraviolet excitation.4, 5 Since then, there have been many studies on dental autofluorescence and it has now become a diagnostic tool in caries detection (QLF, Inspektor Research Systems, Netherlands). The fluorescence spectra of sound teeth have been reported to be dependent on excitation wavelength.6 A red-shift of the excitation wavelength led to a corresponding red-shift in the wavelength of maximum autofluorescence. This phenomenon will henceforth be defined as “red-shifted autofluorescence.” Therefore, the governing mechanism of dental autofluorescence does not obey classical fluorescence, where the peak fluorescence wavelength is largely independent of excitation wavelength.7 However, the mechanism governing the observed phenomenon is still unclear. Therefore, understanding the fluorescence emission mechanism of tooth enamel and dentin will be fundamental toward the development of further autofluorescence-based dental diagnostic technologies. In the present study, quantitative fluorescence measurements of dental specimens were obtained. Specimens were excited at four laser wavelengths (405, 444, 532, and 635 nm), and absolute intensity ratios were measured. These results were analyzed to determine whether Raman scattering6 was responsible for the red-shifted spectra. 2.Materials and Methods2.1.Specimen PreparationThe Institutional Review Board approved a study that used sound human extracted molars and premolars (n = 14), 10 intact specimens, 2 sectioned coronal dentin specimens, and 2 sectioned enamel specimens, all with surfaces gently cleaned by a toothbrush and were stored in a 0.1% thymol solution at room temperature. The dentin specimens were obtained by laterally sectioning through the center of two sound teeth. The enamel specimen was cut off the teeth and ground from the dentin-enamel junction until only enamel remained. Absence of lesions was confirmed by using visual inspection as well as the QLF dental diagnostic tool (Inspektor Research Systems, Netherlands).8 The surfaces of the specimens were cleaned via a toothbrush, but left unpolished and curved to represent clinical situations.8 2.2.InstrumentationEmission spectra were measured using a commercial spectrometer with a grating groove density of 600 lines/mm (650 nm spectral range) and a 200 μm width entrance aperture (USB 2000+, Ocean Optics Inc., Dunedin, Florida). It was fitted with a 2048 element linear silicon CCD detector array (ILX511, Sony Corp., Tokyo, Japan) with a corrected linearity of greater than 99.8%. The computed resolution of the spectrometer was 4.8 nm. The experimental setup is shown schematically in Fig. 1. It consists of a fiber coupled diode laser module (FTEC2, Blue Sky Research, Milpitas, California) containing a 405-nm laser diode (NDV4313, Nichia Corp., Tokushima, Japan), 444-nm fiber coupled diode laser module (FTEC2, Blue Sky Research, Milpitas, California) containing a blue laser diode (NDHB510APA, Nichia Corp., Tokushima, Japan), a 532-nm fiber coupled diode laser module (FTEC2, Blue Sky Research, Milpitas, California), and a 635-nm fiber coupled diode laser module (FTEC2, Blue Sky Research, Milpitas, California). All lasers were measured with the spectrometer to confirm the laser wavelength. A 1.2-mm fiber bundle was assembled in our laboratory to guide the light from the lasers to the test specimens and deliver the autofluorescence to the spectrometer.9 A small diameter (0.8 mm) lens, not shown in Fig. 1, is positioned 150 μm from the end of the laser excitation delivery fiber. The focused laser spot size at the specimen is approximately 25 μm. Fig. 1Schematic diagram of the experimental setup. The extracted teeth were held in a chamber filled with water. A custom flexible fiber illuminated the teeth enamel with either a 405, 444, 532, or 635 nm laser. The collected fluorescence passed through an in-line optical filter to remove laser light before entering the spectrometer. The spectra were saved on the PC and analyzed offline.  2.3.Experimental ProcedureContinuous wave output power was set to a constant at 1.34 mW for all lasers using an optical power meter (Model 1835-c, Newport Corp., Irvine, California). A 420 nm in-line longpass filter (E420LPv2, Chroma Technology Corp., Bellows Falls, Vermont), or a 450 nm in-line longpass filter (NT62-982, Edmund Optics Inc., Barrington, New Jersey), or a 532 nm in-line rejection filter (NT63-346, Edmund Optics Inc., Barrington, New Jersey), or a 645 nm in-line longpass filter (HQ645LP, Chroma Technology Corp., Bellows Falls, Vermont), were used individually for every excitation wavelength to attenuate excitation laser light at the spectrometer entrance aperture. Teeth specimens were placed in a custom made chamber filled with deionized water. The fiber tip was placed in the chamber and submerged in the water. Fluorescence scans were performed for all four excitation lasers using a detector integration time of 100 ms. All emission spectra were recorded in a dark room to reduce stray ambient light. A universal serial bus port connected the spectrometer to a computer for spectral recordings. The spectral sensitivity of the spectrometer was corrected prior to data acquisition by a NIST-traceable (National Institute of Standards and Technology) calibrated tungsten halogen lamp (LS-1-CAL, Ocean Optics Inc., Dunedin, Florida). Additionally, the dark spectrum was measured and stored, which was then subtracted out during spectral acquisition to reduce noise and further ensure removal of stray light. The spectral transmission of the fluorescence isolation filters were measured with the spectrometer and the calibrated tungsten halogen lamp. 2.4.Data ProcessingAll emission spectra were filtered with a 13-point (corresponding to a spectral width of 4.94 nm) median filter to remove electronic noise, followed by a 13-point Gaussian smoothing filter. For each sample, all emission spectra were normalized to the peak intensity of the emission spectra obtained using the 405-nm excitation laser, so that the peak intensity of the main peak of the 405 nm emission spectra was set to 1. By normalizing the emission spectra, we were able to compare intensity values between different excitation lasers for each tooth, as well as for different teeth specimens. Additionally, another autofluorescence spectra plot was created where each spectrum was normalized to 1.0 to observe spectral shape. The measured transmission values of the fluorescence isolation filters were included in the calculations of the peak fluorescence intensity ratios. To further investigate the autofluorescence, the ratios were also determined for the two sectioned dentin specimens and two sectioned enamel specimens. 3.ResultsAll 10 intact specimens exhibited autofluorescence for 405, 444, and 532 nm excitation wavelengths [Fig. 2a]. At 635 nm, there was no detectable autofluorescence. The emission spectra showed a broad peak centered about 50 to 75 nm from the excitation wavelength, and gradually tapered off toward the longer wavelengths (peak fluorescence at 480, 512, and 579 nm for 405, 444, and 532 nm excitation, respectively). The shape of the spectra remained very similar regardless of the excitation wavelength [Fig. 2b], except that the autofluorescence intensity diminished greatly as the excitation wavelength increased [Fig. 2a]. The standard deviation of the peak fluorescence signal for 512 and 579 nm (corresponding to 444 and 532 nm excitation, respectively) normalized by 480 nm (corresponding to 405 nm excitation) is shown. The small peak left of the main peak visible in the 512 and 579 nm spectra is from the excitation laser reaching the spectrometer that was not fully attenuated by the optical filters. As shown in Table 1, the intensity of the fluorescence signal for an intact specimen decreased by a factor of 4.27 as the excitation wavelength increased from 405 to 444 nm. When the excitation wavelength changed from 444 to 532 nm, the ratio became 7.18. Finally, when comparing the fluorescence intensity between 405 and 532 nm excitation, the intensity ratio was 30.59. It should be noted that the most sensitive ratio to examine when determining the wavelength dependence of the autofluorescence intensity is the one between the largest excitation wavelength differences, e.g., 532 and 405 nm (Table 1, row 3). Table 1Intensity ratios between the three excitation laser wavelengths.
The peak fluorescence intensity ratios for pure enamel and pure dentin are also shown in Table 1. Autofluorescence from enamel and from dentin behave similar to the autofluorescence from the 10 intact teeth specimens. 4.DiscussionPhotoexcited emission from enamel and dentin is well known and generally assigned to organic matter embedded in the inorganic calcium apatite semicrystalline matrix.10 Buchalla has reported detailed spectra of emission from cross-sectioned enamel samples subjected to a range (380 to 580 nm) of excitation wavelengths.6 He observed a red-shift of the peak emission wavelength as the excitation moved to a longer wavelength. In the present study, laser excitation of extracted teeth at three wavelengths (405, 444, and 532 nm) revealed the same red-shifted emission from sound enamel (Fig. 2) as found by Buchalla. As the excitation wavelength was moved from short wavelengths (405 nm) to longer wavelengths (532 nm), the peak of the observed emission shifted from 480 to 579 nm, respectively. Fig. 2Averaged emission spectra for intact sound teeth (n = 10) for 405, 444, and 532 nm excitation normalized by the peak intensity of the 405 emission spectra. (a) As excitation wavelength increased, fluorescent intensity decreased greatly. (b) Average emission spectra for each excitation wavelength normalized to their respective main peak.  Excitation from the ground state to an excited electronic state of a molecule generally follows the Franck–Condon principle and favors excited and ground states with strong overlap of their vibronic levels. In many cases (e.g., nonpolar fluorophore and homogeneous nonpolar solvent), the excited upper electronic state rapidly relaxes to its lowest energy level on a time scale much shorter (picoseconds) than the fluorescence lifetime (nanoseconds). This nonradiative relaxation produces an emission wavelength relatively independent of the excitation wavelength. This characteristic of fluorescent light emission is often referred to as “Kasha's Rule.” Therefore, to account for the unexpected wavelength shift of the enamel emission, Buchalla mentions as a possibility that the emission from sound specimens could be due to Raman scattering rather than fluorescence. However, if the emitted wavelengths are the result of Raman scattering, their relative intensity should be proportional to the fourth power of the inverse of the exciting wavelength. Hence, the ratio of the 500 nm emission to the 560 nm emission should be (532/405)4, which equals 2.97. However, this theoretical ratio is nearly 10 times smaller than the observed ratio found in this study (Table 1) and well outside the uncertainty range and, therefore, is not consistent with a Raman mechanism. In addition, a change from 405 to 635 nm excitation should lead to a factor of 6.04 decrease in the Raman scattering signal. However, no detectable signal was observed with 635 nm excitation. A factor of 6.04 decrease in signal should be easily detected by the spectrometer since a factor of 28.99 decrease was detected for 405 nm going to 532 nm. Furthermore, the strong Stokes shifted Raman emission feature from the phosphate component of the dental enamel was not observed in the Buchalla spectra nor in the present study. The phosphate narrow band emission should appear at 960 cm−1 Stokes shifted from the excitation wavelength: 421 nm for 405 nm excitation and 561 nm for 532 nm excitation.11 Finally, the observed emission intensities are qualitatively too strong for typical Raman scattering. Environmental factors such as fluorophore and solvent polarity can alter the conventional pattern of fluorescent emission. The anisotropy observed in polarized fluorescence studies12 suggests a nonuniform environment surrounding the fluorophore in the enamel and dentin, which can produce a distribution of electronic energy levels for the fluorophore. Hence, a multitude of ground and excited states will exist throughout the matrix. The fluorophore in such a heterogeneous environment will behave as a collection of distinct species, and thus the spectroscopic properties of this ensemble will not be uniform.13, 14 The absorption spectra of a heterogeneously distributed fluorophore will appear broad due to the spatially nonequivalent ground and excited states. Excitation on the red-edge of the absorption band will selectively excite a specific subpopulation of fluorophores, each with an electronic energy gap that matches the excitation wavelength and is a function of its local geometry. Additionally, if the timescale of obtaining a relaxed equilibrium between the fluorophore and environment is greater than the excited-state lifetime of the fluorophore, the fluorescence wavelength of these emitters will be unique to the selected sites due to its perturbed fluorophore/environment interaction (Fig. 3). This phenomenon is often denoted as the “red-edge-excitation shift” (REES) or “red-edge effects.” (Refs. 13 and 14). Site specific excitation of a polar fluorophore at progressively increasing wavelengths on the red-edge of the absorption curve will produce fluorescence at increasingly red-shifted wavelengths. Fig. 3Pictorial representation of red-edge-excitation shift. In the enamel or dentin, a heterogeneous distribution of fluorophore (large oval) and its calcium apatite environment (small ovals) exists. Arrows inside ovals indicate polarity. Different excitation wavelength lasers exciting on the red-edge of the absorption band of the fluorophore will selectively excite different subpopulations. In this example, 405 nm excites subpopulation A and 532 nm excites subpopulation B, each with an electronic energy gap that matches the excitation wavelength. Excitation at progressively increasing wavelengths on the red-edge of the absorption curve will produce fluorescence at increasingly red-shifted wavelengths if the time scale of obtaining a relaxed equilibrium between the fluorophore and environment is greater than the excited-state lifetime of the fluorophore. 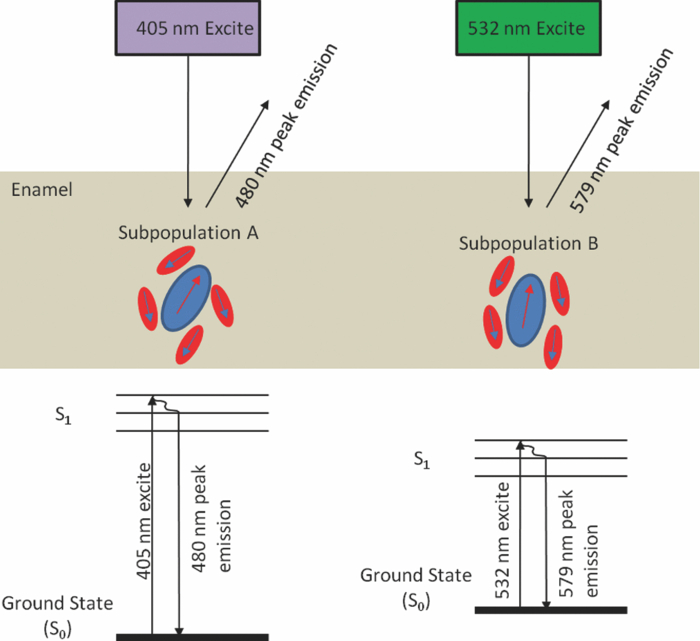 A likely fluorescent component of the enamel and dentin is an amino acid based on the 3-hydroxypyridinium ring and it is the major cross-linking element of collagens.15, 16, 17 There are two chemical forms, hydroxylysylpyridinoline (HP) and lysylpyridinoline (LP), that are based on the 3-hydroxypyridinium ring and both are naturally fluorescent. The hydroxypyridinium cross-link is present in most mature connective tissues, bone, and dentin, and has been recently found in enamel.18 Collagen derives its strength from packing into cross-linked fibrils, which reinforce bone, teeth, and tissue. As a result, the local environment of the HP and LP fluorophores is heterogeneous in dentin and enamel since the long chain collagen is embedded in a polycrystalline calcium apatite matrix and is partially surrounded by water. The peak absorption of both HP and LP under neutral pH conditions is located at 325 nm. Excitation at the peak absorption produces a broad (∼70 nm FWHM) fluorescence band centered near 400 nm. Excitation at the peak absorption wavelength leads to a large 75 nm Stokes shift that is comparable to the red-shifts reported by Buchalla and observed in this study. Excitation of HP and LP at wavelengths beyond 350 nm meets the criteria for red-edge excitation. This work does not conclusively demonstrate that HP and LP are the only fluorophores. Indeed, other fluorescent species have been proposed in the past, for example, tryptophan and tyrosine, and this work does not preclude their contribution to the observed fluorescence.1 In any case, a Raman scattering mechanism does not fit the red-shifted autofluorescence. In the present study, the excitation laser was not localized to a particular depth in the whole tooth specimen. As the excitation laser wavelength increases, the depth of penetration also increases.19 Therefore, it is expected that excitation at 635 and 532 nm would not only interrogate enamel but likely contain a contribution from the enamel dentin junction as well as the dentin, whereas 405 nm would be more localized to the enamel. As such, 405 nm excitation should theoretically excite less fluorophor than the longer wavelengths because it is more highly attenuated. Therefore, penetration depth cannot explain the observed dramatic decrease in autofluorescence intensity with 635 and 532 nm excitation (Table 1). It is known that scattering in dentin is relatively independent of wavelength.20, 21 Therefore, if the mechanism governing the observed results is due to scattering, the spectra will not change with increasing excitation wavelengths in the dentin. The peak fluorescence intensity ratios for dentin are shown in Table 1. The autofluorescence from dentin and enamel behaved similar to autofluorescence from the 10 intact specimens. In all cases, the change in peak intensity decreased by a factor of 30 going from 405 to 532 nm excitation, whereas only a factor of 3 decrease would be expected from a Raman mechanism. Therefore, the observed relative intensities are not strongly influenced by scattering. Laser-induced autofluorescence is a promising and exciting technology in the fight to detect early caries. Proper understanding of underlying mechanisms which govern the observed fluorescence will lead to greater insight and may permit successful detection of early carious lesions. This study demonstrated that dental autofluorescence intensity is heavily dependent on excitation wavelength, with an exponential decrease in emission intensity with increasing excitation wavelength, while the shape of the broad emission peak is relatively insensitive to the excitation wavelength. The governing mechanism which describes the results is provided by REES, where the heterogeneity of the fluorophore/environment population allows for different subpopulations to be excited in the red-edge of the absorption band, thus leading to an excitation wavelength dependent fluorescence spectrum. AcknowledgmentsThe authors would like to thank Dr. Jim Wefel and the University of Iowa for the procurement and preparation of the intact teeth specimens used in this study. We appreciate Dr. Joel Berg at The Center for Pediatric Dentistry for his comments on the draft, and providing enamel specimens as well as Grant Beyer at The Center for Pediatric Dentistry for his assistance in this study. The study was partially funded from the University of Washington's Center for Commercialization, Washington Research Foundation, and the Life Sciences Discovery Fund. Liang Zhang would like to thank the University of Washington Department of Bioengineering in administrating the Cable Fellowship. The authors would also like to thank the reviewers for their constructive comments. ReferencesK. König, G. Flemming, and
R. Hibst,
“Laser-induced autofluorescence spectroscopy of dental caries,”
Cell Mol. Biol., 44 1293
–1300
(1998). Google Scholar
B. Angmar-Mansson and
J. J. ten Bosch,
“Optical methods for the detection and quantification of caries,”
Adv. Dent. Res., 1 14
–20
(1987). Google Scholar
S. Bommer,
“Hautuntersuchungen im gefilterten quarzlicht,”
Klin. Wochenschr., 24 1142
–1144
(1927). https://doi.org/10.1007/BF01726474 Google Scholar
H. C. Benedict,
“Note on the fluorescence of teeth in ultra-violet rays,”
Science, 7 70
–79
(1928). https://doi.org/10.1126/science.67.1739.442 Google Scholar
R. L. Hartles and
A. G. Leaver,
“The fluorescence of teeth under ultraviolet irradiation,”
Biochem. J., 54 632
–638
(1953). Google Scholar
W. Buchalla,
“Comparative fluorescence spectroscopy shows differences in noncavitated enamel lesions,”
Caries Res., 39 150
–156
(2005). https://doi.org/10.1159/000083162 Google Scholar
J. R. Lakowicz, Principles of Fluorescence Spectroscopy, Springer, New York, NY
(2006). Google Scholar
J. Wefel,
(2010) Google Scholar
C. M. Lee, C. J. Engelbrecht, T. D. Soper, F. Helmchen, and
E. J. Seibel,
“Scanning fiber endoscopy with highly flexible, 1 mm catheterscopes for wide-field, full-color imaging,”
J. Biophoton., 3
(5-6), 385
–407
(2010). https://doi.org/10.1002/jbio.200900087 Google Scholar
F. Sundström, K. Fredriksson, S. Montan, U. Hafström-Bjork-Man, and
J. Ström,
“Laser-induced fluorescence from sound and carious tooth substance: spectroscopic studies,”
Swed. Dent. J., 9 71
–80
(1985). Google Scholar
J. F. Freeman and
M. J. Silva,
“Separation of the Raman spectral signatures of bioapatite and collagen in compact mouse bone bleached with hydrogen peroxide,”
Appl. Spectrosc., 56 770
–775
(2002). https://doi.org/10.1366/000370202760077513 Google Scholar
Y. Fukishima, T. Araki, and
M. Yamada,
“Topography of fluorescence and its possible composites in human teeth,”
Cell. Mol. Biol., 33 725
–736
(1987). Google Scholar
W. C. Galley and
R. M. Purkey,
“Role of heterogeneity of the salvation site in electronic spectra in solution,”
Proc. Nat. Acad. Sci. U.S.A., 67 1116
–1121
(1970). https://doi.org/10.1073/pnas.67.3.1116 Google Scholar
A. P. Demchenko,
“The red-edge effects: 30 years of exploration,”
J. Lumine., 17 19
–42
(2002). https://doi.org/10.1002/bio.671 Google Scholar
D. R. Eyre,
“Cross-linking in collagen and elastin,”
Ann. Rev. Biochem., 53 717
–748
(1984). https://doi.org/10.1146/annurev.bi.53.070184.003441 Google Scholar
S. S. Thomas, S. Mohanty, J. L. Jayanthi, J. M. Varughese, A. Balan, and
N. Subhash,
“Clinical trial for detection of dental caries using laser-induced fluorescence ratio reference standard,”
J. Biomed. Opt., 15 027001
(2010). https://doi.org/10.1117/1.3365945 Google Scholar
E. M. Rivera and
M. Yamauchi,
“Site comparisons of dentine collagen cross-links from extracted human teeth,”
Archs. Oral. Biol., 38 541
–546
(1993). https://doi.org/10.1016/0003-9969(93)90118-6 Google Scholar
Y. Açil, A. E. Mobasseri, P. H. Warnke, H. Terheyden, J. Wiltfang, and
I. Springer,
“Detection of mature collagen in human dental enamel,”
Calcif. Tissue Int., 76 121
–126
(2005). https://doi.org/10.1007/s00223-004-0122-0 Google Scholar
R. H. W Brodbelt, W. J. O’Brien, P. L. Fan, J. G. Frazer-Dib, and
R. Yu,
“Translucency of human dental enamel,”
J. Dent. Res., 60 1749
–1753
(1981). https://doi.org/10.1177/00220345810600100401 Google Scholar
D. Fried, R. E. Glena, J. D. B. Featherstone, and
W. Seka,
“Nature of light scattering in dental enamel and dentin at visible and near-infrared wavelengths,”
Appl. Opt., 34 1278
–1285
(1995). https://doi.org/10.1364/AO.34.001278 Google Scholar
D. Fried, J. D. B. Featherstone, R. E. Glena, B. Bordyn, and
W. D. Seka,
“Light-scattering properties of dentin and enamel at 543, 632, and 1053 nm,”
Proc. Soc. Photo-Opt. Instrum. Eng., 1880 240
–245
(1993). Google Scholar
|


