|
|
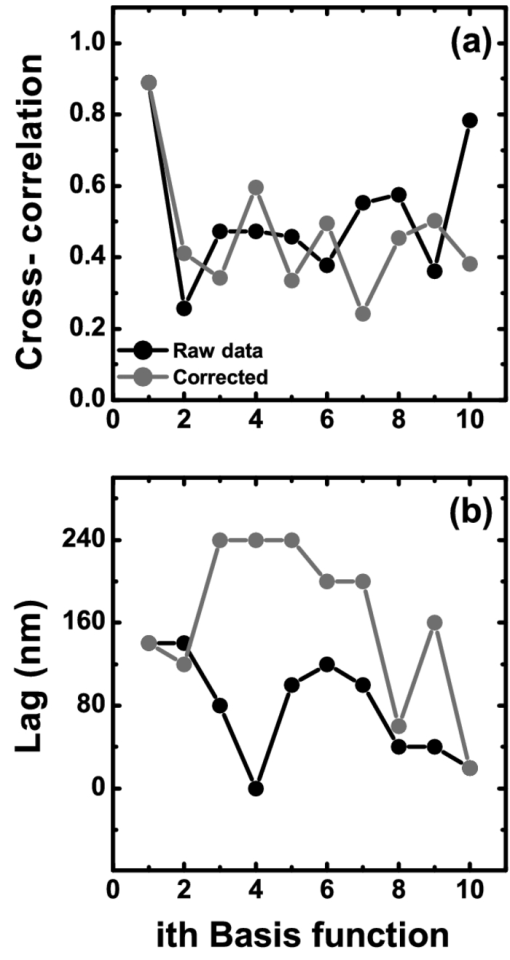
1.IntroductionThe human iris is the multilayered thin disk sector that surrounds the pupil and modifies its diameter. The iris color varies between people and arises from several optical phenomena like light absorption in the natural pigments and multiple scattering by the pigment granules and iridal tissues.1, 2, 3, 4, 5 Among the different cell types that contribute to the iris pigmentation, those that contain melanin or melanocytes play a central role. At least two types of iridal melanin have been identified; eumelanin, a dark-brown pigment and phenomelanin, a reddish-yellowish pigment. 4, 5, 6, 7, 8, 9, 10 The innermost layer of the iris pigment epithelium is dark in all irises and basically contains eumelanin.1, 7, 11 However, the structure and mixtures of both melanins in the iris stroma vary with iris color.1, 10, 12 Dark pigmented irises contain higher amounts of melanin and higher eumelanin/phenomelanin ratios,4, 7, 12, 13 larger melanin granules, and higher granule density than light pigmented irises.1, 12, 14 The irregular structure of the iris and other natural pigments such as carotenoids15 and hemoglobins in the blood vessels can also contribute to the total absorption and scattering, but their effects remain unclear.2, 3, 5, 16 The characterization of the iris reflectance in vivo is important because melanin has a photoprotective effect1, 6, 10 and has been correlated with certain pathological conditions (e.g., albinism), and ophthalmic diseases such as ocular melanoma,1, 17, 18 age-related macular degeneration,1, 6, 19 and cataracts.20, 21 Due to the complex spatio-chromatic structure of the iris, this characterization is best done by hyperspectral imaging, a technique that combines spatial and spectral information. In comparison with iris color classification systems,22, 23 standard color photographs,17, 24, 25 or conventional spectroradiometers and RGB camera-based systems,8, 16, 26, 27 hyperspectral imaging can be applied to detect local changes of reflectivity and to identify the presence of melanin. In hyperspectral imaging, a stack of images are collected across the electromagnetic spectrum producing a multidimensional representation of the biological tissue. These images are then combined producing a three-dimensional block or “image cube,” with two axes representing the spatial data and the third the spectral data.28, 29 In comparison with multispectral imaging, hyperspectral sensors deal with many adjacent wavelength bands and provide the continuous spectrum of a single scene pixel by pixel.29 Previous works have shown the applicability of multispectral imaging in iris recognition systems30, 31, 32, 33 and iris colorimetry.27 Vilaseca 27, 34 measured the iris reflectance using a motorized filter wheel from 400 to 700 nm in steps of 50 nm. The results of a principal component analysis (PCA) suggest that three principal components can account for more than 99% of the total variance across a large number of measured irises,27 and therefore only three well-defined colorants are sufficient to describe their spectral and chromatic variability. Because the sampling interval determines the number of principal components,35 it is not clear whether such a small number of components generalize for smaller sampling intervals more suitable for hyperspectral imaging,29 and for colorimetry and reflectance data.36 In this work we studied the spectral properties of light reflected in healthy human irises using a hyperspectral acquisition system with a spectral resolution of 20 nm. We examined the reflectance spectra for iris colorimetry and for dimensionality reduction and therefore, extended previous studies on multispectral optical imaging in the iris27, 32, 33, 34 providing more spectral information and determined the optimal number of elements by PCA. The number and spectral characteristics of human irises were also compared against a set of ocular prostheses as the control condition. In addition, the potential effects of spontaneous eye movements37 during the image acquisition and in the PCA, were studied using a correction algorithm based on the phase correlation method.38, 39, 40 The PCA results were also correlated with pigment identification, as under certain control conditions, PCA has been used to study the spatial properties of melanin and hemoglobins in the skin41, 42, 43 and in the cortical tissue.44 We compared PCA between a light and dark pigmented iris and the first characteristic vector was correlated with modeled reflectance curves in previous iris models.2, 3, 16 Finally, we investigated the possible influence of the iris texture on PCA taking into account the position of the selected areas in polar coordinates, namely, the radial coordinate and the polar angle, an approach that allows the analysis of structural effects in the spectral signature of the vectors inferred from PCA. 2.Hyperspectral Imaging SystemFigures 1a and 1b represent a schematic view of the light source module and the entire hyperspectral imaging system, respectively.45 It consisted of an illumination source or xenon lamp (Hamamatsu L2274, 150 W), connected to a power supply (Hamamatsu C2577). The light was collimated using two identical convergent lenses, each with a focal distance of 50 mm, and a circular diaphragm. The light was also filtered with ultraviolet and infrared blocking filters. Fig. 1(a) Schematic view of the light source module. (b) Schematic view of the hyperspectral imaging acquisition system. 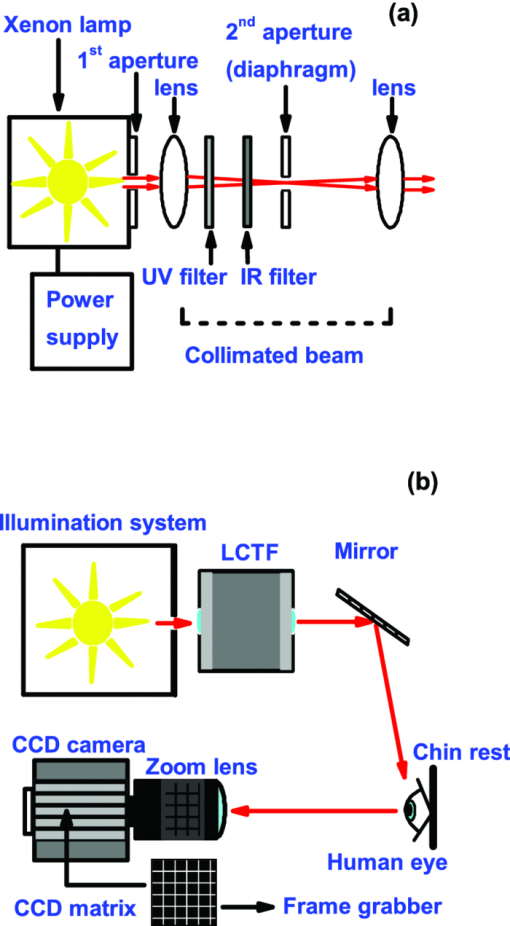 A tunable liquid crystal filter (Varispec VS-VIS2-10HC-35-SQ, Cambridge Research and Instrumentation, Inc., Boston, Massachusetts) was mounted in front of the light source. The filter has a transmission wavelength range between 400 to 720 nm with a FWHM of 10 nm at 550 nm. The bandwidth decreases to 6 nm at 400 nm and increases to 16 nm at 720 nm, in the same way as standard Lyot filters.28, 29 The out of band transmission was less than 0.01%. The filter had a 35-mm aperture and a field of view of ±7 deg. One mirror projected the collimated light over the iris at a fixed illumination angle close to 45 deg. To acquire hyperspectral images, a monochrome charge-coupled device (CCD) digital camera (TM-1010, Pulnix America, Inc.) was mounted normal to the human eye. The CCD camera had a spatial resolution of 1024×1024 pixels with a cell size of 9 μm × 9 μm and 10-bits output. The camera had an electronic shutter with a timer controlled by an external trigger pulse. A conventional objective (Cosmicar TV zoom lens nº 57827) was used in the camera. The lens had an aperture of f/1.8 and a focal distance between 12.5 and 75 mm. The working distance was reduced with a 40 mm extension tube between the CCD camera and the lens, producing a resolution of 25 μm per pixel. The images were acquired with a frame grabber (Matrox Corona/8/E, Matrox Electronic Systems, Ltd., Quebec). The frame grabber also provides the external signal to control the time shutter of the CCD camera. Synchronization and control of the frame grabber, a tunable liquid crystal filter (LCTF), and the CCD camera were done with in-house software. 3.Human and Artificial IrisesHyperspectral images were collected over 21 different human irises. In all cases, only the right eye was used as the test condition. The set of human irises contained samples within a reasonable range of colors, from dark brown to light blue. Observers did not blink the eyes during hyperspectral acquisition. The effect of colored lights on the consensual pupilary light reflex37, 46 was minimized illuminating the nontested iris in the left eye with a punctual source of light. All the iridal areas selected for further processing were far from the pupil border (see Fig. 2). A set of 4 ocular prostheses act as the control condition. The hyperspectral acquisition procedure used for the ocular prosthesis was identical to the real human irises. Fig. 2Example of the iridal areas analyzed by principal-component analysis. Each square area occupies a surface of size 11×11 pixels and is referred to as the center of the pupil. Their positions are expressed in polar coordinates, with the radial distance or the radial coordinate at 15, 30, and 45 pixels, and the polar angle at 280, 320, and 360 deg. 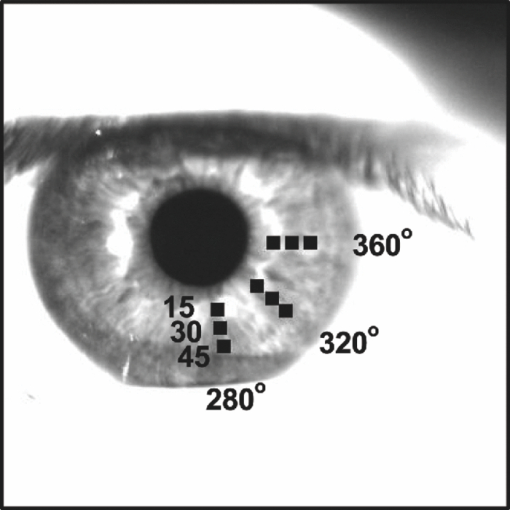 4.ProcedureTo ensure luminous stability, measurements started after the Xenon lamp were turned on for 20 min. Eye exposure to light at all wavelengths was in accordance with the norm ANSI Z136.1-2000 (American National Standard for Use of Lasers). For each individual iris, the exposure time at each wavelength was calculated before image acquisition using an optimization algorithm so that maximum pixel output was within 86 to 90% of the CCD saturation value.47, 48 The wavelength range between 410 and 710 nm was sampled at 20 nm intervals. Each hyperspectral set consisted of 16 images and the total acquisition time was approximately 11 s. Hyperspectral data were calibrated using white and black reference arrays (usually called the “bright field” and the “dark field cube,” respectively).28 The bright field cube was obtained from a flat pressed tablet of barium sulphate (Ba2SO4). The corresponding image cube was acquired in identical conditions as for the iris. The black image cube gives an estimation of the dark current noise49, 50 and was obtained in the same exact condition as in the white reference but with the light source off which prevented any light into the CCD camera.47, 48 To minimize spatial nonuniformities from the imaging system, for each iris only a square of 410×410 pixels was selected at the center of the image cube. The reflectance factor at wavelength λ and at pixel positions i and j R ij(λ) was calculated from the spectral radiance of the human iris captured by the CCD camera I ij(λ), and after correcting for the intensity of the dark field cube DC ij(λ) and normalizing for the bright field cube W ij(λ):47, 48 Eq. 1[TeX:] \documentclass[12pt]{minimal}\begin{document}\begin{equation} R_{ij} \left(\lambda \right) = \frac{{I_{ij} \left(\lambda \right) - DC_{ij} \left(\lambda \right)}}{{W_{ij} \left(\lambda \right) - DC_{ij} \left(\lambda \right)}}. \end{equation}\end{document}4.1.Colorimetric PerformanceThe colorimetric methods employed in the present study are standard and are available elsewhere.36, 51 At each pixel position, CIE XYZ tri-stimulus values were calculated from reflectance data using the CIE 1931 2-deg color matching functions, [TeX:] $\bar x\left(\lambda \right),\bar y\left(\lambda \right),\,\hbox{and}\,\,\bar z\left(\lambda \right)$ . The CIE (x,y) chromaticity coordinates were calculated to map the color gamut in the CIE chromaticity diagram.51 The XYZ tri-stimulus values were converted into the sRGB color space for display visualization and then to the CIELAB color space for further colorimetric analyses. The reference illuminant was the CIE standard illuminant D65 to simulate daylight conditions. The hyperspectral imaging system was validated using a telespectroradiometer (PR-650, Photo Research Inc., California). Spectral radiance data of the four ocular prosthesis and 10 human irises were also measured with the telespectroradiometer and then converted to the CIE 1976 (u ′, v ′) chromaticity diagram.51 The same tablet of barium sulphate acted as the white reference standard and the illuminant D65 was used. The mean reflectance values obtained with the hyperspectral imaging system were computed over similar areas excluding the specular reflection zone. Colorimetric differences between both measuring methods for the ocular prostheses and the real human iris were both around 0.01 CIE 1976 (u ′, v ′) units. The accuracy of the imaging device in both irises and prostheses was found to be around 0.005 CIE 1976 (u ′, v ′) units.45 4.2.Phase Correlation MethodOcular movements37 can produce translation misalignments in the set of images registered during hyperspectral acquisition. To compensate the effects of these movements, a method based on the Fourier transform and the two-dimensional (2D) phase cross-correlation method was used.38, 39, 40 The phase correlation method is a standard tool in image processing and is based on the translational property of the Fourier transform. If the raw intensities registered in the CCD camera at two different wavelengths, I i, j(λ1) and I i, j(λ2), are translated by an unknown spatial offset (i 0, j 0) ∈ {1, ..., 410}, then their Fourier transforms are related:53 Eq. 2[TeX:] \documentclass[12pt]{minimal}\begin{document}\begin{eqnarray} I_{i,j} ({\lambda _2 }) &=& I_{i - i_0,j - j_0 } ({\lambda _1 }) \nonumber\\ F_2 ({w_i,w_j }) &=& F_1 ({w_i,w_j })\exp [ { - 2\pi i({w_i i_0 + w_j j_0 })} ], \end{eqnarray}\end{document}Eq. 3[TeX:] \documentclass[12pt]{minimal}\begin{document}\begin{eqnarray} G({w_i,w_j }) &\equiv& \exp\, [ {2\pi i({w_i i_0 + w_j j_0 })} ]\nonumber\\ &=& \frac{{F_1 ({w_i,w_j })F_2 ^* ({w_i,w_j })}}{{| {F_1 ({w_i,w_j })F_2 ({w_i,w_j })} |}}, \end{eqnarray}\end{document}Eq. 4[TeX:] \documentclass[12pt]{minimal}\begin{document}\begin{equation} g\left({i,j} \right) = \delta \left({i - i_0,j - j_0 } \right). \end{equation}\end{document}5.Principal Component AnalysisIris reflectance spectra were considered in the vector space of square-integrable functions L 2 where the elements are 16-dimensional vectors (as much dimensions as sampling intervals). The goal of PCA is to establish a linear decomposition of reflectance spectra into a finite number of vectors in L 2 that are uncorrelated and maximizes the variance accounted for. The mean reflectance is subtracted from each reflectance sample and the covariance matrix is computed. Next, the eigenvectors are calculated from the covariance matrix by the singular value decomposition and ordered by their eigenvalues or explained variance. The dimensionality of the original reflectance data can be reduced by the n first eigenvectors (1 ⩽ n ⩽ 16). Each reflectance vector sample R m of the iris dataset is therefore a linear combination of the mean reflectance vector [TeX:] ${\bf \bar R}$ plus the eigenvectors X k:35, 54 Eq. 5[TeX:] \documentclass[12pt]{minimal}\begin{document}\begin{equation} {\bf R}_m \cong {\bf \bar R} + \alpha _{1m} {\bf X}_1 + \alpha _{2m} {\bf X}_2 +... + \alpha _{nm} {\bf X}_n. \end{equation}\end{document}Figure 2 represents an example of the iridal areas selected for PCA. Their spatial coordinates are referred to the center of the pupil and were classified in accordance with the radial distance from the center or the radial coordinate (in pixels) and the polar angle (in degrees). They are nine square areas of 11 by 11 pixels (0.27 by 0.27 mm) and are centered at (15, 280 deg), (15, 320 deg), (15, 360 deg), (30, 280 deg), (30, 320 deg), (30, 360 deg), (45, 280 deg), (45, 320 deg), and (45, 360 deg). 6.Results6.1.Spectral Reflectance Factor and Iris ColorimetryFigure 3 represents in a linear plot, the estimated reflectance factor [Eq. 1] using the hyperspectral imaging system. Figures 3a and 3b exemplify a dark pigmented (orange lines) and a light pigmented (cyan lines) real human iris, respectively. Reflectance spectra are raw data without the eye movement correction. For clarity, in both cases only a fraction of data is represented. Fig. 3Reflectance factor as a function of the wavelength measured with the hyperspectral system. Left column, examples of human irises in vivo. Right column, examples of artificial ocular prostheses. Reflectance data correspond to (a) dark (orange), (b) light pigmented iris (cyan), (c) dark (dark-red), and (d) light pigmented (dark-blue) ocular prosthesis. In all cases, only a fraction of data is represented. (Color online only.) 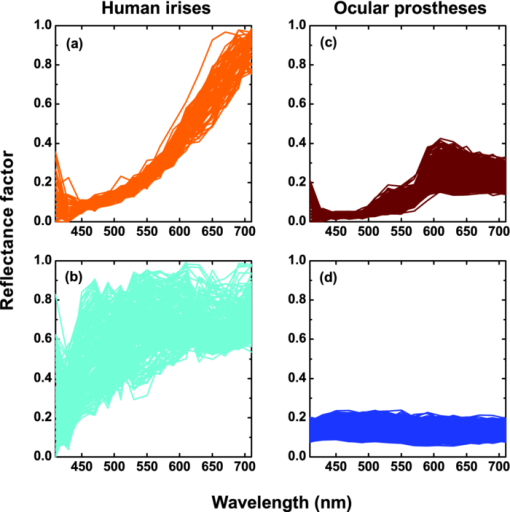 Each spectrum corresponds to the reflectance factor in a different CCD's pixel and thus in a different spatial position. The spectral profile of reflectance increases as the wavelength increases and being higher in the light pigmented iris except between 630 and 710 nm. The overall spectral shape agrees well with the data collected using conventional spectroradiometers26, 27, 34 and computational models.2, 3, 16 Figures 3c and 3d represent the reflectance spectra of two ocular prostheses. They can be considered as the counterpart of the two human irises [Figs. 3a and 3b], (dark prosthesis, dark-red lines and light prosthesis, and dark-blue lines). Their reflectance factor is, on average, lower and their spectral profile clearly differs from the real human irises. The variability in the reflectance factor of some dark pigmented irises and prostheses was, in some pixels, unexpectedly higher at 410 nm. These cases may exhibit some noise related artifacts due to the lower transmittance of the LCTF at short wavelengths28, 29 and the CCD noisy acquisition procedure.49, 50 This issue will be discussed later. Figure 4 represents the two human irises [Figs. 4a and 4b] and the two ocular prostheses [Figs. 4c and 4d], where data from Fig. 3 were selected. At each pixel position, the CIE XYZ tristimulus values were calculated from the reflectance spectra and then converted to the sRGB color space. In all cases, color appearance qualitatively agrees with direct visual inspection of the irises [brownish, Fig. 4a and bluish, Fig. 4b], and prostheses [brownish, Fig. 4c and bluish, Fig. 4d]. Spatial color distribution or texture effects in the portion unveiled by the eyelid and the eyelash in the human irises [Figs. 4a and 4b] differ from the artificial textures in the ocular prostheses [Figs. 4c and 4d]. Fig. 4The entire imaging areas in the sRGB color space (size 410× 410 pixels). Left column, examples of human irises in vivo. Right column, examples of ocular prostheses. At each pixel, color coordinates were generated from reflectance spectra as the CIE XYZ tri-stimulus values and then converted to the sRGB color space. (a) Dark (brownish), (b) light pigmented human iris (bluish), (c) dark (brownish), and (d) light pigmented (bluish) ocular prosthesis. (Color online only.) 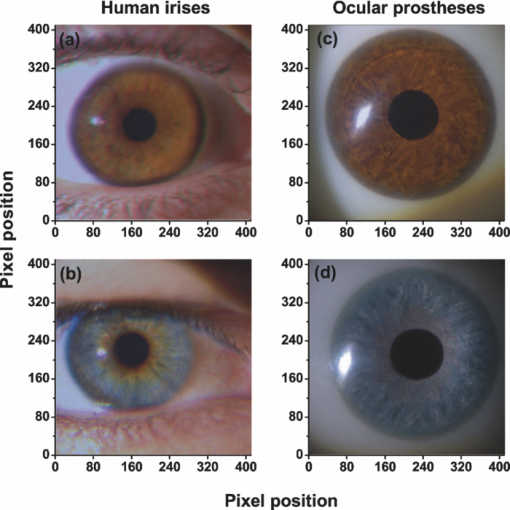 For illustration purposes, Fig. 5 compares the iris shown in Fig. 4a before [Fig. 5a] and after [Fig. 5b] the phase correlation method for the compensation of eye movements was applied. Figure 5b shows the enhancement of the image quality. Figure 6 represents the chromaticity coordinates in the CIE-1931 chromaticity diagram [Fig. 6a] and in the three-dimensional representation in the CIELAB color space [Fig. 6b]. The coordinates L*, a*, and b* denotes the lightness scale and the red-green and blue-yellow axis in the chromatic plane, respectively. Color coding was the same as in Fig. 3. In all cases, only a fraction of data points are shown. The results in the CIELAB color space agree with the data in Fig. 3. The bluish iris was, on average, lighter than the brownish iris, and both lighter than the ocular prostheses. Fig. 5The effect of the eye movement correction based on the phase correlation method. The example corresponds to a dark pigmented (brownish) human iris in vivo. At each pixel, color coordinates were generated from reflectance spectra as the CIE XYZ tri-stimulus values and then converted to the sRGB color space (size 410×410 pixels). (a) Before and (b) after the eye movement correction. 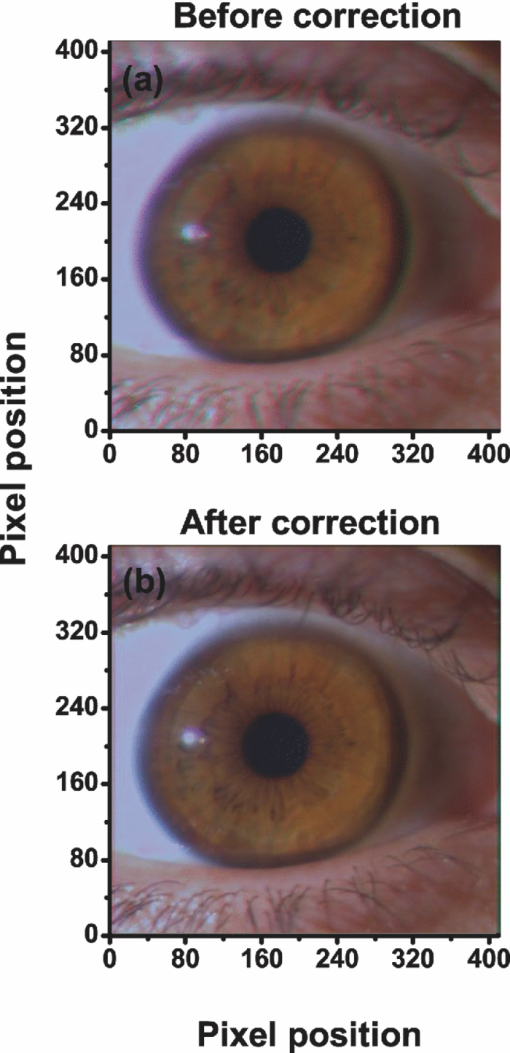 Fig. 6(a) CIE-1931 chromaticity diagram and (b) CIELAB color space. Data points show those coordinates of dark (orange) and light pigmented (cyan) human irises and a dark (dark-red) and a light pigmented (dark-blue) ocular prostheses. In all cases, only a fraction of data is represented. (Color online only.) 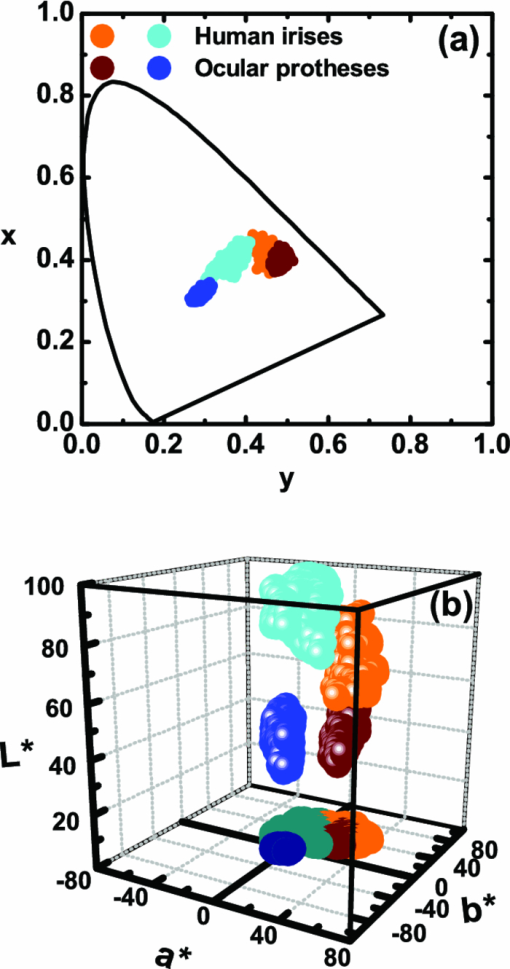 The results confirm that both human irises and ocular prostheses are better represented by an extended color gamut than one-point measurements recorded with standard spectroradiometers.8, 16, 26, 27, 34 They occupy a characteristic color map in the CIE chromaticity diagram [Fig. 6a] and a finite volume in the CIELAB color space [Fig. 6b].16, 34 6.2.Global BasisPCA of reflectance spectra was done taking the 9 selected areas in the 21 human irises together (Fig. 2). This provides a total of 22,869 reflectance estimations (raw data). The same analysis was repeated after the eye movement correction in the 21 human irises. PCA was also done taking the equivalent areas in the 4 ocular prostheses (4356 reflectance functions). Figure 7 presents the spectral content and provides the cumulative percentage of variance accounted for the first nine principal components. Black, gray, and red lines indicate raw data, corrected, and prostheses, respectively. Fig. 7Principal component analyses of human irises and ocular prostheses. Panels show the first nine basis function before (black lines) and after the eye movement correction (gray lines), and the corresponding for the ocular prostheses (red lines). In each case, the cumulative percentage (%) of variance accounted for is also presented. (Color online only.) 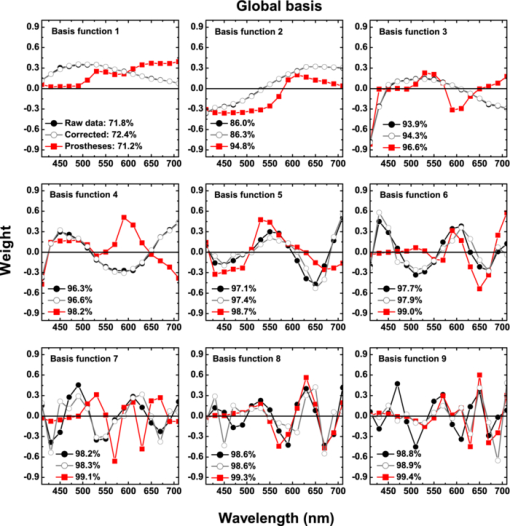 Although the first three principal components explain more than 93% in the real human irises, it was necessary to take seven to reach 99% of the total variance accounted for. A similar result was obtained after the eye movement correction except that the cumulative variance explained by each principal component was always marginally higher (Fig. 7). These results differ from those obtained with the ocular prostheses where only the first six principal components are good enough to explain 99% of variability. PCA was also repeated from 430 to 710 nm to avoid any noise related artifacts at 410 nm (i.e., a 15-dimensional dataset). The results were similar and nine and six principal components explained more than 99% of the total variance in both raw data, after the eye movement compensation, and in the ocular prostheses, respectively. The first principal component shows the weighted average direction in which reflectance spectra are distributed.55 In the human irises (71.8% of variance), it indicates an overall bluish-greenish that peaks around 490 nm. The subsequent principal components are corrections peaked at different wavelengths. This will be analyzed further in Sec. 5.3. Cross-correlation analyses of the principal components were done between raw data and corrected, and between raw data and ocular prostheses to compute their degree of similarity as a function of the lag or delay Δλ nm.53 If the magnitude of correlation is close to ±1 at some positive or negative lags, the principal components can be considered very similar but lag in the spectrum, i.e., the first function is a replica shifted to the right and to the left of the second function, respectively.55 In our case, the sign of both cross-correlation and lag values were ignored and were always positive because the principal components are bipolar.55 Figure 8 presents the maximum cross-correlation [Fig. 8a], at the corresponding lag value [Fig. 8b], for the first 10 principal components. Black and gray circles indicate the comparison between raw data versus corrected, and between raw data versus prostheses, respectively. Fig. 8(a) Maximum cross-correlation and (b) lag values for the first 10 principal components of human irises and prostheses. Black and gray circles indicate maximum cross-correlation between raw data and after the eye movement correction and between raw data and ocular prostheses, respectively. 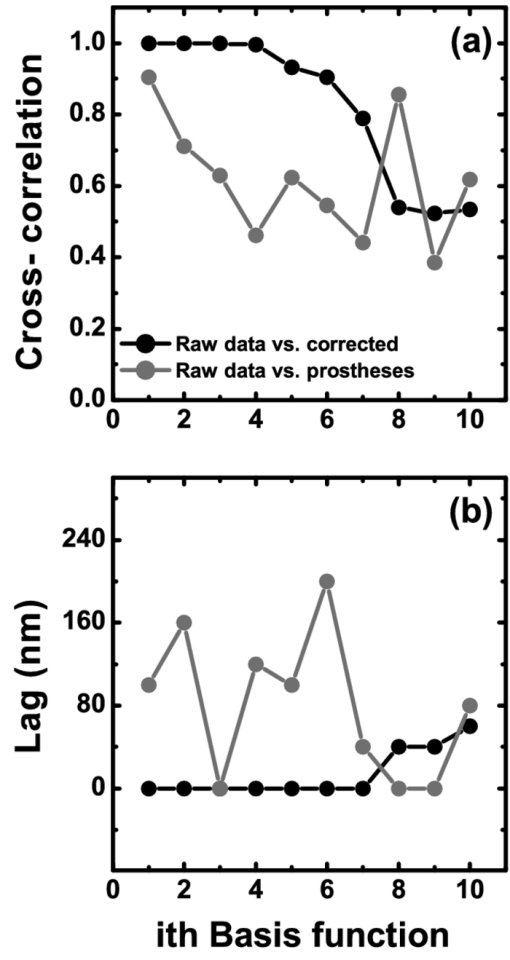 The principal components in the human irises clearly differ from ocular prostheses showing poor correlation in most cases. Only in the first and eighth principal components, maximum cross-correlation was acceptable (>0.8) [Fig. 8a], and lag different from zero [Fig. 8b]. The first four principal components of the human irises before and after the eye movement correction provide very good cross-correlation (>0.99) [Fig. 8a], at lag zero [Fig. 8b]. In the next two principal components, cross-correlation was good (>0.9) [Fig. 8a], also at lag zero [Fig. 8b]. We concluded that the first six principal components of the human irises are less influenced by noise from spontaneous eye movements and only the spectral content of the higher order ones were affected, especially between the eighth and tenth ones (< 0.8) [Fig. 8a], but they represent a small percentage of the total variance accounted for (Fig. 7). 6.3.Light Versus Dark Pigmented IrisWe have analyzed the principal components in the subspaces of two representative examples of human irises that are expected to contain different amounts of iridal melanin. For this purpose, PCA of reflectance spectra was done in the dark (brownish) and light pigmented (bluish) irises shown in Figs. 3a and 3b, Figs. 4a and 3b, and Figs. 5a and 5b, separately (in each case, 1089 reflectance functions). It was necessary for a total of 11 principal components in both irises to reach more than 99% of the total variance (raw data). After the eye movement correction, the results were the same for the bluish iris, but only a total of 10 principal components were necessary in the brownish iris to reach 99%. The number of principal components for other pairs of irises was similar. Figure 9 presents the spectral content of the first six principal components (around 95 to 97% of total variance). Cyan and orange lines denote light and dark pigmented irises, respectively. In both cases, solid and dashed lines indicate before (raw data) and after the eye movement correction. Fig. 9Example of principal component analyses of light (cyan lines) and dark pigmented human irises (orange lines). Panels show the first six basis functions before (solid lines) and after the eye movement correction (dashed lines). In each case, the cumulative percentage (%) of variance accounted for the first six principal components is also presented. (Color online only.) 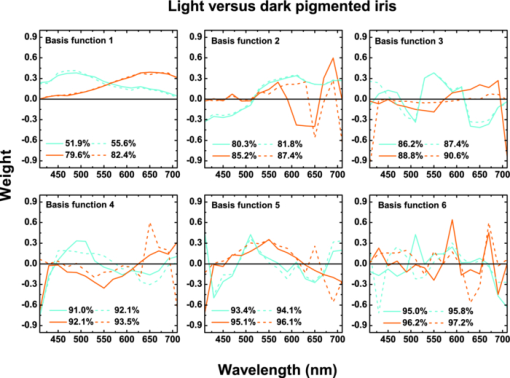 The first principal component is the major cause of color variations between both irises. It explains around 52 to 55% in the bluish and around 79 to 82% of total variance in the brownish iris. In the bluish iris, it peaks around 490 nm and its spectral shape is similar to the first principal component in the global basis (Fig. 7). On the contrary, the first principal component of the brownish iris shifts to longer wavelengths; it peaks around 670 to 650 nm and agrees well with the spectral properties of melanin.8, 9, 10 This behavior is also in agreement with the evolution of the reflectance spectra for different melanin concentrations simulated in computational models.2, 3, 16 We suggest that the first principal component is correlated with the melanin concentration, possibly in the iris stroma. 1, 2, 3, 8, 12, 13, 16 Figure 10 represents the maximum cross-correlation [Fig. 10a] and the corresponding lag value [Fig. 10b], between the first 10 principal components of the light and dark pigmented iris. Only the first principal components in both irises showed an acceptable cross-correlation value (0.89) [Fig. 10a], at lag 140 nm [Fig. 10b], which nearly match the separation between their maximum weights (180 to 160 nm, Fig. 9). The rest of principal components showed poor cross-correlation values (<0.8) [Fig. 10a]. The second the principal component of the bluish and brownish irises represent around 28 to 26% and 5% of variance, respectively and their maximum weight values were at 610 and 690 nm, respectively (Fig. 9). Maximum cross-correlation was only between 0.41 and 0.25 [Fig. 10a], but lags around 140 to 120 nm [Fig. 10b], which may suggest a common origin with the first principal component. The origin of the next four principal components is also unclear [Figs. 10a and 10b]. Their spectral shape show marked variations before and after the eye movement correction (Fig. 9) and cannot be attributed directly to the presence of specific pigments such as oxyhemoglobin at 542 and 577 nm or deoxyhemoglobin at 550 nm.2, 3, 56 6.4.Effect of the Iris StructureWe further examine the nature of the principal components in Figs. 7, 8, 9 taking into account the position of the selected iridal areas. PCA was performed with all the spectral reflectance factors in the 21 real human irises obtained at each fixed position of the radial coordinate (15, 30, and 45 pixels, Fig. 2), and also at each fixed position of the polar angle (280, 320, and 360 deg, Fig. 2), separately (in each case, 7623 reflectance functions). Figures 11, 12 present the spectral shapes and the cumulative percentage of variance accounted with the first six principal components (raw data, around 98% of total variance). Fig. 11Principal component analyses of human irises as a function of the radial coordinate. Panels show the first six basis functions before the eye movement correction (raw data). Red, green, and blue solid lines indicate the radial position at 15, 30, and 45 pixels, respectively. In each case, the cumulative percentage (%) of variance accounted for the first six principal components is also presented. (Color online only.) 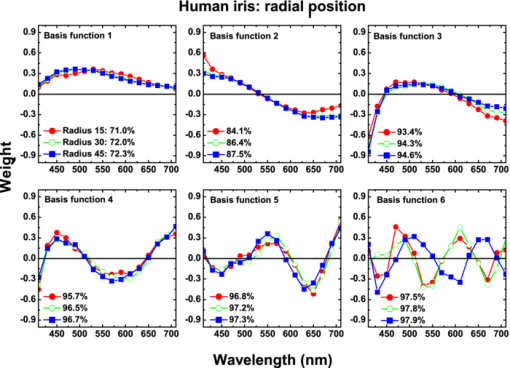 Fig. 12Principal component analyses of human irises as a function of the polar angle. Panels show the first six basis functions before the eye movement correction (raw data). Orange, dark-green, and dark-blue indicate the angular position at 280, 320, and 360 deg, respectively. In each case, the cumulative percentage (%) of variance accounted for the first six principal components is also presented. (Color online only.) 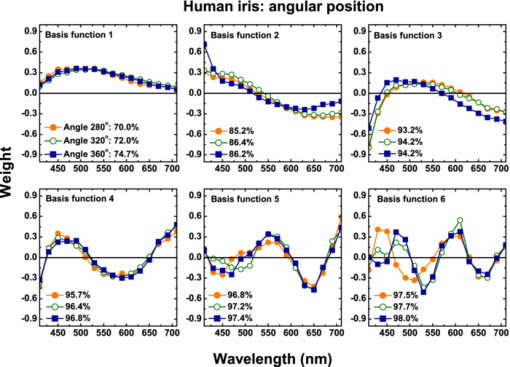 It was concluded that 9 or 10 principal components are necessary to reach 99% of total variance. The results were also confirmed after the eye movement correction. In all cases, the spectral shapes of the first five principal components were very similar to those presented in Fig. 7 and change only a little with the radial coordinate (Fig. 11) and the polar angle (Fig. 12). Figure 13 shows the maximum cross-correlation [Fig. 13a] between the radial coordinate at the distance from the pupil center of 15 pixels versus 45 pixels and between the polar angle at 280 deg versus 360 deg for first 10 principal components. Figure 13b indicates the corresponding lag values. Black and gray symbols indicate before and after the eye movement correction, respectively. As expected from Figs. 11, 12, maximum cross-correlation was acceptable for the first five principal components [Fig. 13a]. Only the second and third principal components at 280 and 360 deg had cross-correlation values slightly lower than 0.8 after the eye movement correction [Fig. 13a]. Maximum cross-correlation was at lag zero except for the first principal component between the radial coordinate at 15 and 45 pixels after the eye movement correction [lag 20 nm, Fig. 13b]. The higher-order ones were clearly affected by the position of the radial coordinate and the polar angle with values below 0.6 [Fig. 13a], and lag different from zero [Fig. 13b]. PCA was done over the reflectance spectra collected from the four ocular prostheses using the same spatial classification (in each case, 1452 reflectance functions). Figures 13c and 13d show the corresponding maximum cross-correlation and lag values, respectively, for the first 10 principal components. The first six principal components showed good cross-correlation values (>0.9) [Fig. 13c] at lag zero [Fig. 13d]. The effect of the spatial position in the ocular prostheses was only apparent after the seventh principal component [Figs. 13c and 13d], confirming the existence of differences between human irises and prostheses (Fig. 4). Fig. 13Maximum cross-correlation and the lag values for the first 10 principal components of human irises and prostheses as a function of the radial coordinate and the polar angle. (a) Black and gray solid circles indicate the maximum cross-correlation between the radial coordinate at 15 and 45 pixels before and after the eye movement correction, respectively. Black and gray open squares indicate the maximum cross-correlation between the polar angle at 280 and 360 deg before and after the eye movement correction, respectively. (b) The corresponding lag values (nm). (c) Solid circles indicate the maximum cross-correlation for the ocular prostheses between the radial coordinate at 15 and 45 pixels. Open squares indicate maximum cross-correlation between the polar angle at 280 and 360 deg pixels. (d) The corresponding lag values (nm). 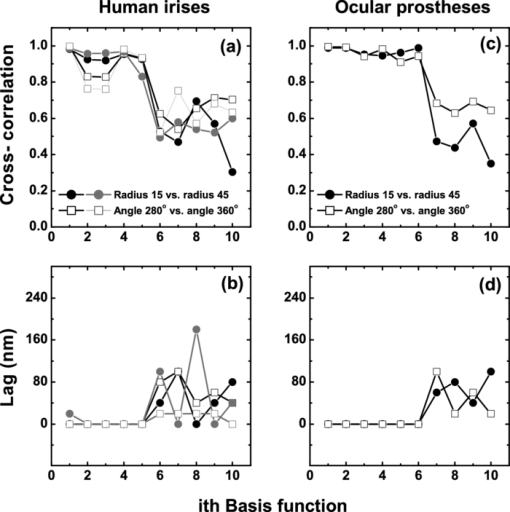 7.DiscussionIn this work we reported a hyperspectral imaging system to measure the reflectance spectra of real human irises in vivo and a detailed analysis of the spectral data obtained using PCA. The main result is that the spectral complexity of the human iris is considerably larger than expected: we found that between 9 and 11 principal components are necessary to explain more than 99% of the total variance of the iris reflectance spectra, whereas only six are enough to reach 99% in the ocular prostheses. This degree of complexity is also in agreement with previous studies in color research and the statistics of natural reflectance spectra.35 These results are independent on the influence of eye movements and noise-related artifacts at 410 nm. The phase correlation method38, 39, 40 was used to reduce noise effects from spontaneous eye movements during the hyperspectral acquisition. The efficiency of the algorithm was demonstrated in the enhancement of the image quality in the sRGB color space (Fig. 5), and in the PCA of reflectance spectra, where the principal components after the eye movement compensation have explained more variance in the global basis (Fig. 7), and in the local basis (Fig. 9). The first principal component explains most of the variance accounted for (Figs. 7, 9, 11, 12). When comparing light versus dark pigmented irises, it shifts from short to long wavelengths (Fig. 9), suggesting the presence of low and high melanin concentrations, respectively. This is in agreement with previous computational simulations2, 3, 16 and with physiological findings.1, 4, 7, 12 The next four principal components are relatively invariant to the eye movements, as well as the spatial position of the iridal areas. The next principal components ordered between the 6th and the 11th explain less variance and were affected by the radial and angular position in the iris [Figs. 11, 12, 13a, 13b]. It is suggested that the effect of the spatial position on PCA may be related with the iris texture. The effect of the iris curvature and deformation by pupil dilation and contraction during illumination are considered negligible. PCA was averaged over different curvatures (Figs. 11, 12) and the study of ocular prostheses lacks any effect of iris deformation [Figs. 13c and 13d]. The results also suggest that the iris texture is different from those in the ocular prostheses [Figs. 4, 13, 13d], and their spatial color distributions expand different areas in the color spaces analyzed (Fig. 6). We suggest that these spatial effects might be associated with the distribution of melanocytes and the thickness variations in the different iridal layers. The results clearly demonstrate the existence of characteristic color maps for different human irises in vivo (Fig. 6) and show high-dimensional hyperspectral data (Figs. 7, 9, 11, 12). These results imply that to discriminate different irises or small changes in the same iris, a good accuracy is necessary. Therefore, hyperspectral imaging, together with appropriate colorimetric tools, is required for accurate iris color classification. The use of RGB cameras or multispectral systems with low spectral resolution cannot resolve the spectral structure of the irises and, therefore, have limited applications in this area. The accuracy provided by hyperspectral imaging may also be important for ophthalmic diagnosis and early detection of specific ocular diseases such as cataracts, ocular melanoma, or age-related macular degeneration, and may be necessary to develop better models of the structure and function of the human iris. Finally, the optimal iris color imaging system will depend on the clinical application and spectral accuracy requirement. Although multispectral imaging systems have a limited number of filters, the right selection of a small number of spectral channels may permit the isolation and study of the dominant constituents in the iris, in the same way as in skin imaging.41, 42 Multispectral imaging systems with many filters and relatively narrow spectral bands, have also shown good accuracy for colorimetric reconstruction of iridal areas.27, 34 8.ConclusionHyperspectral imaging of the human iris in vivo is a robust technique that provides fast and valuable information about the iris reflectance spectra and their corresponding spatial color distribution. The method for obtaining hyperspectral images based on a liquid crystal tunable filter is standard and the new hyperspectral imaging device can be implemented for clinical purposes. The phase correlation method for the eye movement compensation is also fast and does not require any additional measurements. Its efficiency was demonstrated in the reconstruction of the hyperspectral images and in PCA. PCA of the estimated reflectance spectra concluded that between 9 and 11 principal components contribute to the iris color. The first principal component explains most of the variance and was associated with the melanin concentration in the iris stroma. Our methodologies based on PCA may be useful to better characterize the optical properties of melanin and to better understand the connection between iris color and ocular diseases. AcknowledgmentsWe wish to thank all of the observers that participated in the experiments. We also thank Dr. Ana M. Pinho (Department of Physics, University of Minho) and Adão Oculista Lda (Porto) for providing the ocular prostheses. This work was supported by the Fundação para a Ciência e Tecnologia (Grant No. PTDC/SAU-BEB/72220/2006) and by the Centre of Physics, University of Minho, Portugal. ReferencesD. N. Hu, J. D. Simon, and
T. Sarna,
“Role of ocular melanin in ophthalmic physiology and pathology,”
Photochem. Photobiol., 84
(3), 639
–644
(2008). https://doi.org/10.1111/j.1751-1097.2008.00316.x Google Scholar
G. V. G. Baranoski and
M. W. Y. Lam,
“Qualitative assessment of undetectable melanin distribution in lightly pigmented irides,”
J. Biomed. Opt., 12
(3), 030501
(2007). https://doi.org/10.1117/1.2747205 Google Scholar
M. W. Y. Lam and
G. V. G. Baranoski,
“A predictive light transport model for the human iris,”
Comput. Graph. Forum, 25
(3), 359
–368
(2006). https://doi.org/10.1111/j.1467-8659.2006.00955.x Google Scholar
A. R. Wielgus and
T. Sarna,
“Melanin in human irides of different color and age of donors,”
Pigment Cell Res., 18
(6), 454
–464
(2005). Google Scholar
G. Francois, P. Gautron, G. Breton, and
K. Bouatouch,
“Image-based modeling of the human eye,”
IEEE Trans. Vis. Comput. Graph., 15
(5), 815
–827
(2009). https://doi.org/10.1109/TVCG.2009.24 Google Scholar
T. Sarna,
“Properties and function of the ocular melanin - a photobiophysical view,”
J. Photochem. Photobiol. B-Biol., 12
(3), 215
–258
(1992). https://doi.org/10.1016/1011-1344(92)85027-R Google Scholar
G. Prota, D. N. Hu, M. R. Vincensi, S. A. McCormick, and
A. Napolitano,
“Characterization of melanins in human irides and cultured uveal melanocytes from eyes of different colors,”
Exp. Eye Res., 67
(3), 293
–299
(1998). https://doi.org/10.1006/exer.1998.0518 Google Scholar
E. V. Koblova, A. N. Bashkatov, E. A. Genina, V. V. Tuchin, and
V. V. Bakutkin,
“Estimation of melanin content in iris of human eye,”
Proc. SPIE, 5688 302
(2005). https://doi.org/10.1117/12.593651 Google Scholar
G. Zonios and
A. Dimou,
“Melanin optical properties provide evidence for chemical and structural disorder in vivo,”
Opt. Express, 16
(11), 8263
–8268
(2008). https://doi.org/10.1364/OE.16.008263 Google Scholar
D. N. Peles and
J. D. Simon,
“The ultraviolet absorption coefficient of melanosomes decreases with increasing pheomelanin content,”
J. Phys. Chem. B, 114
(29), 9677
–9683
(2010). https://doi.org/10.1021/jp102603b Google Scholar
D. N. Hu, R. Ritch, S. A. McCormick, and
K. Peltonhenrion,
“Isolation and cultivation of human iris pigment epithelium,”
Invest. Ophthalmol. Vis. Sci., 33
(8), 2443
–2453
(1992). Google Scholar
P. D. Imesch, C. D. Bindley, Z. Khademian, B. Ladd, R. Gangnon, D. M. Albert, and
I. H. L. Wallow,
“Melanocytes and iris color - Electron microscopic findings,”
Arch. Ophthalmol., 114
(4), 443
–447
(1996). Google Scholar
D. N. Peles, L. Hong, D. N. Hu, S. Ito, R. J. Nemanich, and
J. D. Simon,
“Human iridal stroma melanosomes of varying pheomelanin contents possess a common eumelanic uuter surface,”
J. Phys. Chem. B, 113
(32), 11346
–11351
(2009). https://doi.org/10.1021/jp904138n Google Scholar
C. L. Wilkerson, N. A. Syed, M. R. Fisher, N. L. Robinson, I. H. L. Wallow, and
D. M. Albert,
“Melanocytes and iris color - Light microscopic findings,”
Arch. Ophthalmol., 114
(4), 437
–442
(1996). Google Scholar
P. S. Bernstein, F. Khachik, L. S. Carvalho, G. J. Muir, D. Y. Zhao, and
N. B. Katz,
“Identification and quantitation of carotenoids and their metabolites in the tissues of the human eye,”
Exp. Eye Res., 72
(3), 215
–223
(2001). https://doi.org/10.1006/exer.2000.0954 Google Scholar
E. V. Koblova, A. N. Bashkatov, L. E. Dolotov, Y. P. Sinichkin, T. G. Kamenskikh, E. A. Genina, and
V. V. Tuchin,
“Monte Carlo modeling of eye iris color,”
Proc. SPIE, 6535 653521
(2007). https://doi.org/10.1117/12.741086 Google Scholar
S. Regan, H. E. Judge, E. S. Gragoudas, and
K. M. Egan,
“Iris color as a prognostic factor in ocular melanoma,”
Arch. Ophthalmol., 117
(6), 811
–814
(1999). Google Scholar
J. Rootman and
R. P. Gallagher,
“Color as a risk factor in iris melanoma,”
Am. J. Ophthalmol., 98
(5), 558
–561
(1984). Google Scholar
P. Mitchell, W. Smith, and
J. J. Wang,
“Iris color, skin sun sensitivity, and age-related maculopathy - The Blue Mountains Eye Study,”
Ophthalmol., 105
(8), 1359
–1363
(1998). https://doi.org/10.1016/S0161-6420(98)98013-7 Google Scholar
R. G. Cumming, P. Mitchell, and
R. Lim,
“Iris color and cataract: The blue mountains eye study,”
Am. J. Ophthalmol., 130
(2), 237
–238
(2000). https://doi.org/10.1016/S0002-9394(00)00479-7 Google Scholar
C. Younan, P. Mitchell, R. G. Cumming, E. Rochtchina, and
J. J. Wang,
“Iris color and incident cataract and cataract surgery: The Blue Mountains Eye Study,”
Am. J. Ophthalmol., 134
(2), 273
–274
(2002). https://doi.org/10.1016/S0002-9394(02)01496-4 Google Scholar
J. M. Seddon, C. R. Sahagian, R. J. Glynn, R. D. Sperduto, and
E. S. Gragoudas,
“Evaluation of an iris color classification system,”
Invest. Ophthalmol. Vis. Sci., 31
(8), 1592
–1598
(1990). Google Scholar
B. R. Hammond, K. Fuld, and
D. M. Snodderly,
“Iris color and macula pigment optical density,”
Exp. Eye Res., 62
(6), 293
–297
(1996). https://doi.org/10.1006/exer.1996.0035 Google Scholar
E. J. German, M. A. Hurst, D. Wood, and
J. Gilchrist,
“A novel system for the objective classification of iris color and its correlation with response to 1% tropicamide,”
Ophthalmic Physiol. Opt., 18
(2), 103
–110
(1998). https://doi.org/10.1016/S0275-5408(97)00070-7 Google Scholar
L. Franssen, E. C. Joris, and
T. J. T. P. van den Berg,
“Grading of iris color with an extended photographic reference set,”
J. Optom., 1 36
–40
(2008). https://doi.org/10.3921/joptom.2008.36 Google Scholar
M. Melgosa, M. J. Rivas, L. Gomez, and
E. Hita,
“Towards a colorimetric characterization of the human iris,”
Ophthalmic Physiol. Opt., 20
(3), 252
–260
(2000). https://doi.org/10.1016/S0275-5408(99)00058-7 Google Scholar
M. Vilaseca, R. Mercadal, J. Pujol, M. Arjona, M. de Lasarte, R. Huertas, M. Melgosa, and
F. H. Imai,
“Characterization of the human iris spectral reflectance with a multispectral imaging system,”
Appl. Opt., 47
(30), 5622
–5630
(2008). https://doi.org/10.1364/AO.47.005622 Google Scholar
N. Gat,
“Imaging spectroscopy using tunable filters: A review,”
Proc. SPIE, 4056 50
(2000). https://doi.org/10.1117/12.381686 Google Scholar
J. Y. Hardeberg, F. Schmitt, and
H. Brettel,
“Multispectral color image capture using a liquid crystal tunable filter,”
Opt. Eng., 41
(10), 2532
–2548
(2002). https://doi.org/10.1117/1.1503346 Google Scholar
A. Ross, R. Pasula, L. Hornak,
(2009) Google Scholar
J. H. Park and
M. G. Kang,
“Multispectral iris authentication system against counterfeit attack using gradient-based image fusion,”
Opt. Eng., 46
(11), 117003
(2007). https://doi.org/10.1117/1.2802367 Google Scholar
C. Boyce, A. Ross, M. Monaco, L. Hornak, and
X. Li,
“Multispectral iris analysis: a preliminary study,”
51
–59
(2006). Google Scholar
H. T. Ngo, R. W. Ives, J. R. Matey, J. Dormo, M. Rhoads, and
D. Choi,
“Design and implementation of a multispectral iris capture system,”
380
–384
(2009). Google Scholar
J. A. Herrera, M. Vilaseca, J. Düll, M. Arjona, E. Torrecilla, and
J. Pujol,
“Iris color and texture: a comparative analysis of real irises, ocular prostheses, and colored contact lenses,”
36 Google Scholar
J. Lehtonen, J. Parkkinen, T. Jaaskelainen, and
A. Kamshilin,
“Principal component and sampling analysis of color spectra,”
Opt. Rev., 16
(2), 81
–90
(2009). https://doi.org/10.1007/s10043-009-0015-6 Google Scholar
(
(1986) Google Scholar
R. W. Reading,
“Binocular vision,”
Foundations and Applications, Butterworth-Heinemann Ltd, Boston
(1983). Google Scholar
C. D. Kuglin and
D. C. Hines,
“The phase correlation image alignment method,”
163
–165
(1975). Google Scholar
B. S. Reddy and
B. N. Chatterji,
“An FFT-based technique for translation, rotation, and scale-invariant image registration,”
IEEE Trans. Image Process., 5
(8), 1266
–1271
(1996). https://doi.org/10.1109/83.506761 Google Scholar
J. Z. Huang, T. N. Tan, L. Ma, and
Y. H. Wang,
“Phase correlation based iris image registration model,”
J. Comput. Sci. Technol., 20
(3), 419
–425
(2005). https://doi.org/10.1007/s11390-005-0419-0 Google Scholar
J. M. Kainerstorfer, M. Ehler, F. Amyot, M. Hassan, S. G. Demos, V. Chernomordik, C. K. Hitzenberger, A. H. Gandjbakhche, and
J. D. Riley,
“Principal component model of multispectral data for near real-time skin chromophore mapping,”
J. Biomed. Opt., 15
(4), 046007
(2010). https://doi.org/10.1117/1.3463010 Google Scholar
N. Tsumura, H. Haneishi, and
Y. Miyake,
“Independent-component analysis of skin color image,”
J. Opt. Soc. Am. A., 16
(9), 2169
–2176
(1999). https://doi.org/10.1364/JOSAA.16.002169 Google Scholar
N. R. Subramanian, J. P. Kerekes, K. Kearney, and
N. Schad,
“Spectral imaging of near-surface oxygen saturation,”
Proc. SPIE, 6142 61423Y
(2006). https://doi.org/10.1117/12.655699 Google Scholar
K. Yokoyama, M. Watanabe, Y. Watanbe, and
E. Okada,
“Interpretation of principal components of the reflectance spectra obtained from multispectral images of exposed pig brain,”
J. Biomed. Opt., 10
(1), 011005
(2005). https://doi.org/10.1117/1.1854671 Google Scholar
L. Melo Pereira,
“Colorimetria da Iris por Imageologia multispectral,”
(2002). Google Scholar
S. Tsujimura, J. S. Wolffsohn, and
B. Gilmartin,
“Pupil response to color signals in cone-contrast space,”
Curr. Eye Res., 31
(5), 401
–408
(2006). https://doi.org/10.1080/02713680600681327 Google Scholar
D. H. Foster, K. Amano, S. M. C. Nascimento, and
M. J. Foster,
“Frequency of metamerism in natural scenes,”
J. Opt. Soc. Am. A., 23
(10), 2359
–2372
(2006). https://doi.org/10.1364/JOSAA.23.002359 Google Scholar
S. M. C. Nascimento, F. P. Ferreira, and
D. H. Foster,
“Statistics of spatial cone-excitation ratios in natural scenes,”
J. Opt. Soc. Am. A., 19
(8), 1484
–1490
(2002). https://doi.org/10.1364/JOSAA.19.001484 Google Scholar
G. E. Healey and
R. Kondepudy,
“Radiometric CCD camera calibration and noise estimation,”
IEEE Trans. Pattern Anal. Mach. Intell., 16 267
–276
(1994). https://doi.org/10.1109/34.276126 Google Scholar
R. A. Yotter and
D. M. Wilson,
“A review of photodetectors for sensing light-emitting reporters in biological systems,”
IEEE Sens. J., 3 288
–303
(2003). https://doi.org/10.1109/JSEN.2003.814651 Google Scholar
G. Wyszecki and
W. S. Stiles, Color Science, John Wiley & Sons, New York
(1982). Google Scholar
B. A. J. Clark and
L. G. Carney,
“Refractive index and reflectance of the anterior surface of the cornea,”
Am. J. Ophthalmol., 4
(1), 333
–343
(1971). Google Scholar
W. Press, S. Teukolsky, W. Vetterling, and
B. Flannery, Numerical Recipes in C, Cambridge University Press, Cambridge
(1992). Google Scholar
J. A. Worthey and
M. H. Brill,
“Principal components applied to modeling: Dealing with the mean vector,”
Color Res. Appl., 29
(4), 261
–266
(2004). https://doi.org/10.1002/col.20021 Google Scholar
D. Y. Tzeng and
R. S. Berns,
“A review of principal component analysis and its applications to color technology,”
Color Res. Appl., 30
(2), 84
–98
(2005). https://doi.org/10.1002/col.20086 Google Scholar
G. Zonios, J. Bykowski, and
N. Kollias,
“Skin melanin, hemoglobin, and light scattering properties can be quantitatively assessed in vivo using diffuse reflectance spectroscopy,”
J. Invest. Dermatol., 117
(6), 1452
–1457
(2001). https://doi.org/10.1046/j.0022-202x.2001.01577.x Google Scholar
|

