|
|
1.IntroductionConfocal mosaicing microscopy is developing into a promising tool for rapid imaging of large areas of freshly excised tissue 1, 2, 3, 4, 5, 6, 7, 8 without the need for standard embedding, processing, and sectioning that is necessary for conventional histology. In prior studies, images were acquired on Mohs surgical skin excisions of sizes up to 12 × 12 mm and stitched together into mosaics, to display tissue with 2× magnification. Mosaicing on a Mohs excision is possible in 5 to 9 min, whereas the preparation of Mohs frozen histology may require 20 to 45 min.1 In many other surgical settings (where such mosaicing may eventually find use), preparation of high quality histology may take from hours to days, which often results in insufficient sampling of tissue and incomplete removal of cancer.9, 10, 11 In recent blinded analysis studies, using acridine orange to fluorescently stain nuclei, basal cell carcinomas were detected in Mohs surgical skin excisions with sensitivity of 96.6% and specificity of 89.2%.6, 7 The sensitivity and specificity are promising. However, a possible barrier toward clinical acceptance is that confocal mosaics are based on a single mode of contrast and appear in grayscale (black and white), whereas conventional hematoxylin-and-eosin (H&E)-stained pathology is based on two (one for nuclei, another for cellular cytoplasm and dermis) and appears purple and pink. Subsequent to the initial sensitivity and specificity analysis, Gareau reported the feasibility of producing digitally stained confocal mosaics that are colored purple and pink and mimic the appearance of pathology.8 Nuclei are stained with acridine orange and imaged in exogenous fluorescence contrast whereas cellular cytoplasm and dermis is imaged in endogenous reflectance contrast. Thus, fluorescence mosaics may be digitally stained purple, to mimic the staining of nuclei with hematoxylin (H) in pathology, while reflectance mosaics may be digitally stained pink to mimic the staining of cellular cytoplasm and dermis with eosin (E). Overlaying fluorescence and reflectance mosaics produce the appearance of purple and pink, in a manner approaching that of pathology. Gareau's approach was to determine red, green, and blue (RGB) values based on sampling representative pixel values of hematoxylin-stained and eosin-stained areas in a digital image of an H&E-stained Mohs frozen section, and then apply a linear algorithm to convert the fluorescence and reflectance contrast in confocal mosaics to the absorbance-based contrast seen in pathology.8 Preliminary evaluation by our collaborating Mohs surgeon showed, not surprisingly, that the visual quality of the purple and pink in confocal mosaics depended on the staining with acridine orange. Purple-stained nuclei appeared saturated or “washed out” with unresolved detail and purple-stained artifacts were observed in the dermis due to pooling of unbound acridine orange. From these results, it was clear that optimization of the fluorescence staining procedure with acridine orange and a more rigorous approach for digital staining was necessary. Spectral classification of unstained and H&E-stained tissue sections from kidney were used in a study by Bautista, in order to create a linear mapping from spectral transmittance data of unstained tissue sections to digitally stained RGB tissue sections that mimicked an H&E slide.12 The same approach was later explored, to create a linear mapping directly from an H&E tissue section into a Masson's trichome stained tissue section, which highlights fibrosis and is important for diagnosing liver disease.13 The motivation was to provide proof of principle for digital staining to replace the standard histology procedures in hospitals that do not have the personnel or laboratory facilities to adequately provide stained tissue sections for pathologists. In our own study, however, rather than spectrally classifying unstained tissue sections, we classified H- and E-stained tissue sections to determine the RGB values of each stain. The resulting RGB components were then applied in Gareau's algorithm. Two results are presented in this paper. First, a range of concentrations of acridine orange was tested to optimize the staining, to eliminate pooling artifacts and to improve specificity in the grayscale mosaics and to improve the quality of digital staining. Second, a detailed characterization of the RGB components in H&E-stained pathology was performed by multispectral analysis, and the new components were tested in the digital staining algorithm and evaluated against Mohs pathology. 2.Methods2.1.Excised Tissue CollectionSkin specimens were collected from our Mohs surgery unit after completion of Mohs procedures, under Institutional Review Board approval (procurement of discarded human skin specimens for research purposes). The specimens were the tissue that remains and is normally discarded after frozen histology sections have been prepared for the Mohs surgeon. Thus, the research did not compromise any aspect of routine patient care. 2.2.Excised Tissue PreparationThe collected Mohs excisions were frozen in the standard medium (10.2% polyvinyl alcohol and 4.3% polyethylene glycol in 85.5% resin substrate, Tissue-tek) that is used to prepare histology sections. Each specimen was thawed, rinsed and placed in isotonic saline until ready for imaging. The specimen was then immersed in a solution of acridine orange (Fluka, 01660) of a given concentration and for a determined time, as further described in Sec. 2.4. The specimen was then rinsed in saline to remove any excess acridine orange. After the saline rinse, the specimens were mounted on a custom-designed tissue fixture, which was described in previous reports,3, 4, 5 and imaged with the confocal microscope. 2.3.Confocal InstrumentationThe instrumentation is extensively described in our previous reports on confocal mosaicing microscopy.3, 4, 5, 6, 7, 8 A bench top version of a commercial reflectance confocal microscope (Vivascope 2000, Lucid, Inc., Rochester, New York) was modified by incorporating an Argon-ion laser for illumination at 488 nm and two detection channels, one for fluorescence and the other for reflectance. Illumination of tissue was performed with low power of 0.3 to 1.0 mW, similar to levels used in previous studies. A custom-designed water immersion objective lens (Stableview, Lucid, Inc.) was used for imaging through 1 mm-thick glass slides. Thick glass slides are required to provide adequate stiffness when skin specimens are placed in our tissue fixture, to allow the tissue to be gently compressed and mounted for acquiring mosaics over large areas. Confocal images were acquired and stitched together into mosaics and displayed on a large monitor. Detailed descriptions of the instrumentation, tissue fixturing, and mosaicing algorithm are available in our previous reports.3, 4, 5 2.4.Acridine Orange Staining ProcedureEarlier work by Gareau 4, 6, 7 showed that 1.0 mM acridine orange immersion for 20 s was sufficient for staining nuclear detail in fluorescence. However, the high concentration caused nonspecific binding or “pooling” of acridine orange in the dermis and produced artifacts in the confocal images, resulting in the detection of false positives.6, 7 To minimize such artifacts, lower concentrations and a range of immersion times were explored. In addition to concentration of 1.0 mM, concentrations of 0.6 and 0.3 mM were tested. For each of the concentrations, three immersion times were studied (Table 1). The selected range of times for 1.0 mM acridine orange was based on previous studies with an immersion time of 20 s and an expectation that shorter times for the same concentration may reduce pooling artifacts. The range of selected times for 0.3 and 0.6 mM were based on preliminary observation while using lower concentrations. The shortest immersion times chosen for 0.3 and 0.6 mM were those that consistently provided staining and brightening of nuclei in images, based on initial visual evaluation. The longer immersion times at each concentration were tested at evenly spaced intervals. Ten images at each combination of concentration and time were acquired. Illumination power in the range 0.3 to 1.0 mW was chosen for minimal saturation of the detector and other artifacts. The variable range of illumination power does not affect the calculation of contrast ratio because the grayscale values in all pixels uniformly increase or decrease with change in illumination power. Table 1Concentration of acridine orange and immersion times that were tested.
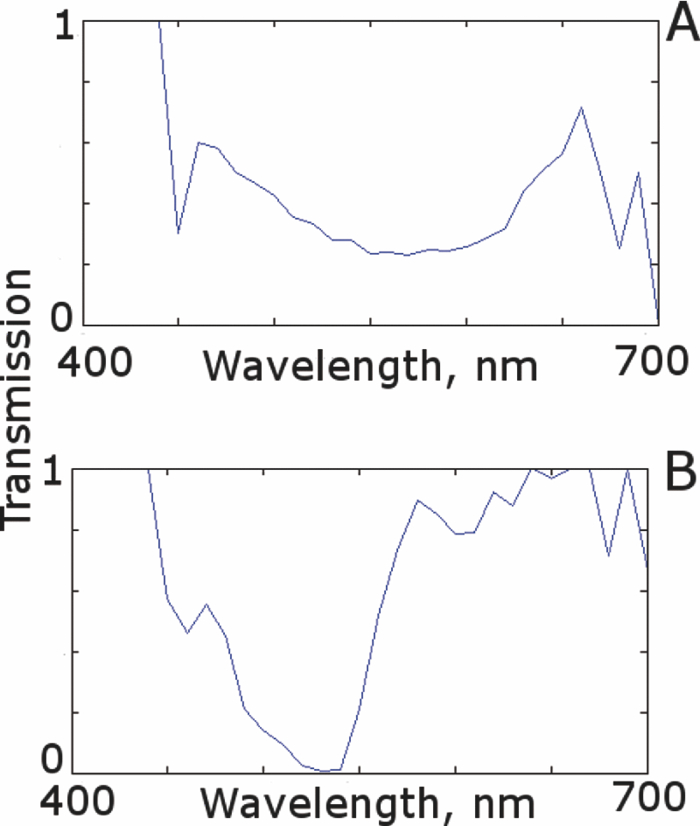
2.5.Analysis of Contrast DataBefore the fluorescence images were quantitatively analyzed, visual qualitative assessment was performed to exclude those with photobleaching or saturation artifacts from excess illumination time or excess laser power, respectively. Images with saturation were excluded to avoid underestimating upper values of contrast ratio. Once images were assessed, five images for each combination of concentration and time were then quantitatively analyzed. Thus, a total of 45 images were analyzed, using GIMP software (GIMP 2.6, http://www.gimp.org/). In each fluorescence image, the bright areas representing the highly-fluorescing acridine orange-stained nuclei and dark areas representing the nonfluorescing dermis and cytoplasm were traced. (Note that the dark areas occasionally showed small levels of artifactual fluorescence from residual unbound dye.) From the histogram of all pixels within such hand-traced bright and dark areas, the mean pixel values were calculated. The contrast ratios were then calculated as follows: Eq. 1[TeX:] \documentclass[12pt]{minimal}\begin{document}\begin{equation} C_I = \frac{{N_{{\rm mean}} }}{{D_{{\rm mean}} }}, \end{equation}\end{document}For each of the 45 images, the contrast ratio C I was determined. The average contrast ratio, [TeX:] $C_I^{avg}$ , for each concentration and time set was determined by averaging the C I values for the corresponding set of five images. In addition, an average contrast ratio, C C, for each concentration, was calculated for each of the 15 images collected across all immersion times. From this image analysis, the combination of concentration and time that provides the greatest contrast ratio should represent the optimal in which the maximum fluorescence from the nucleus and the least amount of from the dermis is simultaneously obtained. In order to ascertain whether the differences in contrast ratios for the different concentrations were statistically significant, a random-effects regression model was calculated. A random effect regression model is similar to a standard least squares regression model but with an added term to adjust for intra-cluster correlation. All statistical analyses were performed using Stata V.10.1, Stata Corporation, College Station, Texas. The first factor analyzed was the effect of a change in concentration with respect to the contrast ratios. The second factor analyzed was the change in contrast ratio with respect to changes in both concentration and time. 2.6.Multispectral Analysis of Hematoxylin- and Eosin-Stained TissueFrozen tissue sections were prepared by a Mohs technician according to the standard Mohs histology procedures. The two standard stains in Mohs histology are hematoxylin for nuclei, which appears purple, and eosin for cellular cytoplasm and dermal collagen, which appears pink. To accomplish this, sections were prepared with hematoxylin- and eosin-only stained tissue sections (i.e., in each case the corresponding counterstain was not applied). Classification of the spectral components of hematoxylin- and eosin-only stained sections was performed by using a liquid crystal tunable filter [VariSpec VIS/VISR, Cambridge Research & Instrumentation (CRI), Woburn, Massachusetts, www.cri-inc.com] attached to a light microscope (Nikon Eclipse) and illuminated with a tungsten lamp. The filter sampled from 400 to 700 nm with incremental steps of 10 nm. The bandwidth at each step is approximately 8 nm. This configuration allows the collection of a multispectral data cube with the dimensions of 31 wavelengths by 480 × 640 pixels. The multispectral image transmission data cube for each section was calculated as follows: Eq. 2[TeX:] \documentclass[12pt]{minimal}\begin{document}\begin{equation} T{(x,y,z)} = \frac{{{\rm I}_{{\rm tissue}}{({\rm x},{\rm y},\lambda)} - {\rm I}_{{\rm dark}}\,{({\rm x},{\rm y},\lambda)} }}{{{\rm I}_{{\rm white}\,}{({\rm x},{\rm y},\lambda)} - {\rm I}_{{\rm dark}\,}{({\rm x},{\rm y},\lambda)} }}, \end{equation}\end{document}The psychophysical perception of color is defined such that it accurately correlates to the normal human observer. The formulation of these correlation standards was performed through a series of color matching experiments by Wright and Guild.14, 15 These experiments led to the standardization, in 1931, of the Commission Internationale de l’Eclairage (CIE) standard RGB color matching functions [TeX:] $\bar r$ (λ), [TeX:] $\bar g$ (λ), [TeX:] $\bar b$ (λ), and XYZ color matching functions [TeX:] $\bar x$ (λ), [TeX:] $\bar y$ (λ), [TeX:] $\bar z$ (λ).16, 17 The XYZ color matching functions can be integrated using any spectral power distribution from light stimuli to calculate the XYZ tri-stimulus values through the following three integral functions: Eq. 3[TeX:] \documentclass[12pt]{minimal}\begin{document}\begin{equation} X(x,y) = k\int_0^\infty {T(x,y,\lambda)\bar x(\lambda)d\lambda,} \end{equation}\end{document}Eq. 4[TeX:] \documentclass[12pt]{minimal}\begin{document}\begin{equation} Y(x,y) = k\int_0^\infty {T(x,y,\lambda)\bar y(\lambda)d\lambda,} \end{equation}\end{document}Eq. 5[TeX:] \documentclass[12pt]{minimal}\begin{document}\begin{equation} Z(x,y) = k\int_0^\infty {T(x,y,\lambda)\bar z(\lambda)d\lambda,} \end{equation}\end{document}Eq. 6[TeX:] \documentclass[12pt]{minimal}\begin{document}\begin{eqnarray} \left[ {\begin{array}{*{20}c} X \\ Y \\ Z \\ \end{array}} \right] = 1/0.17697\left[ {\begin{array}{*{20}c} {0.49} &\quad {0.31} &\quad {0.20} \\ {0.17697} &\quad {0.8120} &\quad {0.01063} \\ {0.00} &\quad {0.01} &\quad {0.99} \\ \end{array}} \right]\left[ {\begin{array}{*{20}c} R \\ G \\ B \\ \end{array}} \right]\hspace*{-5pt}\nonumber\\ \end{eqnarray}\end{document}Eq. 7[TeX:] \documentclass[12pt]{minimal}\begin{document}\begin{eqnarray} \left[ {\begin{array}{*{20}c} R \\ G \\ B \\ \end{array}} \right] = \left[ {\begin{array}{*{20}c} {0.4185} &\quad { - 0.1587} &\quad { - 0.0828} \\ { - 0.0912} &\quad {0.2524} &\quad {0.0157} \\ {0.0009} &\quad { - 0.0025} &\quad {0.1786} \\ \end{array}} \right]\left[ {\begin{array}{*{20}c} X \\ Y \\ Z \\ \end{array}} \right]\nonumber\\ \end{eqnarray}\end{document}The transformation matrices in Eqs. 6, 7 were established from the transformation coefficients in the colorimetric equations that described the transformation from the r, g chromacity diagram, in which the Wright-Guild data was expressed, to the XYZ system unit-positive Maxwell triangle. This XYZ system unit-positive triangle can then be projected into the xy chromacity plane. Further derivation of these transformations can be seen in Fairman, 16 XYZ tri-stimulus values calculated from the integration of the transmission spectra from Eq. 2 were then transformed using Eq. 7 to obtain RGB images. All pixels that represented the hematoxylin-stained nuclei and eosin-stained dermis were manually chosen from the RGB images. The chosen pixels from each of the RGB images were then averaged to find singular RGB values for each respective stain. The single R, G, and B values determined for both eosin and hematoxylin were then applied to the confocal fluorescence and reflectance images, where the values for eosin are applied to the reflectance image and those for hematoxylin to the fluorescence image. The digital stain was applied to the fluorescence and reflectance mosaic pairs, using the algorithm as seen in Sec. 2.7, to establish digitally stained mosaics that mimics the colors of an H&E stained section. 2.7.Application of Digital StainThe previously reported linear model for application of the digital stains by Gareau8 was employed here. The application of the digital stain to the fluorescence and reflectance images is given by Eq. 8[TeX:] \documentclass[12pt]{minimal}\begin{document}\begin{equation} DS_{x,y,k} = 1 - F_{x,y} (1 - H_k) - R_{x,y} (1 - E_k), \end{equation}\end{document}2.8.Analysis of Digitally Stained MosaicsThe confocal mosaics produced by the digital staining algorithm were visually compared to the corresponding Mohs frozen histology sections for each successive mode of the imaging process. Four modes were compared: 1. grayscale fluorescence, 2. grayscale reflectance, 3. digitally stained using multispectrally measured RGB values, and 4. H&E frozen histology sections. The four modes were evaluated for representative features such as cellular and morphological characteristics, to assess the quality of each successive step in the process from capture of fluorescence and reflectance images to application of the digital stain. 3.Results3.1.Optimization of Acridine Orange Staining ProcedureFigure 1 shows the contrast ratios as a function of concentrations and immersion times. The C C contrast ratio results in Fig. 1a suggest that the optimum concentration is 0.6 mM, irrespective of immersion time, when compared to 0.3 and 1.0 mM. The [TeX:] $C_I^{avg}$ results in Fig. 1b suggest again that, for all immersion times, 0.6 mM acridine orange provides superior contrast, compared to concentrations of 0.3 and 1.0 mM. When immersion time is taken into consideration, however, there were no significant differences for any given concentration. This illustrates that, for each concentration, no particular immersion time provides superior contrast ratio. The p-values in Fig. 1a show that the variance in the median values of 0.6 to 0.3 mM and 1.0 mM is greater than the intra-cluster variance. Therefore, 0.6 mM provides a significantly higher contrast value. Figure 1b shows that the variance in the median values for each concentration with respect to immersion time is not greater than the intra-cluster variance for any specific immersion time. This illustrates, again, that, for each concentration, no particular immersion time provides a significantly superior contrast ratio. Fig. 1Contrast ratios for acridine orange-stained tissue at each concentration: (a) the average (C C) across all of the 15 images for all immersion times, and (b) the average ( [TeX:] $C_I^{avg}$ ) across the set of five images for each immersion time. In (a), statistical significances between each concentration irrespective of immersion time are displayed. In (b), statistical significances of differences in immersion times for each concentration are displayed.  3.2.Digital Staining Red, Green, and Blue ValuesThe spectra in Fig. 2, displayed for a single pixel location, are representative of hematoxylin-stained nuclei [Fig. 2a] and eosin-stained dermis [Fig. 2b]. These are typical of the calculated transmission spectra using Eq. 2, which were then transformed to the appropriate RGB values using Eqs. 3, 4, 5, 6, 7. The RGB images in Fig. 3 represent the resulting values from Eq. 7 as a cube of 480 × 640 pixels ×3 layers with each layer representing an R, G, and B color component. For each 480 × 640 layer, the pixels that represent cytoplasm or collagen of the eosin stained section and those that represent nuclei of hematoxylin stained section are each averaged to give a single value for each R, G, and B layer. The RGB values were determined to be (0.24, 0.21, 0.62) for hematoxylin and (0.88, 0.27, 0.66) for eosin. The variance from averaging R, G, and B pixel values was (0.0028, 0.0022, 0.0182) for hematoxylin and (0.0053, 0.0041, 0.0171) for eosin. These RGB values were applied to create digitally stained confocal mosaics. 3.3.Digitally Stained MosaicsCompared to the earlier mosaics in grayscale (black and white) contrast, digital staining begins to simulate the colored appearance of histology. However, some color differences in digitally stained confocal mosaics from those in histology are sometimes evident. The colors in the confocal mosaics sometimes tend to appear slightly more bluish and reddish whereas they are distinctly and more consistently purple and pink in histology. Review of digitally stained mosaics, in comparison with corresponding H&E stained Mohs frozen sections, demonstrates good correlation for the presence and appearance of structures that are routinely seen (Figs. 4, 5, 6, 7). Figure 4 shows confocal mosaics of a Mohs surgical excision of normal skin, and Fig. 5 shows the corresponding digitally stained mosaic and histology. Another example, also of a Mohs excision of normal skin, is shown in Figs. 6 and 7. The tissue was stained with 0.6 mM acridine orange for 20 s for the imaging in fluorescence. Nuclear detail is seen in the fluorescence mosaics [Figs. 4a and 6a], while cellular cytoplasm and dermis is seen in reflectance [Figs. 4b and 6b]. Observed structures include hair follicles, sebaceous and eccrine glands, and adipocytes, as labeled in the mosaics [Figs. 5a and 7a]. These features are similar to those seen in the histology for presence, location, and morphological appearance [Figs. 5b and 7b]. Fig. 4Confocal mosaics of a Mohs surgical excision of normal skin. (The corresponding digitally stained mosaic and histology is shown in Fig. 5.) Morphological features seen in (a) fluorescence mode include epidermis, sebaceous glands, eccrine glands, adipose tissue, and hair follicles. The tissue was stained with 0.6 mM acridine orange for 20 s. The corresponding mosaic in (b) reflectance mode highlights dermal collagen and cellular cytoplasm.  Fig. 5Digitally stained mosaic and histology for the excision of normal skin that was shown in Fig. 4. (a) The digitally stained mosaic shows the nuclear detail in purple and the cellular cytoplasm and dermis in pink. The appearance is similar to the (b) corresponding histology. Note that the details may not be easily seen in these small figures (but are readily appreciated when the mosaics are viewed on a large monitor with adequate pixilation). Details of these structures are shown in individual images in Fig. 8.  Fig. 6Another example of a confocal mosaic of a Mohs excision of normal skin in (a) fluorescence mode showing the epidermis, sebaceous glands, eccrine glands, adipose tissue, and hair follicles. The tissue was stained with 0.6 mM acridine orange for 20 s. The corresponding mosaic in (b) reflectance mode highlights cellular cytoplasm and dermal collagen. The corresponding digitally stained confocal mosaic and histology is shown in Fig. 7.  Fig. 7Digitally stained confocal mosaic and histology for the excision of normal skin that was shown in Fig. 6. (a) Digitally stained mosaic shows the nuclear detail in purple and the cellular cytoplasm and dermis in pink, which is similar to (b) the corresponding histology. 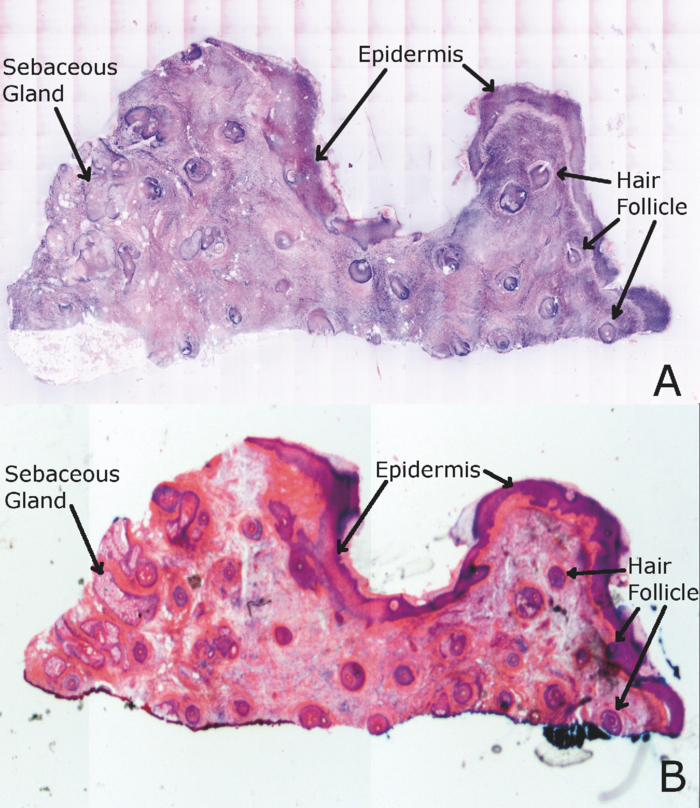 Fig. 8(a)–(e) Digitally stained features that are routinely seen in mosaics appear similar to those seen in (f)–(j) the corresponding histology. These features include (a) and (f) sebaceous gland; (b) and (g) eccrine gland; (c) and (h) hair follicle; (d) and (i) adipose tissue; and (e) and (j) epidermis along the periphery of the tissue specimen. For the fluorescence component of these images, the tissue was stained with 0.6 mM acridine orange for 20 s.  Note that some of the details may not be readily appreciated in the small figures in this paper, but are clearly seen in the mosaics when viewed on a large monitor with adequate pixilation. We show the details of these structures in individual digitally stained images (Fig. 8). Nuclear detail is seen in purple, while cellular cytoplasm and dermal collagen is seen in pink [Figs. 8a, 8b, 8c, 8d, 8e], similar to that seen in the corresponding histology [Figs. 8f, 8g, 8h, 8i, 8j]. The epidermis is clearly seen along half the periphery of the tissue specimen [Fig. 8e]. (Observation of the epidermis is a must for Mohs surgeons when examining pathology). The optimization of acridine orange staining appears to minimize pooling artifacts in the dermis. However, small amounts of residual acridine orange in the dermis may still remain after washing with saline. The resulting fluorescence contrast, instead of the endogenous reflectance, produces an artifact in the digital staining. As an example, solar elastosis in the dermis appeared purple/blue (instead of pink/red), resulting in an unclear boundary from healthy collagen in the dermis. As in earlier studies,3, 4, 5, 6, 7 the digitally stained mosaics appear consistently seamless with promising image quality, toward future clinical use. This assessment by our Mohs surgeon (co-author KN) demonstrates progress toward repeatability in the acridine orange staining procedure, tissue fixturing, and mosaicing algorithm. The mosaics display tissue with magnification of 2×, as is routinely necessary when examining Mohs pathology. By “zooming in,” submosaics can display tissue at higher magnifications of up to 30×. 4.Discussion4.1.Optimization of Contrast RatioOur contrast data (Fig. 1) confirms the belief that the previously employed concentration of 1.0 mM (acridine orange)6, 7, 8 is higher than necessary to produce optimal contrast in fluorescence confocal mosaics. The data quantitatively confirms our visual observations that, at high concentrations, dermal “pooling” of acridine orange reduces contrast in fluorescence mosaics and, subsequently, degrades appearance of the multispectral digitally stained mosaics. A lower concentration of 0.6 mM provides significantly higher contrast with enhanced visual appearance. For each concentration, the contrast for varying immersion times was not significantly different. This may be expected due to the fact that the diffusion of acridine orange into the superficial layers of tissue is on the order of milliseconds,4 which is rapid relative to the immersion times. Still, however, there appears to be a required minimum time for nuclear brightening, which increases with decrease in concentration. The required minimum time is likely related to that required for acridine orange to bind to the nuclei. In order to enhance digital staining of fluorescence-reflectance pairs of mosaics, taking these factors into consideration, it seems prudent to recommend 0.6 mM acridine orange for minimizing artifacts and maximizing contrast. There was no statistically significant difference between the respective immersion times at 0.6 mM. Consequently, it would be practical to select the shortest immersion time of 20 s when implementing in a clinical setting. Note, however, that small amounts of residual acridine orange in the dermis may still remain after washing with saline. The resulting fluorescence contrast, instead of the endogenous reflectance, may produce an artifact in the digital staining. 4.2.Multispectral Digital StainingThe spectrum for hematoxylin (Fig. 2) is due to hematein and the staining procedure for frozen sections. (Hematein is an oxidized derivative of hematoxylin.) Hematein appears blue when frozen sections are initially stained in aqueous alkaline solution and then acquire a reddish color when the excess stain in leached in alcoholic acidic solution. In the case of eosin, there are two versions: eosin B, which has a faint bluish color and eosin Y, which is mostly yellowish. The digital staining algorithm previously developed by Gareau8 was again employed in this study. The difference lies in the RGB values of hematoxylin and eosin that were used. The RGB values by Gareau8 were obtained as (0.30, 0.20, 1) for hematoxylin and (1, 0.55, 0.88) for eosin. These were simply the values of a randomly chosen single pixel in a digital image of a conventional Mohs histology frozen section. While this was a good first approximation, the RGB values that were determined in this study are based on the actual transmission spectra of H- and E-stained tissue sections. We characterized the spectra for each individual stain. The spectra allow for a more rigorous and accurate determination, using colorimetric analysis, of the RGB values for hematoxylin and eosin. Consequently, we observe improvements in quality in the digital staining (Fig. 9). The digitally stained mosaics with our approach [Fig. 9a] appear purple and pink with improved consistency and depth of color that offers a closer match to histology, and thus advances the original approach of Gareau8 [Fig. 9b]. Of course, rigorous verification in a larger study remains to be performed. Fig. 9Digitally stained mosaics with our approach show improvements in quality: the mosaics (a) and (b) appear purple and pink with improved consistency and depth of color that offers a closer match to histology and thus advances the original approach of Gareau (Ref. 8) (c) and (d). (However, rigorous verification in a larger study remains to be performed.)  However, despite the rigorous characterization, the colorimetric representation with our multispectral approach may still need further development. The two component nature of the reflectance and fluorescence confocal images with a linear algorithm may be insufficient to provide the complete spectrum of H&E staining. The colors in our mosaics sometimes tend to appear slightly bluish and reddish, whereas they are distinctly and more consistently purple and pink in histology. The colors in histology are likely due to the chemical mixing of the H and the E stains that must occur in the tissue. The effect of mixing is not fully modeled by the current algorithm. We are currently exploring spectral unmixing techniques to characterize hematoxylin and eosin from standard H&E sections, as well as developing a new model of digital staining to account for the physical mixing of hematoxylin and eosin. Since the colors of hematoxylin and eosin were separately analyzed, spectral analysis of an H&E stained section may be additionally necessary to determine whether a third component is needed for the staining algorithm. An alternative may be to capture spectra during the step-wise staining process that biochemically occurs with the successive hematoxylin and eosin stains. It appears that, during successive staining, residual dye from the previous stain mixes with the subsequent counterstain. Since the RGB images of hematoxylin and eosin (Fig. 3) are dark blue and bright pink, respectively, the residual mixing of these dyes must ultimately give the hematoxylin-stained nuclei their purple stain. As one possible approach to digitally simulate this effect, the fluorescence mosaics may be stained with RGB values of both the hematoxylin and eosin. This is currently being studied in more detail. In short, improvements in the digital staining algorithm to more accurately represent the physical staining process must be further explored. 4.3.Summary and ConclusionsIn summary, this study advances the understanding of digital staining of confocal mosaics on the basis of H- and E-stained tissue spectra. For fluorescence contrast with acridine orange, 0.6 mM is the optimum staining concentration with immersion time of 20 s. The concentration of 0.6 mM reduces pooling artifacts in the dermis, enhances contrast, and thus the quality of digitally stained images and mosaics. Our work in skin provides a platform to translate to similar application in other tissues. Digitally stained confocal mosaicing microscopy may allow rapid examination of freshly excised or biopsied tissue at-the-bedside and provide clinicians with an attractive adjunct to conventional pathology in diverse surgical and clinical settings. AcknowledgmentsThis research was supported in part by Grant Nos. R01EB002715 and R01EB012466 from NIBIB's Image Guided Interventions program (program director Dr. John Haller). We thank the following colleagues for their assistance: our Mohs histotechnicians, Marie Tudisco and Barbara Strippoli, for supplying discarded tissue and staining protocols, Bjorg Larson for acquiring mosaics, Steve Dusza for statistical analysis, Casey Marques at Northeastern University for help with the acquisition code for the spectral analysis, and William Fox and Zachary Eastman at Lucid Inc. for technical support. ReferencesM. Rajadhyaksha, G. Menaker, T. Flotte, P. J. Dwyer, and
S. Gonzalez,
“Confocal examinations of nonmelanoma cancers in thick skin excisions to potentially guide Mohs micrographic surgery without frozen histopathology,”
J. Invest. Dermatol., 117 1137
–1143
(2001). https://doi.org/10.1046/j.0022-202x.2001.01524.x Google Scholar
V. Chung, P. J. Dwyer, K. S. Nehal, M. Rajadhyaksha, G. M. Menaker, C. Charles, and
S. B. Jiang,
“Use of ex vivo confocal scanning laser microscopy during Mohs sugery for nonmelanoma skin cancers,”
Dermatol. Surg., 30
(12), 1470
–1478
(2004). https://doi.org/10.1111/j.1524-4725.2004.30505.x Google Scholar
Y. Patel, K. S. Nehal, I. Aranda, Y. Li, A. C. Halpern, and
M. Rajadhyaksha,
“Confocal reflectance mosaicing of basal cell carcinomas in Mohs surgical skin excisions,”
J. Biomed. Opt., 12
(3), 034027
(2007). https://doi.org/10.1117/1.2750294 Google Scholar
D. Gareau, Y. Li, B. Huang, Z. Eastman, K. S. Nehal, and
M. Rajadhyaksha,
“Confocal mosaicing microscopy in Mohs skin excisions: feasibility of rapid surgical pathology,”
J. Biomed. Opt., 13 054001
(2008). https://doi.org/10.1117/1.2981828 Google Scholar
D. Gareau, Y. G. Patel, I. Aranda, A. C. Halpern, K. S. Nehal, and
M. Rajadhyaksha,
“Confocal mosaicing microscopy in skin excisions: a demonstration of rapid surgical pathology,”
J. Microsc., 233
(1), 149
–159
(2009). https://doi.org/10.1111/j.1365-2818.2008.03105.x Google Scholar
D. Gareau, J. K. Karen, S. W. Dusza, M. Tudisco, and
K. S. Nehal,
“Sensitivity and specificity for detecting basal cell carcinomas in Mohs excisions with confocal fluorescence mosaicing microscopy,”
J. Biomed. Opt., 14
(3), 034012
(2009). https://doi.org/10.1117/1.3130331 Google Scholar
J. Karen, D. S. Gareau, M. Duzsa, M. Tudisco, M. Rajadhyaksha, and
K. S. Nehal,
“Detection of basal cell carcinomas in Mohs excisions with fluorescence confocal mosaicing microscopy,”
Br. J. Dermatol., 160 1242
–1250
(2009). https://doi.org/10.1111/j.1365-2133.2009.09141.x Google Scholar
D. Gareau,
“Feasibility of digitally stained multimodal confocal mosaics to simulate histopathology,”
J. Biomed. Opt., 14
(3), 034050
(2009). https://doi.org/10.1117/1.3149853 Google Scholar
R. Haque, R. Contreras, M. P. McNicoll, E. C. Eckberg, and
D. B. Petitti,
“Surgical margins and survival after head and neck cancer surgery,”
BMC Ear Nose Throat Disord., 6 2
(2006). https://doi.org/10.1186/1472-6815-6-2 Google Scholar
L. Jacobs,
“Positive margins: the challenge continues for breast surgeons,”
Ann. Surg. Oncol., 15 1271
–1272
(2008). https://doi.org/10.1245/s10434-007-9766-0 Google Scholar
E. S. Bovill, K. W. Cullen, and
W. J. Barrett,
“Clinical and histological findings in re-excision of incompletely excised cutaneous squamous cell carcinoma,”
Plastics Reconstructive Aesthetic Surg., 62 457
–461
(2009). https://doi.org/10.1016/j.bjps.2007.11.041 Google Scholar
P. Bautista, T. Abe, M. Yamaguchi, Y. Yagi, and
N. Ohyama,
“Digital staining of unstained pathological tissue samples through spectral transmittance classification,”
Opt. Rev., 12
(1), 7
–14
(2005). https://doi.org/10.1007/s10043-005-0007-0 Google Scholar
P. Bautista, T. Abe, M. Yamaguchi, Y. Yagi, and
N. Ohyama,
“Digital staining for multispectral images of pathological tissue specimens based on combined classification of spectral transmittance,”
Comput. Med. Imaging Graph., 29 649
–657
(2005). https://doi.org/10.1016/j.compmedimag.2005.09.003 Google Scholar
J. Guild,
“The colorimetric properties of the spectrum,”
Philos. Trans. R. Soc. London, Ser. A, 230 149
–187
(1932). https://doi.org/10.1098/rsta.1932.0005 Google Scholar
W. Wright,
“A re-determination of the trichromatic coefficients of the spectral colours,”
Trans. Opt. Soc., London, 30 141
–164
(1929). https://doi.org/10.1088/1475-4878/30/4/301 Google Scholar
H. Fairman, M. H. Brill, and
H. Hemmendinger,
“How the CIE 1931 color-matching functions were derived from Wright-Guild data,”
Color Res. Appl., 22
(1), 11
–23
(1997). https://doi.org/10.1002/(SICI)1520-6378(199702)22:1<11::AID-COL4>3.0.CO;2-7 Google Scholar
M. Brill,
“How the CIE 1931 color-matching functions were derived from Wright–Guild Data, ERRATUM,”
Color Res. Appl., 23
(4), 259
(1998). https://doi.org/10.1002/(SICI)1520-6378(199808)23:4<259::AID-COL18>3.0.CO;2-7 Google Scholar
C. A. DiMarzio, Optics for Engineers, Chemical Rubber, Boca Raton
(2010). Google Scholar
|