|
|
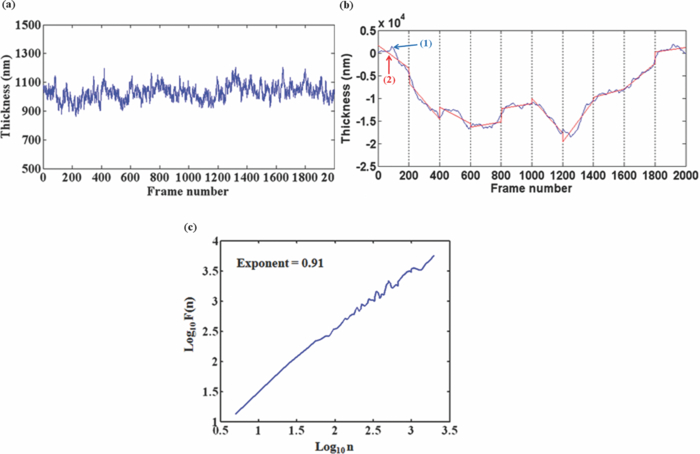
1.IntroductionRed blood cells (RBCs) exhibit dynamic and spontaneous vibratory motion in their cell surfaces, which is referred to as flickering. Frequency-domain or statistical analysis of flickering can be effectively used to determine the mechanical characteristics of a plasma membrane that consists of the lipid bilayer and the cytoskeletal protein (spectrin) network. RBC membrane fluctuations were first observed by Browicz in the late 19th century using light microscopy,1 and the quantitative analysis of RBC membrane fluctuations were first reported by Brochard and Lennon in 1975.2 The maximum height of the fluctuations was estimated to be in the order of 0.4 μm, which is about 5% of the average diameter (7.5 μm) of a normal RBC. Numerous studies have been made to explore the physiological properties of RBC membrane flickering because it provides important biological functions. 3, 4, 5, 6, 7, 8, 9, 10, 11 These studies showed that flickering is driven by thermal energy delivery6 and the metabolic energy associated with adenosine 5′-triphosphate (ATP).9 Recently, Park showed the effect of ATP on membrane fluctuations and the biconcave shape in RBCs under normal and ATP-depletion condition.12 Their results revealed that the depletion of ATP not only reduced membrane fluctuations, but also altered the biconcave shapes of RBCs. These mechanical characteristics determine the morphology and deformability of RBCs under normal and pathological conditions. New noncontact interferometeric techniques, called quantitative phase microscopy (QPM) based on interferometric techniques, such as Fourier phase microscopy,13 Hilbert phase microscopy,14 diffraction phase microscopy,15 and digital holographic microscopy16 have recently been proposed to provide the quantitative information about cell morphology. Several attempts have been made to analyze the characteristics of RBC using QPM. 10, 17, 18, 19, 20, 21, 22, 23 We previously proposed a QPM system with autofocusing and edge detection techniques for the accurate analysis of the volume of a living cell.24 This QPM with spatially modulated interferometry can provide the ability to retrieve the optical path length distribution on a whole cell surface from a single interferogram image. Our QPM system makes it possible to measure the morphologic and dynamic characteristics of transparent samples with subnanometer path length sensitivity within a millisecond time scale. In this paper, we have used our previously described QPM system24 to study thickness fluctuations of an RBC. The measured temporal function of thickness fluctuations were analyzed with the detrended fluctuation analysis (DFA) method25, 26 to study the connection between the correlation properties of the membrane flicking of an RBC and the morphological shape of an RBC: discocyte and spherocyte. DFA is a powerful method used to study the existence of long-range correlations in a temporal function. DFA has been recently used to analyze the dynamics of RBC flickering in young and old cells with phase contrast microscopy (PCM)27 and differential interference contrast microscopy.28 The previous studies have revealed that old cells showed relatively higher fractal scaling exponents than young cells. However, these conventional optical imaging techniques essentially provide qualitative information for a given sample since the relationship between the intensity and phase of the image field is generally nonlinear,29, 30 especially when the amplitude of vibration becomes close to the wavelength of the laser used in measurements. Since the amplitude of membrane flicking in an RBC becomes as large as 0.4 μm, it is very important to use a quantitative phase measurement technique which can measure the actual amplitude of a membrane vibration in an RBC. In this study, we have used QPM to measure the thickness fluctuations of RBCs. These thickness fluctuations represent RBC membrane flickering in a good approximation. In order to analyze the long-range correlation properties of the measured membrane vibration, we have used DFA. We have shown that the fractal scaling exponent α of the DFA method are quite different with each other for normal discocyte and abnormal spherocyte RBCs. It is demonstrated that the fractal scaling exponent α for the vibrational noise observed in the background fluid outside of a cell is very close to that of a typical white noise. We also present two-dimensional (2D) maps of fractal scaling exponent α over the whole cell surfaces, as well as background fluids for discocyte and spherocyte RBCs. 2.Materials and Methods2.1.Sample PreparationCells were prepared with the same procedures as previously described in Ref. 24. Fresh blood was collected from a mouse, and 10 μl of it was diluted by 50-fold with a low K+ solution (Mm: KCl 2, NaCl 145, HEPE-Na 10, MgCl2 0.15, and 1 mg/ml BSA). This low K+ solution works as a surrounding medium for the observation of an RBC in our QPM system. After being washed twice, normal discoid shape RBCs were adjusted to an appropriate experimental concentration, and then abnormal spherical shape RBCs were prepared by adding 1.3 mM Ca2+ and 1 mM of A23187 to the low-K+ solution. This dehydrates RBCs and acts as a Ca2+ ionophore to transport ions across the lipid bilayer of RBC membrane.31 All experiments were carried out at 25°C. 2.2.Quantitative Phase ImagingWe have used the QPM system proposed by Professor Michael Feld's group at MIT (Ref. 14) to obtain a time series of quantitative phase images of RBC membrane fluctuations. The QPM system has provided a quantitative phase image with subnanometer optical path length sensitivity. Quantitative 2D phase information ϕ(x,y) can be easily converted into a 2D thickness profile t(x,y) by using the equation: ϕ(x, y) = 2π/λ · Δn · t(x, y), where λ is the center wavelength of the light source, Δn is the difference in refractive index between the RBC and the surrounding medium. The basic configuration of the QPM is a combination between a Mach–Zehnder interferometer with a laser diode as an optical source and an optical microscope with a charge coupled device (CCD) as an image capturing device. The center wavelength of the laser diode is 633 nm, and the optical magnification of the imaging system is calibrated to be ∼110 for the imaging system. After using appropriate high frequency filtering and the Hilbert transformation of a recorded interferogram captured by the CCD, we can obtain a quantitative phase image ϕ(x,y). The 2D thickness profile t(x,y) of a cell is calculated from ϕ(x,y), where the refractive index difference Δn between the RBCs and the surrounding medium of our low K+ solution is estimated to be 0.06.19 2.3.Detrended Fluctuation AnalysisThe following DFA algorithm has been previously described by Peng 25 For a given data series of length N, we calculate a new integrated time series y(k) defined with where t(i) is the i'th value of the original thickness data, and t ave is the average value of the original thickness data. Next, the integrated time seriesy(k) is divided into nonoverlapping boxes of equal length n. In each box of length n, y(k) is fit with a straight line using a least-square fitting method, which represents the local trend in that box. The y-coordinate of the least fit line in each box is denoted by y n(k). Then, the integrated time series y(k) is detrended by subtracting the local trend y n(k) in each box of length n. For a given box size n, the root-mean-square (rms) fluctuation for this integrated and detrended time series is calculated by where N is the total length of the original data. This calculation is repeated over all box sizes to evaluate the relationship between F(n) and the box size n. The slope of a graph between log F(n) and log n represents a scaling exponent α, which characterizes the correlation properties of the original time series signal t(i). A power-law relation F(n) ∼ n α implies different correlation properties for different values of the fractal scaling exponent α. When 0 < α < 0.5, a time series signal is stationary or anticorrelated. A time series represents uncorrelated randomness or white noise if α ≅ 0.5. When 0.5 < α, a time series is considered to be correlated. A time series with α ≅ 1 corresponds to 1/f noise (pink noise). A time series of nonstationary or like random walk has α > 1. When α ≅ 1.5, the time series represents a random walk (Brownian motion).3.Results and Discussions3.1.DFA Computation of Time Series RBC Thickness Data Obtained by QPMIn order to analyze RBC membrane fluctuations, we have measured 2000 sequential thickness images of the normal discoid shape and the abnormal spherical shape RBCs. These cells were observed for 20 s with an imaging speed of 100 frames/s. Figure 1a shows a typical 2D thickness image for a normal discocyte RBC. The color bar on the right side of the figure indicates the thickness of a cell in micrometers. Figure 1b shows temporal thickness variations at two different points indicated by two arrows in the measured thickness image of Fig. 1a. The upper graph shows temporal fluctuations in thickness for a pixel on the membrane of the normal discocyte RBC, while the lower graph shows those for a pixel on the surrounding medium outside of the discocyte. The standard deviation (SD) of the amplitude of the membrane vibrations is 55.4 nm in the upper graph of Fig. 1b, while the SD of the background medium is shown to be 10.3 nm in the lower graph. These results indicate that the RBC membrane undulation amplitude is significantly larger than the background noise. Since we have a very small refractive index difference of 0.06 between the cell and the surrounding medium, 10.3 nm error in thickness t(x,y) corresponds to 0.62 nm (≈ λ/1000) measurement sensitivity in optical path length difference, which is defined as the product of refractive index difference Δn and thickness t(x,y). Fig. 1(a) Thickness image of normal RBCs with QPM with a colorbar in micrometers. (b) Temporal thickness variations for a pixel inside a cell (upper plot) and a pixel outside a cell (lower plot); two corresponding pixels are indicated by two arrows in (a).  Figure 2a shows the same flicking data at one point on the RBC membrane that is the same as the one shown in the upper plot of Fig. 1b. Since 100 images were taken in 1 s, we have 2000 data points for the whole observation period of 20 s. We have used this data for time series data t(i) defined in Eq. 1. Integrated time series y(k) were calculated using Eq. 1 and are plotted with the line (1) in Fig. 2b. The line (2) in Fig. 2b shows the representative example of local trend y n(k). The local trendy n(k) was fit in each box with a length of 200 data points using a least-square line fit. Finally, we obtained a double log graph between log F(n) and log n by repeating the calculation shown in Eq. 2. Figure 2c shows the plot of log F(n) with respect to log n. The fractal scaling exponent α for this vibrational motion is calculated to be 0.91 from this log-log plot. This suggests that the flicking motion of the membrane of a normal discocyte RBC has long-range correlation properties. These results were in good correspondence to the previous study of normal RBCs using PCM.27 3.2.Spatial Correlation Properties of Membrane Fluctuations in Discocyte and Spherocyte RBCsFrom a series of measured thickness images for an RBC, we obtained temporal thickness fluctuation data that were similar to the data shown in Fig. 2a for each pixel in the series of measured images. From the thickness fluctuation data, we have calculated the fractal scaling exponent α for each pixel with the procedures explained in Sec. 3.1. As a result, a 2D map of α was constructed for an RBC from a series of thickness images obtained by QPM. Figures 3a and 3d are thickness images of discocyte and spherocyte RBCs, respectively. Figure 3b shows a 2D map of α for the normal discocyte RBC, while Fig. 3e is the 2D map of α for the abnormal spherocyte RBC. Statistical properties of the calculated α for discocyte and spherocyte RBCs can be clearly seen by two histograms of α displayed in Figs. 3c and 3f. Calculated α values from the thickness data of the discocyte are distributed between 0.7 and 1.0, and their mean value is 0.87. These results reveal that there exists a long-range correlation in the membrane fluctuations of a normal discocyte RBC. As illustrated in Fig. 3e, calculated α values from the thickness data of the spherocyte are within a range from 0.85 to 1.2. Its mean value is 0.99. These results indicate that detrended fluctuation analysis for the dynamical properties of membrane flicking in the abnormal spherical shape RBC is more or like random walk. Fig. 3Averaged thickness images [(a) and (d)] and their corresponding fractal scaling exponent maps [(b) and (e)] for a discocyte and a spherocyte RBCs. Histogram of fractal scaling exponent α for the discocyte RBC, (c) and the spherocyte RBC (f).  We have also measured fractal scaling exponent α for the background medium in our system without a sample cell. Figure 4a shows a 2D map of fractal scaling exponent α for an area without a cell indicated by the white dashed square in Fig. 1a. Figure 4b is the histogram of α for the pixels within the 2D map of Fig. 4a. It shows that 96.5% of the measured α for the background fluid without a sample ranges from 0.46 to 0.54. The average value of the measured exponents for the background fluid is approximately 0.5, which demonstrates that the time series of background fluid fluctuation is an uncorrelated white noise. Fig. 4(a) Fractal scaling exponent map of background fluid outside a cell indicated with a white dashed box in Fig. 1a. (b) Histogram of fractal scaling exponent α for the background fluid. 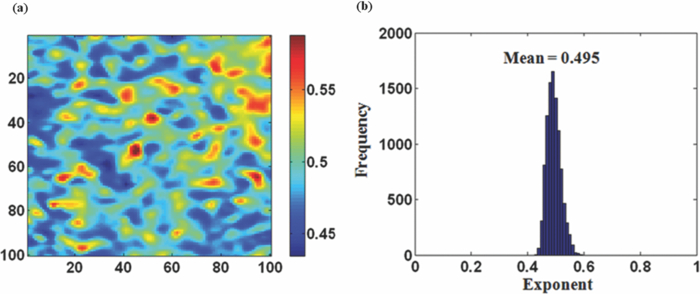 We have repeated the above measurement of the fractal scaling exponent α for 10 different normal discocyte RBCs and 10 abnormal spherocyte RBCs, as well as for the background fluids of these RBC samples. Figure 5 shows the box plot representation of measured fractal scaling exponent distributions for discocytes, spherocytes, and background fluids. The mean and the SD of measured exponent values (mean ± SD) for the discoctyes and the spherocytes are 0.86 ± 0.03 and 0.99 ± 0.02, respectively. And, those for the background fluids are 0.49 ± 0.03. This finding suggests a significant difference in the long-range scaling behavior between healthy (discocyte) and diseased states (spherocyte). It is well known that a vibrational motion is unbounded or like random walk when the fractal scaling exponent α is larger than 1.25 We have also calculated the percentage of pixels whose scaling exponent is larger than 1 (α > 1) for these two different types of RBCs. 2.3% of pixels in discocytes have their scaling exponent larger than 1, while 46.2% of pixels in spherocytes have α > 1. These results show that the fluctuation motion of the membrane of a spherocyte resembles an unbounded random walk more than that of a discocyte. Studies on membrane fluctuations in discocytes and spherocytes have been previously reported by using a QPM system. Popescu showed an increase in membrane tension as a discocyte was changed to a spherocyte.18 Also, Park recently reported significant increases in the shear and the bending moduli of the membrane associated with morphology changes in an RBC.32 In this paper, we have demonstrated a relationship between the temporal correlation properties of membrane fluctuation in an RBC and its morphological shape (discoid and spherical shapes). Variances in p-value between discocytes and spherocytes displayed in Fig. 5 clearly verify differences between these two morphological shapes of an RBC (p < 0.0001). Fig. 5Box plots for the distributions of the measured fractal scaling exponents of 10 normal discocyte RBCs, 10 abnormal spherocyte RBCs, and 10 background fluids (*** p < 0.0001, discocytes versus spherocytes).  Our findings are of great importance for the relationship between correlation properties of membrane fluctuations and metabolic driving force depending on ATP. We suggest a scenario that the increase of membrane rigidity in the absence of ATP forces to have a larger fractal scaling exponent α in spherocytes, which means correlation property with a random walk or a Brownian motion. We believe that these results of higher stiffness and a larger fractal scaling exponent are results of low deformability and ATP deletion in spherocytes due to A23187 induced calcium accumulation. Based on these findings, we could assume that the transition from discocytes to spherocytes causes the change of the mechanical characteristics and the correlation properties of RBC membrane fluctuations. In this regard, our study has verified that QPM can be effectively used with the detrended fluctuation analysis for a time series motion of absolute thickness undulations in an RBC by showing the significant difference in fractal scaling exponent between discocytes and spherocytes. 4.ConclusionsWe have used QPM for DFA as a tool to differentiate a discocyte RBC from a spherocyte RBC by monitoring the correlation properties of membrane fluctuations in a noninvasive manner. We have measured the absolute thickness variations for an RBC with interferometric QPM and analyzed its temporal correlation properties with DFA from the time series of thickness fluctuation data for each pixel in QPM images. Fractal scaling exponents for discocyte and spherocyte RBCs were calculated and analyzed over their whole cell surfaces. We have also validated the usage of DFA for the analysis of temporal membrane fluctuation in an RBC with our QPM system by measuring the fractal scaling exponents of the background fluid without a sample. Based on our preliminary results on the possibility of differentiating normal and abnormal RBCs with DFA for temporal thickness fluctuation data measured with our QPM technique, we believe that QPM, with the help of DFA, can be effectively applied to study the complex dynamic properties of the membrane vibration of an individual cell under various physiological conditions. AcknowledgmentsThis work was supported by Creative Research Initiatives (3D Nano Optical Imaging Systems Research Group) of MEST/KOSEF. ReferencesT. Browicz,
“Further observation of motion phenomena on red blood cells in pathological states,”
Zbl. Med. Wissen., 28 625
–627
(1890). Google Scholar
F. Brochard and
J. F. Lennon,
“Frequency spectrum of the flicker phenomenon in erythrocytes,”
J. Phys. (France), 36 1035
–1047
(1975). https://doi.org/10.1051/jphys:0197500360110103500 Google Scholar
A. Y. Krol, M. G. Grinfeldt, S. V. Levin, and
A. D. Smilgavichus,
“Local mechanical oscillations of the cell surface within the range 0.2-30Hz,”
Eur. Biophys. J., 19 93
–99
(1990). https://doi.org/10.1007/BF00185092 Google Scholar
S. Levin and
R. Korenstein,
“Membrane fluctuations in erythrocytes are linked to MgATP-dependent dynamic assembly of the membrane skeleton,”
Biophys. J., 60 733
–737
(1991). https://doi.org/10.1016/S0006-3495(91)82104-X Google Scholar
D. H. Boal, U. Seifert, and
A. Zilker,
“Dual network model for red blood cell membranes,”
Phys. Rev. Lett., 69 3405
–3408
(1992). https://doi.org/10.1103/PhysRevLett.69.3405 Google Scholar
S. Tuvia, S. Levin, and
R. Korenstein,
“Correlation between local cell membrane displacements and filterability of human red blood cells,”
FEBS Lett., 304 32
–36
(1992). https://doi.org/10.1016/0014-5793(92)80583-3 Google Scholar
H. Strey and
M. Peterson,
“Measurement of erythrocyte-membrane elasticity by flicker eigenmode decomposition,”
Biophys. J., 69 478
–488
(1995). https://doi.org/10.1016/S0006-3495(95)79921-0 Google Scholar
S. Tuvia, A. Almagor, A. Bitler, S. Levin, R. Korenstein, and
S. Yedgar,
“Cell membrane fluctuations are regulated by medium macroviscosity: evidence for a metabolic driving force,”
Proc. Natl. Acad. Sci. U.S.A., 94 5045
–5049
(1997). https://doi.org/10.1073/pnas.94.10.5045 Google Scholar
S. Tuvia, S. Levin, A. Bitler, and
R. Korenstein,
“Mechanical fluctuations of the membrane skeleton are dependent on F-actin ATPase in human erythrocytes,”
J. Cell Biol., 141 1551
–1561
(1998). https://doi.org/10.1083/jcb.141.7.1551 Google Scholar
G. Popescu, Y. Park, R. R. Dasari, K. Badizadegan, and
M. S. Feld,
“Coherence properties of red blood cell membrane motions,”
Phys. Rev. E, 76 031902
(2007). https://doi.org/10.1103/PhysRevE.76.031902 Google Scholar
J. Evans, W. Gratzer, N. Mohandas, K. Parker, and
J. Sleep,
“Fluctuation of the red blood cell membrane: relation to mechanical properties and lack of ATP dependence,”
Biophys. J., 94 4134
–4144
(2008). https://doi.org/10.1529/biophysj.107.117952 Google Scholar
Y. Park, C. A. Best, T. Auth, N. S. Gov, S. A. Safran, and
G. Popescu,
“Metabolic remodeling of the human red blood cell membrane,”
Proc. Natl. Acad. Sci. U.S.A., 107 1289
–1294
(2010). https://doi.org/10.1073/pnas.0910785107 Google Scholar
G. Popescu, L. P. Deflores, J. C. Vaughan, K. Badizadegan, H. Iwai, R. R. Dasari, and
M. S. Feld,
“Fourier phase microscopy for investigation of biological structures and dynamics,”
Opt. Lett., 29 2503
–2505
(2004). https://doi.org/10.1364/OL.29.002503 Google Scholar
T. Ikeda, G. Popescu, R. R. Dasari, and
M. S. Feld,
“Hilbert phase microscopy for investigating fast dynamics in transparent systems,”
Opt. Lett., 30 1165
–1167
(2005). https://doi.org/10.1364/OL.30.001165 Google Scholar
G. Popescu, T. Ikeda, R. R. Dasari, and
M. S. Feld,
“Diffraction phase microscopy for quantifying cell structure and dynamics,”
Opt. Lett., 31 775
–777
(2006). https://doi.org/10.1364/OL.31.000775 Google Scholar
P. Marquet, B. Rappaz, P. J. Magistretti, E. Cuche, Y. Emery, T. Colomb, and
C. Depeursinge,
“Digital holographic microscopy: a noninvasive contrast imaging technique allowing quantitative visualization of living cells with subwavelength axial accuracy,”
Opt. Lett., 30 468
–470
(2005). https://doi.org/10.1364/OL.30.000468 Google Scholar
G. Popescu, K. Badizadegan, R. R. Dasari, and
M. S. Feld,
“Observation of dynamic subdomains in red blood cells,”
J. Biomed. Opt., 11 040503
(2006). https://doi.org/10.1117/1.2221867 Google Scholar
G. Popescu, T. Ikeda, K. Goda, C. A. Best-Popescu, M. Laposata, S. Manley, R. R. Dasari, K. Badizadegan, and
M. S. Feld,
“Optical measurement of cell membrane tension,”
Phys. Rev. Lett., 97 218101
–218101
(2006). https://doi.org/10.1103/PhysRevLett.97.218101 Google Scholar
Y. Park, M. Diez-Silva, G. Popescu, G. Lykotrafitis, W. Choi, and
M. S. Feld,
“Refractive index maps and membrane dynamics of human red blood cells parasitized by Plasmodium falciparum,”
Proc. Natl. Acad. Sci. U.S.A., 105 13730
–13735
(2008). https://doi.org/10.1073/pnas.0806100105 Google Scholar
B. Rappaz, A. Barbul, Y. Emery, R. Korenstein, C. Depeursinge, P. J. Magistretti, and
P. Marquet,
“Comparative study of human erythrocytes by digital holographic microscopy, confocal microscopy, and impedance volume analyzer,”
Cytometry, Part A, 73A 895
–903
(2008). https://doi.org/10.1002/cyto.a.20605 Google Scholar
A. R. Brazhe, N. A. Brazhe, G. V. Maksimov, P. S. Ignatyev, A. B. Rubin, E. Mosekilde, and
O. V. Sosnovtseva,
“Phase-modulation laser interference microscopy: an advance in cell imaging and dynamics study,”
J. Biomed. Opt., 13 034004
(2008). https://doi.org/10.1117/1.2937213 Google Scholar
A. I. Yusipovich, E. Y. Parshina, N. Y. Brysgalova, A. R. Brazhe, N. A. Brazhe, A. G. Lomakin, G. G. Levin, and
G. V. Maksimov,
“Laser interference microscopy in erythrocyte study,”
J. Appl. Phys., 105 102037
(2009). https://doi.org/10.1063/1.3116609 Google Scholar
N. T. Shaked, L. L. Satterwhite, M. J. Telen, G. A. Truskey, and
A. Wax,
“Quantitative microscopy and nanoscopy of sickle red blood cells performed by wide field digital interferometry,”
J. Biomed. Opt., 16 030506
(2011). https://doi.org/10.1117/1.3556717 Google Scholar
S. Lee, J. Y. Lee, W. Yang, and
D. Y. Kim,
“Autofocusing and edge detection schemes in cell volume measurements with quantitative phase microscopy,”
Opt. Express, 17 6476
–6486
(2009). https://doi.org/10.1364/OE.17.006476 Google Scholar
C. K. Peng, S. Havlin, M. Simons, H. E. Stanley, and
A. L. Goldberger,
“Mosaic organization of DNA nucleotides,”
Phys. Rev. E, 49 1691
–1695
(1994). https://doi.org/10.1103/PhysRevE.49.1685 Google Scholar
C. K. Peng, S. V. Buldyrev, S. Havlin, M. Simons, H. E. Stanley, and
A. L. Goldberger,
“Quantification of scaling exponents and crossover phenomena in nonstationary heartbeat time series,”
Chaos, 5 82
–87
(1995). https://doi.org/10.1063/1.166141 Google Scholar
M. Costa, I. Ghiran, C. K. Peng, A. Nicholson-Weller, and
A. L. Goldberger,
“Complex dynamics of human red blood cell flickering: alterations with in vivo aging,”
Phys. Rev. E, 78 020901
(2008). https://doi.org/10.1103/PhysRevE.78.020901 Google Scholar
D. Szekely, T. W. Yau, and
P. W. Kuchel,
“Human erythrocyte flickering: temperature, ATP concentration, water transport, and cell aging, plus a computer simulation,”
Eur. Biophys. J., 38 923
–939
(2009). https://doi.org/10.1007/s00249-009-0473-6 Google Scholar
F. Zernike,
“How I discovered phase contrast,”
Science, 121 345
–349
(1955). https://doi.org/10.1126/science.121.3141.345 Google Scholar
F. H. Smith,
“Microscopic interferometry,”
Research (London), 8 385
–395
(1955). Google Scholar
T. Tiffert, N. Daw, D. Perdomo, and
V. L. Lew,
“A fast and simple screening test to search for specific inhibitors of the plasma membrane calcium pump,”
J. Lab. Clin. Med., 137 199
–207
(2001). https://doi.org/10.1067/mlc.2001.113112 Google Scholar
Y. Park, C. A. Best-Popescu, K. Badizadegan, R. R. Dasari, M. S. Feld, T. Kuriabova, M. L. Henle, A. J. Levine, and
G. Popescu,
“Measurement of red blood cell mechanics during morphological changes,”
Proc. Natl. Acad. Sci. U.S.A., 103 6731
–6736
(2010). https://doi.org/10.1073/pnas.0909533107 Google Scholar
|