
|
|
1.IntroductionNowadays, cardiovascular diseases are those of the deadliest killers, claiming 17.1 million lives a year worldwide. The myocardial ischemic disease is one of the major cardiovascular diseases and resulted in a huge clinical problem. At present, surgical revascularization after myocardial ischemia is still one of the routine treatments for myocardial ischemia. Therefore, the precise determination to the extent and scope of myocardial tissue damage is in need after cardiac arrest and during and after operation. Many studies have been assessed that creatine kinase-MB (CK-MB) could be used for diagnosing myocardial damage in patients with acute myocardial infarction, and estimated from the infarct size and area under a mathematical model of CK-MB.1 However, this technique cannot be used to measure the regional variations of ischemia, because the ischemic parameter CK-MB only indicates the global change of the myocardium. There are several noninvasive imaging techniques, including positron emission tomography2 and contrast magnetic resonance imaging,3 which have currently been used to evaluate myocardial ischemia-reperfusion injury. But these examinations are expensive and time-consuming. They do not provide real-time images. Considerable attention has been devoted to optical spectroscopy for detecting alterations in myocardial oxygenation and identifying ischemia.4, 5 However, this method does not directly assess myocardial blood volume. Furthermore, its penetration depth is only approximately 2 mm into the myocardial epicardium tissue which does not cover the whole myocardial layer. The photoacoustic (PA) imaging systems offer three specific advantages: high optical contrast between different tissues, high resolution, and depth scalability of ultrasonic imaging.6 We may classify the PA imaging systems into two forms. One is the direct form using a focused ultrasonic transducer, and the other is the reconstruction form employing an unfocused transducer.7 Considerable attention has been devoted to the PA imaging for monitoring changes in blood volume, oxygenation, and flow in local region.8, 9 In addition, the PA signal strength is actually proportional to the product of local fluence rate and absorption coefficient of tissue. Due to the high absorption coefficients of blood, the PA signal strength is approximately proportional to the local optical absorption coefficient of tissue if a ratio of the irradiated diameter to the sample's thickness is much more than 10.10 In this study, we use the PA imaging based on a focused transducer to assess the acute myocardial ischemia. The myocardium is blood rich and the blood has a higher absorption coefficient at 532 nm than that of cardiac muscle. And the PA signal is proportional to the optical absorption coefficient of blood. The absorption coefficient of blood plays a dominant role at the wavelength for PA imaging.11 The interruption of coronary artery blood supply in acute myocardial ischemia causes differences in fractional blood volume of the myocardial layer. The myocardium would produce the corresponding intensity of photoacoustic signals. An acute deterioration of coronary blood supply can result in a release of ischemic metabolites. These metabolites are detectable in the coronary sinus blood, often prior to the appearance of substances representing cellular injury such as CK-MB in the peripheral blood. In this work, we demonstrate experimentally the correlation between the extent of myocardial ischemia and the photoacoustic intensity using the photoacoustic imaging based on a focused transducer since the PA intensity can identify changes in fractional blood volume of myocardium. 2.Materials and Methods2.1.SamplesBecause the myocardial ultrastructure of a rat is similar to the characteristics of human coronary circulation characteristics,12 the rat is one of the ideal animal models for the study of human myocardial ischemic-reperfusion injury. Sprague-Dawley (SD) rats (Shanghai SLAC Laboratory Animal Co. Ltd.), weighing around 250 g, were anesthetized using 3 to 4 ml/Kg 10% Chloral hydrate. The acute myocardial ischemia model was replicated by ligating the left anterior descending coronary artery (LAD) of SD rats after open heart surgeries. Then, the rats were opened neck median skin, and blunt separated from muscles to expose the tracheal. Tracheal intubation was performed by mechanical ventilation with a ventilator. Finally, the rat remained under anesthesia and was submerged into the imaging tank, where the water was kept near body temperature (26 C). After LAD occlusion for 10, 40, 90, and 120 min, the photoacoustic images of myocardium were obtained by irradiating the areas of the ventricular anterior wall [as shown in Fig. 1c] using a laser light. At the same time, the blood was obtained by cardiac puncture. Four milliliters of blood were collected and allowed to clot at room temperature; the serum was separated by centrifugation for 10 min at high speed (1500 rpm). The total CK-MB in serum was determined at 26 °C with a CK-MB assay kit (Rocke, Switzerland). Ten rats were studied. The study was performed in accordance with the guidelines of the National Institutes of Health Guide for the Care and Use of Laboratory Animals (NIH Pub. No. 85-23, revised 1996), and was approved by the Animal Care and Use Committee of the Fujian Medical University. 2.2.Wavelet AnalysisThe continuous wavelet transform (CWT) characterizes a signal by means of an amplitude distribution in a family of wavelet functions. The CWT could be defined as:13
[TeX:]
\documentclass[12pt]{minimal}\begin{document}\begin{equation*}
{\rm CWT}(a,b) = \frac{1}{{\sqrt a }}\int {{\rm PA}(t)\Psi \left({\frac{{t - b}}{a}} \right)dt},
\end{equation*}\end{document}
where PA represents the photoacoustic signal, t is the time the photoacoustic signal arrived at the detector, CWT denotes the continuous wavelet transform, a is the scale parameter related to the frequency, and b denotes the time shift parameter. The most commonly used wavelet function for such applications is the complex Morlet wavelet. The Morlet wavelet is the product of a Gaussian window of variance f
b (the bandwidth parameter) and a complex exponential of frequency f
c (the center frequency), and the Morlet wavelet is defined by:
[TeX:]
$\Psi \left(t \right) = \sqrt {\pi f_b } \exp \left({j2\pi f_c t} \right)\exp \left({{{ - t^2 } \mathord{/ {\vphantom {{ - t^2 } {f_b }}} \kern-\nulldelimiterspace} {f_b }}} \right)$
. Ψ(t) is the mother wavelet, and Ψa, b(t) is known as daughter wavelets, which is defined as
[TeX:]
$\Psi _{a,b} (t) = 1/\sqrt a \Psi (t - b/a),$
a, b ∈ R, a > 0. The Fourier frequency that corresponds to a particular scale in the Morlet transform is
[TeX:]
${{f_c } \mathord{/ {\vphantom {{f_c } a}} \kern-\nulldelimiterspace} a}$
. Compared to Fourier transform, one of the main advantages of wavelets is that they offer a simultaneous localization in time and frequency domain. Since the photoacoustic signal is higher than the noise in some specific frequency band, the superposition of the photoacoustic signal in the specific frequency band further improves the signal-to-noise ratio (SNR).2.3.Experimental SetupFigure 1a shows the setup of a photoacoustic imaging system based on a focused ultrasonic transducer. In this system, a pulse light from an Nd:YAG laser (Surelitel-10, continuum) at the wavelength of 532 nm, 6-ns pulse-width is used at a repetition rate of 10 Hz. The laser pulse energy is controlled below 6 mJ. The laser beam, passing a diverging lens to provide a wide spot (diameter roughly equals to 3 cm), is irradiated on the surface of a sample. A wideband focused ultrasonic transducer is used to receive the photoacoustic signals. The central frequency of the ultrasonic transducer (V381, Panametrics) is f c 3.5 MHz, the diameter D is 1.9 cm, and the focal length F at 3.5 MHz is 6 cm,14 as shown in Fig. 1b. The focal zone is 3 cm, which covers the size of the rat heart along the y axial. The focal spot diameter can be approximated as [TeX:] $\phi _{fz} = 1.02{{({F \cdot c_a })} \mathord{/ {\vphantom {{({F \cdot c_a })} {({f_c \cdot D})}}} \kern-\nulldelimiterspace} {\left({f_c \cdot D} \right)}} \approx 1.38\,{\rm mm}$ , where [TeX:] $c_a \approx 1.5\,{{{\rm mm}} \mathord{\left/ {\vphantom {{{\rm mm}} {{\rm us}}}} \right. \kern-\nulldelimiterspace} {{\rm us}}}$ is the velocity of ultrasonic. The transducer is connected to a pulse amplifier (Olympus-NDT PR5800). After a pre-amplifier, the detected signals are recorded and averaged one time by an oscilloscope (TDS-2024, Tektronix), and then collected by a personal computer. By using a focused transducer, the signal received at each location forms a depth-resolved A-line. The distance between the PA source and the transducer is calculated by multiplying the time of arrival with the speed of sound in the medium. A time-domain signal is converted into a one-dimensional image along the y axis, and the PA signal shows the blood distribution in the y-axial of the myocardial tissue. For good coupling of acoustic waves, both the transducer and the sample are immersed in the distilled water in a container. For convenience, the scanning system in this study is realized by moving the sample through computer controlled step-motors (step length equals 0.5 mm) along the x axis instead of moving the detector. The axial and lateral spatial resolution of PA imaging are 0.3 and 2 mm, respectively.14 A two-dimensional (2D) photoacoustic image is formed by assembling a complex modulus of wavelet coefficient of A-lines to show x-y cross section of myocardium tissue. 2.4.Statistical AnalysisAll data were analyzed using Windows statistical software package (SPSS 13.0). The photoacoustic intensity and areas of PA images correlate with a delay time after LAD occlusion using the negative exponential correlation. The nonlinear least-squares data fitting employs the Gauss–Newton method. The value of CK-MB correlates with a delay time after LAD occlusion using the linear correlation. P<0.05 was considered to be a significant difference. 3.ResultsFigures 2a, 2b demonstrate the depth-resolved A-line photoacoustic signal of myocardium and the corresponding wavelet coefficient, respectively. Figure 2a shows that the depth-resolved A-line signal includes the strong noise, especially at the position A, B, E, and F. The noise at the position A, B, E, and F is electronic noise, and mainly results from the scanning system. The PA signal is produced at positions C and D. Figure 2b reveals that the wavelet coefficient of the noise below scale a 55 is approximately homogeneous, and the wavelet coefficient of the PA signal increases with the scale a increasing in the range from 56 to 100. The Fourier frequency that corresponds to a particular scale in the range from 56 to 100 is between 1 and 0.5 MHz. The myocardial layer size of about a millimeter order is the most sensitive to this frequency spectrum. The results indicated that the wavelet analysis could improve PA SNR through choosing a suitable scale a. In order to further improve the SNR, the superposition of wavelet coefficients at scales a between 56 and 100 was employed as shown in Fig. 2c, because the small value of range in the frequency spectrum could realize a better frequency spectral superposition effect to suppress noise. Fig. 2(a) Time-domain photoacoustic signal of myocardial. (b) The corresponding wavelet coefficient. (c) Superposition of wavelet coefficients at scales between 56 and 100. 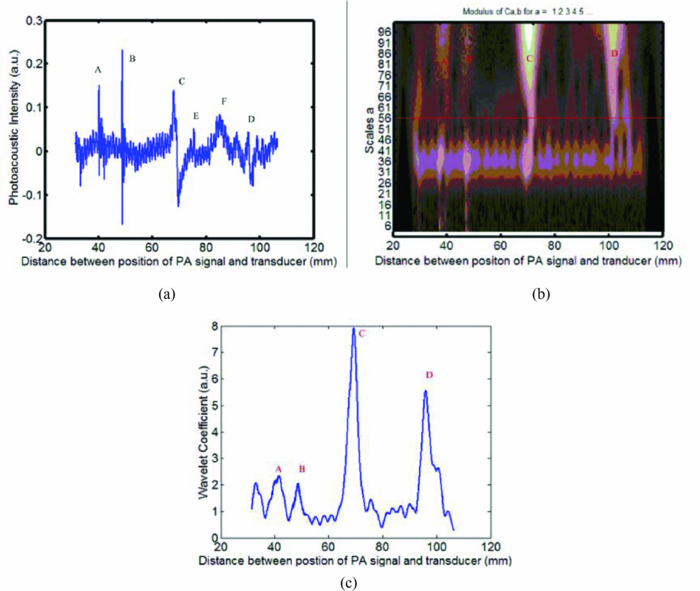 Figure 2c shows the PA signal at position C and D. The amplitude of the PA signal at region C was much higher than that of D. Usually, the full width at half maximum (FWHM) of the profile is used to estimate the size of the absorber. Figure 2c indicates that FWHM is roughly 2.5 mm, which is in good agreement with the size of the myocardial wall. Figure 2c also demonstrates that the distance between them was approximately 3 cm. The rat heart is a hollow organ, with a size of 1.5 cm. A 15 mm chamber is filled with blood, and the penetration depth of 532 nm laser in blood is approximately 37 μm. However, the axial spatial resolution of PA imaging is 0.3 mm. We could not distinguish the photoacoustic signal in the superficial layer of the left ventricular (LV) chamber from the myocardial wall. And the blood in the myocardium is the main absorber at the wavelength of 532 nm. Therefore, the PA signal at area C is produced by the blood in the myocardium, and the PA signal at area D is the echo of that of C from the back cardiac wall. Consequently, we choose the PA signal at region C for analyzing the blood volume in myocardium. Figure 3 shows those 2D photoacoustic images formed by assembling A-lines signal of region C at the different delay time after LAD occlusion. The 2D PA images demonstrate x-y cross section of myocardium tissue. Figure 3 indicates that the gray level intensity of PA images decreases with delay time after LAD occlusion increases. Assuming the threshold value of the gray level intensity is 10, the areas of 2D PA images decrease as the delay time after LAD occlusion increases. The finding is consistent with the phenomenon that the whitened area of myocardium increased with the delay time after LAD occlusion increases. Fig. 3Photoacoustic images of myocardium at a different delay time after LAD occlusion: (a) 10 min; (b) 25 min; (c) 40 min; (d) 60 min; (e) 90 min; (f); 120 min. The red curves denote the threshold value of the gray level intensity.  Since blood volume in the ischemia area decreases, the corresponding fractional blood volume in the focal areas of the focused transducer decreases. The blood optical absorption coefficient is related to the fractional blood volume and the oxygenation in the myocardial layer. The total absorption of blood is written as the sum of absorption contributions by each chromophore, each contribution being linearly dependent upon chromophore concentration. The total blood absorption is expressed as follows: [TeX:] $\mu _{a - {\rm blo}} = \alpha _{{\rm HHb}} \cdot c_{{\rm HHb}} + \alpha _{{\rm HbO}_2 } \cdot c_{{\rm HbO}_2 }$ , where αHHb and [TeX:] $\alpha _{{\rm HbO}_2 }$ are the absorption coefficients (units: mm−1molar−1) of deoxyhaemoglobin and oxyhaemoglobin, respectively. The total absorption in myocardial tissue is written as the sum of blood and myocardial muscle, and is given by: μa = μa − blo + μa − myo, where μa − blo ∼ 266 cm−1 at the wavelength of 532 nm, μa − myo is the absorption coefficients (mm−1) of myocardial, muscle and roughly 10 cm−1 at the wavelength of 532 nm.15 Because deoxy- and oxyhemoglobin have similar extinction coefficients at 532 nm, the absorption coefficient of myocardial tissue is approximately given by: μa = α · c + μa − myo, where α is the absorption coefficients (units:mm−1molar−1) of blood, and c denotes the fractional blood volume. If the ratio of the diameter of the irradiated laser light to the sample's thickness is much more than 10, the PA distribution p for strong absorbing medium can be described as10 Eq. 1[TeX:] \documentclass[12pt]{minimal}\begin{document}\begin{equation} p\left(z \right) = \mu _a \Gamma H_0 \exp \left({ - \mu _a z} \right), \end{equation}\end{document}Figure 4 reveals the decrease in the maximum gray level intensity and areas of photoacoustic images, and the corresponding increase in the value of CK-MB with the delay time after LAD occlusion. Figures 4a, 4b demonstrate that the gray level intensity and areas of photoacoustic images are negative exponential functions of the delay time after LAD occlusion. An acute deterioration of coronary blood supply can reduce the blood volume in the myocardium and produce a release of ischemic metabolites. The degree of myocardial ischemia can be quantified by the value of CK-MB. Figure 4c shows that the value of CK-MB is a linear function of the delay time after LAD occlusion. Thus, the results demonstrate that the intensity and areas of the PA images are related to the value of CK-MB. Fig. 4(a) The maximum gray level intensity of photoacoustic images. (b) Areas of 2D photoacoustic images versus delay time after LAD occlusion. The symbols and error bars are the mean values and standard deviation of 10 samples, and the blue curve is fitting curve to 95% confidential intervals, where the fitting curve is expressed as: bexp (− at). (c) The corresponding value of CK-MB versus the delay time after LAD occlusion. The blue curve is the fitting curve to 95% confidential intervals, where the fitting curve is linear function.  The intuitive phenomenon is consistent with the above experimental results. At first, the coronary occlusion produced an abrupt drop in fractional blood volume, and the corresponding absorption coefficient of blood decreased sharply. As the delay time after LAD occlusion increases, the whitened area of myocardium increases. Thus, the peak intensity and areas of PA images are the rapid fall of an exponential model at the beginning of LAD occlusion. When the delay time after LAD occlusion is higher than 90 min, the change of the peak intensity and areas of PA images are not obvious, because the fractional blood volume decreases very slowly. It is suggested that PA imaging could assess the time-dependent acute myocardial ischemia, because the intensity and areas of PA images is inversely correlated with the value of CK-MB. 4.DiscussionsRecently, the blood oxygenation and volume at microvascular level have been investigated using photoacoustic imaging with an unfocused ultrasonic transducer.8, 9 During surgical revascularization after myocardial ischemia, we do not directly pay attention to blood oxygenation and volume at microvascular, but the extent and scope of myocardial tissue. Thus, we presented the large-scale photoacoustic imaging with a focused transducer for estimating the myocardial ischemia. Although the diffuse reflectance spectroscopy (DRS)4, 5 was used to investigate the myocardial ischemia, its disadvantages are obvious: 1. DRS does not directly assess the myocardial blood volume but the oxygenation; 2. DRS does not localize the areas of myocardial ischemia; 3. the depth of penetration of DRS is approximately 2 mm. The near-infrared fluorescence technique has excellent sensitivity and temporal resolution for cardiac diseases.16 However, the technique depends on the extrinsic fluorophore.16, 17 And another limitation is its short transport distance of light in tissue.18 The photoacoustic imaging with a focused transducer for assessing the myocardial ischemia could overcome these problems. The PA intensity is proportional to the absorption coefficient of the myocardial tissue. The detected various optical absorption results from a complex interplay of blood volume and oxygen consumption. Ischemia often reduces the fractional blood volume and oxygenation of the myocardial tissue, which leads directly to a decrease in the absorption properties of the tissue. Since the absorption properties of hemoglobin are uninfluenced by their oxidation state at 532 nm, the dominant factor that weakens the photoacoustic signals is believed to be a decrease in fractional blood volume in the myocardial region. The PA imaging system can localize the myocardial ischemia clearly and accurately when the delay time after LAD occlusion increases. Furthermore, the PA system could be applied for imaging the myocardial ischemia of human. The thickness of human myocardium is roughly 2 cm. The focal zone of an ultrasonic transducer of 3.5 MHz is 3 cm, which could cover the whole thickness of human myocardium. However, because the near field condition (the diameter of the irradiated laser light is 10 times greater than the sample's thickness) is invalid, we should focus on the distribution of the local fluence rate in the myocardium of a human in order to characterize the ischemia quantitatively. 5.ConclusionsIn conclusion, the noninvasive PA imaging with a focused transducer could rapidly localize the areas of myocardial ischemia and characterize the myocardial extent through the direct assessment of myocardial fractional blood volume. Thus, the PA imaging with a focused transducer could be a potential tool for real-time evaluation of myocardial ischemia in a surgical operation, which is the key to modulate the operational scheme and the therapeutic treatment. AcknowledgmentsThis project was sponsored in part by the Research Fund for the Doctoral Program of Higher Education under No. 200803940001, in part by Fujian Provincial Education Scientific Project under No. JB09067, in part by the Program for Excellent Talents in University, and in part by the program for New Century Excellent Talents in University under Grant No. NCET-04–0615 by the Ministry of Education of China. The authors would like to thank all the people who contributed to the paper. In particular, thanks go to Dr. Zheng Huang who reviewed the manuscript and made helpful comments. ReferencesW. J. Rogers, H. G. McDaniel, L. R. Smith, J. A. Mantle, C. E. Rackley,
“Correlation of angiographic estimates of myocardial infarct size and accumulated release of creatine kinase MB isoenzyme in man,”
Circulation, 56 199
–205
(1977). Google Scholar
M. Wiemer, J. P. Wielepp, O. Lindner, W. Burchert, C. Langer, D. Horstkotte, and
T. Butz,
“Assessment of myocardial perfusion by positron emission tomography in patients with end-stage coronary artery disease treated with percutaneous myocardial revascularization,”
Chin. Med. J., 122 2807
–2813
(2009). https://doi.org/10.3760/cma.j.issn.0366-6999.2009.23.002 Google Scholar
D. S. Fieno, R. J. Kim, E. L. Chen, J. W. Lomasney, J. Klocke, and
R. M. Judd,
“Contrast-enhanced magnetic resonance imaging of myocardium at risk: distinction between reversible and irreversible injury throughout infarct healing,”
J. Am. Coll. Cardiol., 36 1985
–1991
(2000). https://doi.org/10.1016/S0735-1097(00)00958-X Google Scholar
Y. Ti, P. Chen, and
W. C. Lin,
“In vivo characterization of myocardial infarction using fluorescence and diffuse reflectance spectroscopy,”
J. Biomed. Opt., 15 037009
(2010). https://doi.org/10.1117/1.3442505 Google Scholar
F. H. Bernet, D. Reineke, H. R. Zerkowski, and
D. Baykut,
“Ischemia monitoring in off-pump coronary artery bypass surgery using intravascular near-infrared spectroscopy,”
Eur. J. Cardiothorac. Surg., 1 12
–17
(2006). https://doi.org/10.1186/1749-8090-1-12 Google Scholar
M. Xu and
L. V. Wang,
“Photoacoustic imaging in biomedicine,”
Rev. Sci. Instrum., 77 041101
(2006). https://doi.org/10.1063/1.2195024 Google Scholar
L. V. Wang and
X. Yang,
“Boundary conditions in photoacoustic tomography and image reconstruction,”
J. Biomed. Opt., 12
(1), 014027
(2007). https://doi.org/10.1117/1.2709861 Google Scholar
M. Sivaramakrishnan, K. Maslov, H. F. Zhang, G. Stoica, and
L. V. Wang,
“Limitations of quantitative photoacoustic measurements of blood oxygenation in small vessels,”
Phys. Med. Biol., 52 1349
–1361
(2007). https://doi.org/10.1088/0031-9155/52/5/010 Google Scholar
X. Wang, Y. Pang, G. Ku, X. Xie, G. Stoica, and
L. V. Wang,
“Noninvasive laser-induced photoacoustic tomography for structural and functional in vivo imaging of brain,”
Nature Biotechnol., 21
(7), 803
–806
(2003). https://doi.org/10.1038/nbt839 Google Scholar
J. A. Viator, S. L. Jacques, and
S. A. Prahl,
“Depth profiling of absorbing soft materials using photoacoustic methods,”
IEEE J. Sel. Top. Quantum Electron., 5 989
–996
(1999). https://doi.org/10.1109/2944.796321 Google Scholar
A. Roggan, M. Friebel, K. Dorschel, A. Hahn, and
G. Muller,
“Optical properties of circulating human blood in the wavelength range 400–2500 nm,”
J. Biomed. Opt., 4 36
–46
(1999). https://doi.org/10.1117/1.429919 Google Scholar
K. Ytrehus,
“Models of myocardia ischemia,”
Drug Discovery Today, 3 263
–271
(2006). https://doi.org/10.1016/j.ddmod.2006.10.013 Google Scholar
Z. Zalevsky, I. Ouzieli, and
D. Mendlovic,
“Wavelet-transform-based composite filters for invariant pattern recognition,”
Appl. Opt., 35
(7), 3141
–3147
(1996). https://doi.org/10.1364/AO.35.003141 Google Scholar
X. H. Xu and
H. Li,
“Scanning photoacoustic mammography with a focused transducer featuring extended focal zone,”
Acta Physi. Sini., 57 4623
–4628
(2008). Google Scholar
S. Sato, M. Ogura, M. Ishihara, S. Kawauchi, T. Arai, T. Matsui, A. Kurita, M. Obara, M. Kikuchi, and
H. Ashida,
“Nanosecond, high-intensity pulsed laser ablation of myocardium tissue at the ultraviolet, visible, and near-infrared wavelengths: In-vitro study,”
Lasers Surg. Med., 29 464
–473
(2001). https://doi.org/10.1002/lsm.10002 Google Scholar
A. Nakayama, F. del Monte, R. J. Hajjar, and
J. V. Frangioni,
“Functional near-infrared fluorescence imaging for cardiac surgery and targeted gene therapy,”
Mol. Imaging, 1 365
–377
(2002). https://doi.org/10.1162/153535002321093972 Google Scholar
J. Chen, C. Tung, J. R. Allport, S. Chen, R. Weissleder and
P. L. Huang,
“Near-infrared fluorescent imaging of matrix metalloproteinase activity after myocardial infarction,”
Circulation, 111 1800
–1805
(2005). https://doi.org/10.1161/01.CIR.0000160936.91849.9F Google Scholar
J. V. Frangioni,
“In vivo near-infrared fluorescence imaging,”
Curr. Opin. Chem. Biol., 7 626
–634
(2003). https://doi.org/10.1016/j.cbpa.2003.08.007 Google Scholar
|


