|
|
1.IntroductionRaman spectroscopy is a technique frequently employed in the field of chemical analysis, and there are many reasons why this is so. It is capable of providing a wealth of information regarding the chemical composition of compounds, and is able to work in both the solid and the liquid phase. Moreover, small sample areas or volumes can be used, and if working with water-based solutions, the water itself does not interfere significantly with the spectrum. There are, however, disadvantages associated with the technique, perhaps most important being the fact that it is an inherently weak process, offering poor sensitivity. This arises from the tiny amount of Raman scattered photons that occur when compared to those that are Raleigh scattered (approximately 1 in 106). Further disadvantages include the interference of sample fluorescence in the spectra and the possibility that using laser irradiation can damage the sample. In terms of combating the sensitivity issue, one technique that has received significant exposure and interest since it was first encountered in 1977 is that of surface enhanced Raman spectroscopy (SERS), in which the use of roughened metallic substrates or colloids significantly enhances the Raman effect.1, 2 The spectra obtained from SERS are capable of providing a great deal of information, and at much higher signals than conventional Raman, based on the various vibrational modes excited through the laser excitation. These modes provide a detailed spectrum, with different vibrational energies relating to different bond energies, providing a detailed fingerprint, specific to a certain compound. The intensity of the bond energies can be related to the interaction of the molecule with the enhancing substrate, and also to the concentration of the compound. Concentration-based experiments involving SERS have achieved good limits-of-detection (LOD),3 but quantitative measurements can be challenging due to variations in signal levels, which can arise from only small changes in experimental conditions,4 even due to the sample positioning or due to compound orientation with respect to the substrate. For this reason, methods designed to obtain reproducible measurements must be investigated if quantitative or even semiquantitative results are to be obtained. Herein, a comparative technique is investigated for the detection of two pterin compounds, xanthopterin and isoxanthopterin, both found in mammals and both identified as potential indicators for certain types of cancers, based on their concentrations in urine samples.5 Indeed they have also been investigated in terms of their cytotoxic effects on cancer cells.6 The method investigated is to look at relative concentrations of the pterins in question simultaneously, as this data can be useful in cancer indications. Pterins are biological compounds derived from a pyramidine and a pyrazine ring, with different functional groups attached. Initially discovered in the pigments of a butterfly wing,7 they have been found in other animal pigmentation, such as in fish scales or in hornets,8 and also in the body as co-factors to metabolic reactions. The concentrations of pterins in urine samples have been studied as potential cancer indicators using a variety of techniques, such as high-performance liquid chromatography (HPLC)9 and capillary electrophoresis,5 coupled with fluorometric detection, and also SERS.3, 10 While these techniques offer higher LODs, the focus of this work concerns the use of a faster scan-time, which offers a trade-off between speed of analysis and signal intensity. 2.Experimental2.1.ChemicalsSilver nitrate, sodium chloride, hydroxylamine hydrochloride, xanthopterin, isoxanthopterin and 7,8-dihydrobiopterin were all obtained from Sigma Aldrich. 2.2.Nanoparticle SynthesisThe silver nanoparticles were synthesized according to a method developed by Leopold and Lendl.11 Briefly, AgNO3 was reduced using an alkaline hydroxylamine hydrochloride solution, the alkalinity of which was obtained through addition of sodium hydroxide. A final pH of 7 is obtained from the resultant nanoparticle solution. 10 mL of a 10−2 m solution of silver nitrate was added dropwise to 90 mL of a 1.67×10⁻³ m hydroxylamine hydrochloride solution, containing 3.33×10⁻³ m sodium hydroxide. Immediately after preparation, the nanoparticles in solution were aggregated with 5 mM NaCl, which resulted in the eventual formation of the very large (>40 μm) aggregates shown below, and which give high SERS intensity under microscopic examination due to the large particle density. 2.3.SERS AnalysisThe system used in the Raman analysis was a Horiba Jobin Yvon LamRAM HR using 633 and 532 nm laser excitations with powers of up to 12 mW, and a diffraction grating of 600 lines/mm. The 100× objective lens used gave a spatial resolution of approximately 4 μm, while the 10× lens gave a resolution of approximately 40 μm. An exposure time of 10 s was implemented for the spectra acquired, and the typical sample consisted of a 6 μL droplet. 3.Results and DiscussionSERS effects have been demonstrated in low volume samples, corresponding to droplets of 6 μL volume deposited onto a glass microslide, before being subjected to incident laser light of 532 nm. Directing the light toward the silver colloidal aggregates resulted in enhanced spectra of the pterin solutions, as can be seen in the spectra obtained of 7,8-dihydrobiopterin, both in the presence and in the absence of the aggregated silver colloids, as shown in Fig. 1. Significant enhancement was clearly evident due to the lack of any worthwhile signal being obtained from the solution with no colloidal aggregates. Fig. 1Raman and SERS spectra of 7,8-dihydrobiopterin, with no signal obtainable from the solution in the absence of the silver aggregates. 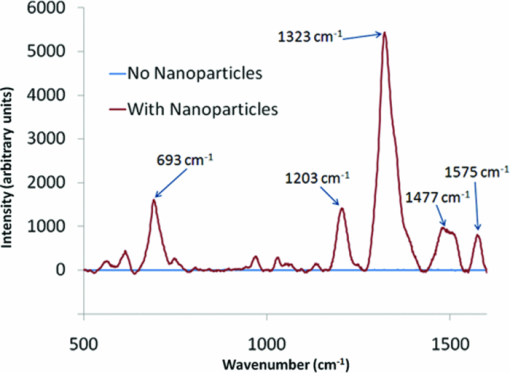 Regarding the SERS data obtained, large variations were observed between spectra pertaining to the same sample, and one of the contributing factors to this variance is attributed to the use of the 100× objective lens, which meant that a very small area of the substrate was measured in each experiment. Since it would be expected that different points on a colloidal aggregate will have differing SERS enhancements (“hot spots”) due to variations in the packing of the colloidal particles, experiments were subsequently carried out with a 10× objective lens, which probes a larger sample area and thus can, to some extent, average out local variations in the enhancement factors, improving the reproducibility. One of the greatest advantages of Raman spectroscopy is its ability to offer a large amount of data pertaining to the molecular structure of a compound, based on the vibrational spectra that are obtained from the scattering events. This fine-structure data can be exploited down to the resolution between molecules with highly similar structures, and in the case of the study presented here, between structural isomers. The two pterin compounds, xanthopterin and isoxanthopterin, are geometrical isomers, differing only by the orientation of their pyramidine unit. Despite their high similarity, they do have quite different properties, particularly in their fluorescence characteristics. In terms of their structure there is very little difference, but applying SERS makes it possible to differentiate between the two using differences in the intensities and positions of the bands in the spectra (see Fig. 2). Fig. 2SERS spectra of (a) xanthopterin and (b) isoxanthopterin, showing insets of their chemical compositions. 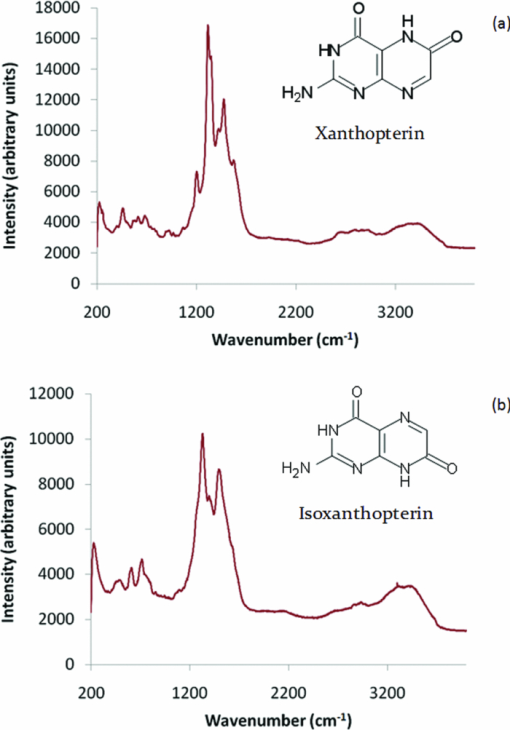 There are a number of differences between the two spectra. Working from left to right, the group of peaks between 400 and 800 cm−1, attributed to skeletal vibrations,3 are in differing ratios for each of the molecules. This is an interesting feature that could be of some use in the detection and identification of either pterin in a mixed sample. The main group of peaks between 1000 and 1600 cm−1 are quite different, with the isoxanthopterin showing fewer observable features, and moreover, the xanthopterin spectrum, has a greater range of peaks from which to deduce information. For example, the peak at 1200 cm−1 in particular seems to be absent from the isoxanthopterin spectrum. Figure 3 shows that even with the 10× objective lens, there is still considerable variation in the absolute intensity of the SERS signal given by a single volume of a pterin of fixed concentration when different large aggregates of particles are probed. Fig. 3(a) SERS spectra of xanthopterin, obtained from looking at (b) four separate aggregates within the same sample. 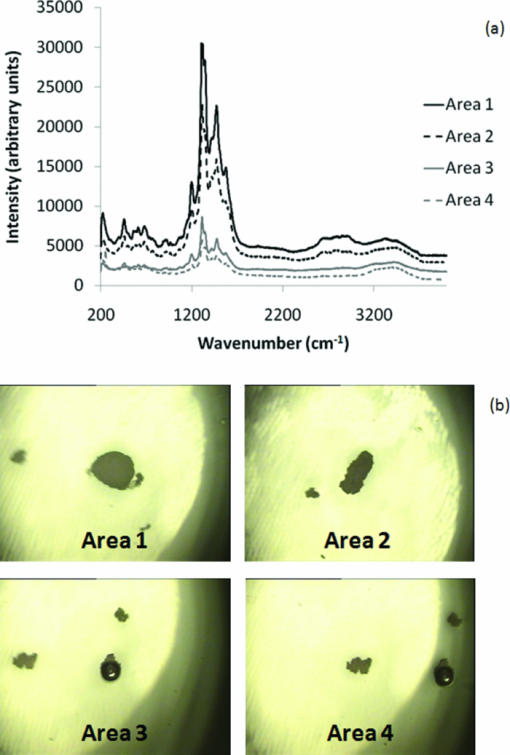 The spectra shown in Fig. 3a are from the same 6 μL droplet sample of xanthopterin, with four separate colloidal aggregates providing the SERS enhancements. While there is a large difference between the intensities of the spectra, and hence in reproducibility for a stated concentration, there is some indication of size-dependence of the signals based on the aggregates used for the scan. The pictures in Fig. 3b show the aggregates scanned, and where the aggregates are larger, namely areas 1 and 2, the spectra are more intense. It is possible that this simply reflects the better match between the probing beam diameter and the aggregates, but it will require more detailed investigation to ensure that there are not other causes. The important aspect that this relationship highlights is the variation in the spectra when moving from one scan to another, and as it is not possible to control the aggregation of the nanoparticles in solution, variations are unavoidable and further means of quantification need to be explored. The technique explored in Fig. 3, namely averaging over different aggregates within a sample volume, was applied to the analysis of the signal intensity of isoxanthopterin with respect to concentration, working from 50 μg/mL through 50 ng/mL. In the spectra shown in Fig. 4a, it can be seen that the intensity of the isoxanthopterin peaks broadly follow the concentration of the pterin in solution, although the inherent variability of SERS enhancement factors obtained at different locations on the colloidal aggregates means that the data shows a general trend rather than providing fully quantitative information. This can be further seen in the inset to Fig. 4a, where the trendline fit to the data and concomitant error bars show the general trend expected, but with a high deviation. The spectra in Fig. 4a were obtained using a 10× objective lens and using a 5 s exposure at a lower laser intensity, with 5 accumulations in order to reduce noise in the spectra. The lower laser intensity was implemented due to signal saturation effects at the higher concentrations. Spectra were taken for three different aggregates within the solutions before averaging, and there is a general decreasing trend toward the lowest concentrations examined. From this study it can be deduced that the variations within the concentrations make it very difficult to obtain quantitative data within an acceptable range, but that due to the general trend observed there is promise with regard to fine-tuning of this technique. The LOD of the isoxanthopterin under a 5 s exposure of lower laser intensity is between 500 ng/mL and 5 μg/mL. For an example of the LOD under conditions involving the full laser intensity, the xanthopterin spectra in Fig. 4b are presented, and there is evidence that the LOD under these conditions is indeed slightly lower, between 50 and 500 ng/mL. This is not as low as has been reported in the literature when using other techniques, for example, HPLC using fluorometric detection,9 or indeed SERS, but the short exposure time used here (10 s as opposed to 12 min in Ref. 3) makes this a rapid technique for obtaining spectra. While this compromises detection limits, it is still a useful indicator of the SERS effects regarding the pterin species here, and can be applied to simultaneous monitoring of the pterins, as described in Fig. 5. Fig. 5(a) The spectra show the differences between isoxanthopterin (iso) and xanthopterin (xanth) with respect to a mixture of ratio 1:1. (b) Shows the change in spectra across a range of mixtures, from a 5:1 ratio in favor of xanthopterin through 1:5. 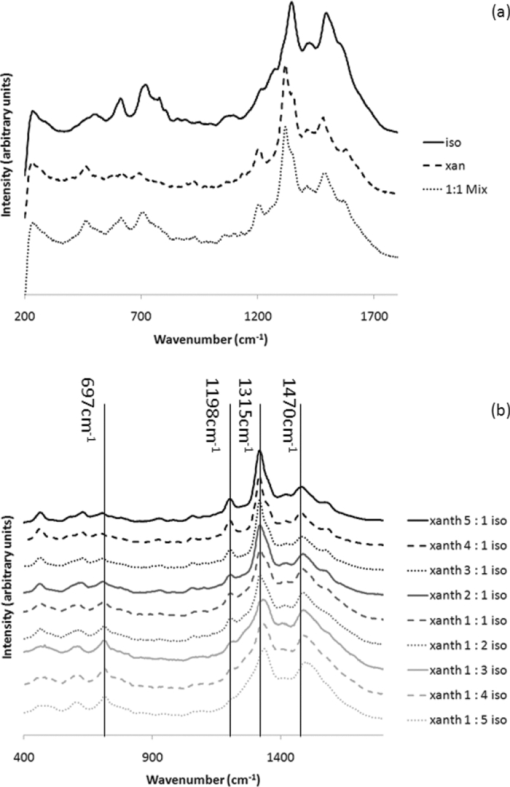 According to the variability observed in Figs. 3, 4, quantification of the data ideally required some form of normalization, and looking at the two pterins together in solution offers this to some extent, based on the ratios in which the two are mixed. Moreover, because of their similar chemical structure, the two pterins should respond similarly to any variations in the SERS signals, and should represent similar adsorption characteristics. Fig. 4SERS spectra showing the change in spectra with respect to changes in concentration, both for (a) isoxanthopterin and (b) the lower concentrations of xanthopterin. The inset to (a) shows average intensity of the 1340 cm−1 peak versus concentration of isoxanthopterin, with error bars showing the standard deviation across the samples measured. 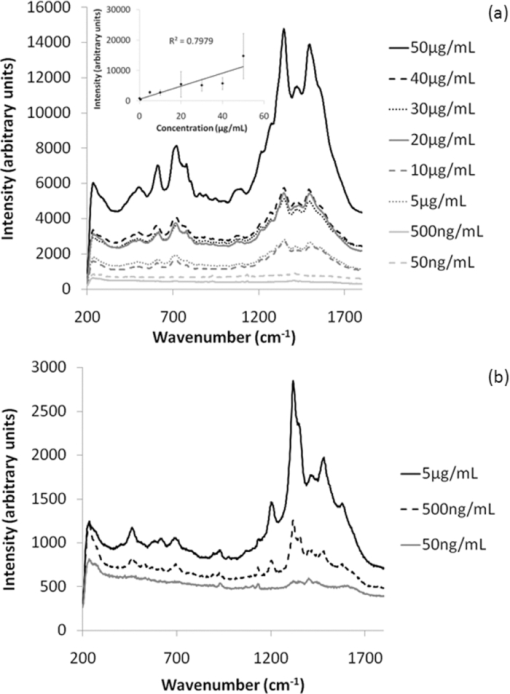 In order to investigate the potential of simultaneous xanthopterin and isoxanthopterin detection, mixtures of different ratios of the two substances were examined. In Fig. 5a, spectra are shown for the xanthopterin and isoxanthopterin separately, as well as for the 1:1 ratio mix of the two compounds (each was present at a concentration of 10 μg/mL). From this it can be deduced that there are features of both present in the mixed species spectrum, a trait that is further evidenced in Fig. 5b, where the data is composed of a set of ratios ranging from 5:1 in favor of xanthopterin to the converse situation with isoxanthopterin in a 5:1 majority. In each case, one ratio unit corresponds to 10 μg/mL. One way of looking at this is to consider that either the xanthopterin or isoxanthopterin is being used as an internal standard to the other one, and while many of the band energies lie in similar regions, there are sufficient changes in the spectra for useful normalization information. Using such similar compounds as normalization tools can be particularly beneficial, as any changes in the SERS effects at the colloid surfaces should be reflected similarly on both of the compounds. The data represented in Fig. 5b was modified for presentation purposes; in reality the absolute intensities from one sample to the next still varied to some degree, but from the representation shown there are some useful changes that can be of use, such as the decreases in the peaks at 1315 and 1198 cm−1 with increasing isoxanthopterin presence, and an increase in the peak at 697 cm−1. Using the raw data of the spectra, the peak areas for the 697, 1198, 1315, and 1470 cm−1 peaks were all calculated through integration in Origin8. The ratio of the 1315 cm−1 peak area when compared to the 1470 cm−1 peak generally decreases with increased isoxanthopterin presence, as does that of the peak area of the 1198 cm−1 peak relative to the 697 cm−1 peak. Both of these realtionships are plotted in Figs. 6a, 6b, respectively, while combining these two plots, by multiplying the two sets of data, results in the plot in Fig. 6c, which shows an increased linearity as shown by the R 2 value of almost 0.9. Fig. 6(a) Shows the ratio of the peak area of the 1315 cm−1 peak relative to the 1470 cm−1 peak. (b) Shows the ratio of the 1198 cm−1 peak to the 697 cm−1 peak. Both of these plots decrease in a linear fashion, and when the data from each is combined (multiplied) the linearity increases, as is displayed in (c). 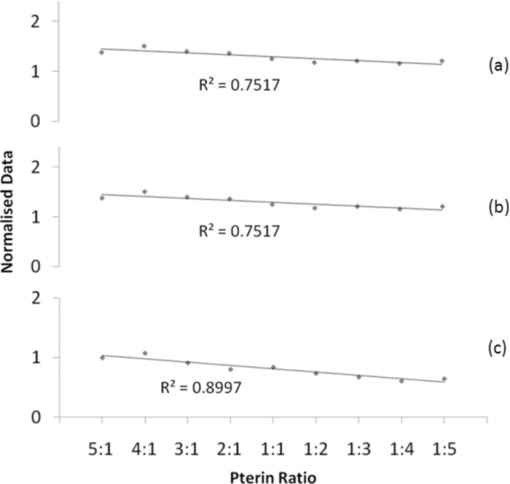 4.ConclusionsThe work shows the potential for using aggregated silver nanoparticles in SERS detection of 7,8-dihydrobiopterin, xanthopterin, and isoxanthopterin. Quantifying the concentration of the various compounds is problematic due to the inherent variations in SERS activity on the substrates employed, although improvements were observed in switching to a lower objective lens, and potential influence due to the size of the aggregates was averaged out through multiple spectra. SERS is a powerful technique and is capable of differentiating between two very similar compounds, in this case the structural isomers xanthopterin and isoxanthopterin, and using various mixtures of these two compounds a linear relationship was observed using ratios of some of the features unique to each spectrum. The spectra were obtained quickly using small sample volumes of 6 μL and low exposure times, resulting in a trade-off with spectrum sensitivity and providing LODs for xanthopterin and isoxanthopterin of 500 ng/mL and 5 μg/mL respectively. These values can be improved on by using longer exposure times, and could be applied to lower-concentration synchronous detection using the technique described above. AcknowledgmentsThis work was supported by Science Foundation Ireland, the School of Physics in Trinity College Dublin, and the Trinity College Postgraduate Research Studentship. ReferencesD. L. Jeanmarie and
R. P. Van Duyne,
“Surface Raman spectroelectrochemistry, part 1: heterocyclic, aromatic, and aliphatic amines adsorbed on the anodized silver electrode,”
J. Electroanal. Chem, 84 1
–20
(1977). Google Scholar
M. G. Albrecht and
J. A. Creighton,
“Anomalously intense Raman spectra of pyridine at a silver electrode,”
J. Am. Chem. Soc., 99 5215
–5217
(1977). https://doi.org/10.1021/ja00457a071 Google Scholar
Z. Feng, C. Liang, M. Li, J. Chen, and
C. Li,
“Surface-enhanced Raman scattering of xanthopterin adsorbed on colloidal silver,”
J. Raman Spectrosc., 32 1004
–1007
(2001). https://doi.org/10.1002/jrs.789 Google Scholar
S. E. J. Bell and
N. M. S. Sirimuthu,
“Quantitative surface-enhanced Raman spectroscopy,”
Chem. Soc. Rev., 37 1012
–1024
(2008). https://doi.org/10.1039/b705965p Google Scholar
S. Gamagedara, S. Gibbons, and
Y. Ma,
“Investigation of urinary pteridine levels as potential biomarkers for noninvasive diagnosis of cancer,”
Clin. Chim. Acta, 412 120
–128
(2011). https://doi.org/10.1016/j.cca.2010.09.015 Google Scholar
J. L. Lord, A. de Peyster, P. J. E. Quintana, and
R. P. Metzger,
“Cytotoxicity of xanthopterin and isoxanthopterin in MCF-7 cells,”
Cancer Letters, 222 119
(2005). https://doi.org/10.1016/j.canlet.2004.09.009 Google Scholar
H. L. Wijnen, H. L. Leertouwer, and
D. G. Stavenga,
“Colors and pterin pigmentation of pierid butterfly wings,”
J. Insect Physiol., 53 1206
–1217
(2007). https://doi.org/10.1016/j.jinsphys.2007.06.016 Google Scholar
M. Plotkin, S. Volynchik, N. Y. Ermakov, A. Benyamini, Y. Boiko, D. J. Bergman, and
J. S. Ishay,
“Xanthopterin in the oriental hornet (vespa orientalis): Light absorbance is increased with maturation of yellow pigment granules,”
Photochem. Photobiol., 85 955
(2009). https://doi.org/10.1111/j.1751-1097.2008.00526.x Google Scholar
A. Mancha de Llanos, M. M. de Zan, M. J. Culzoni, A. Espinosa-Mansilla, F. Cañada-Cañada, A. Muñoz de la Peña, and
H. C. Goicoechea,
“Determination of marker pteridines in urine by HPLC with fluorometric detection and second-order multivariate calibration using MCR-ALS,”
Anal. Bioanal. Chem., 399 2123
–2135
(2011). https://doi.org/10.1007/s00216-010-4071-3 Google Scholar
R. Stevenson, R. J. Stokes, D. MacMillan, D. Armstrong, K. Faulds, R. Wadsworth, S. Kunuthur, C. J. Suckling, and
D. Graham,
“In situ detection of pterins by SERS,”
Analyst., 134 1561
–1564
(2009). https://doi.org/10.1039/b905562b Google Scholar
N. Leopold and
B. Lendl,
“A new method for fast preparation oh highly surface-enhanced Raman scattering (SERS) active silver colloids at room temperature by reduction of silver nitrate with hydroxylamine hydrochloride,”
J. Phys. Chem. B, 107 5723
–5727
(2003). https://doi.org/10.1021/jp027460u Google Scholar
|

