|
|
1.IntroductionThe peripheral pulse acquired from photoplethysmography (PPG) can provide information about cardiovascular status, such as blood oxygen saturation, heart and respiration rates, cardiac output, and blood pressure.1 PPG, as first described in the 1930s,2 is an optical technique that noninvasively measures arterial pulsations in vivo, and its ease of use, low-cost and convenience make it an attractive area of research in the biomedical and clinical community. However successful, conventional contact PPG (cPPG) is not suitable in situations of skin damage (burn/ulcer/trauma), or when unconstrained movement is required. For instance, it has been demonstrated that the spring-loaded clips in conventional cPPG finger probes will affect the waveform of PPG signals due to the contact force between the sensor and the measurement site.3 One potential way to overcome this problem is through the use of imaging PPG (iPPG), a remote, contactless diagnostic technique that can assess peripheral blood perfusion.4, 5, 6, 7 At present, numerous epidemiologic studies provide strong evidence that occupational or recreational exercise not only maintains fitness but also boosts the immune system and reduces mortality from cardiovascular disease.8 There is also evidence that excessive exercise is hazardous and may result in morbidity.9 Furthermore, the “dose” of exercise (i.e., intensity, duration, and frequency of training required to achieve and optimize the beneficial response) has yet to be fully understood.10 A remote technique could offer reliable assessment of the cardiovascular system during and after exercise, and is therefore worth developing. Recently, Wieringa have introduced a multiple wavelength imaging PPG device that provides a potential route toward contactless blood oxygen saturation assessment,5 and Verkruysse have reported a remote PPG signal acquisition technique based on a digital camera and using ambient light illumination.6 Furthermore, we have previously presented an integrated imaging PPG setup for the detection of tissue optophysiological properties.11 Recent progress in iPPG research activities has stimulated our interest in the remote assessment of the cardiovascular system for evaluation of the influence of exercise. PPG is susceptible to motion-induced signal corruption, making motion artifact removal or attenuation one of the most challenging issues in iPPG signal processing.7 In recent pioneering studies, motion artifacts were not carefully dealt with and the associated PPG setups were usually operated under conditions that required the subjects to be motionless.4, 5, 6, 12 This drawback limits the physiological monitoring capabilities of the technique in real application environments (i.e., hospital, homecare, and sports performance assessment). In recent years, several methods, such as blind source separation,7 Least-mean-square adaptive filtering,13 independent component analysis (ICA),14 and single-channel ICA (SCICA),15 have been proposed for removal of noise from biomedical signals. The SCICA method, introduced by James and Lowe15 and James 16 has proved to be a superior solution to other available techniques because of its ability to decompose a single-channel recording into its underlying components (physiological or otherwise), using only the inherent temporal information independently of the components’ origin. In this paper, we present a novel method for remote assessment of cardiovascular status as well as for evaluation of its tolerance at different intensities of motion artifact. Quality imaging PPG signals were remotely captured from the right palm of 12 volunteers after exercises, and the quality of these signals was also compared to PPG signals simultaneously recorded from a contact PPG sensor. The motion artifact-reduction technique presented in this study attempts the remote acquisition of pulsatile and respiratory variations during exercise, in order to facilitate the appraisal of the effects of exercise on the cardiovascular system. 2.Methods and MaterialsTwo experiments were performed for this study, the purpose of which were (i) to assess the viability of the iPPG setup and (ii) to assess the performance of the motion artifact reduction technique presented in this study. The recordings for the first experiment were taken with the subject at rest to minimize motion, and those of the second experiment were taken with the subject performing various intensities of exercise. Hence, the present study employed individual image-processing procedures for each experiment. Specifically, a spatial averaging approach was first conducted to generate the reduced frames for experiment 1. Then, a joint time-frequency analysis [time-frequency representation (TFR)] was employed to trace the physiological parameters. In experiment 2, a motion artifact-reduction technique was applied before the spatial averaging step common to both experiments. After the reduced frames were obtained, a blind source separation technique (SCICA) was performed on the iPPG signals to extract the pulsatile and respiratory waveforms. The time-varying heart and respiration rate was then accessed via the TFR. 2.1.SubjectsNone of the subjects involved in this study had any known cardiovascular disease and none were diabetic. The detailed information of these subjects is summarized in Table 1. Informed consent was obtained from all subjects in accordance with the university ethical committee and in compliance with the Declaration of Helsinki. All subjects were asked to refrain from consuming caffeine or alcohol and were asked not to smoke or undertake strenuous exercise for the 2 h preceding the study. Table 1Subject characteristics.
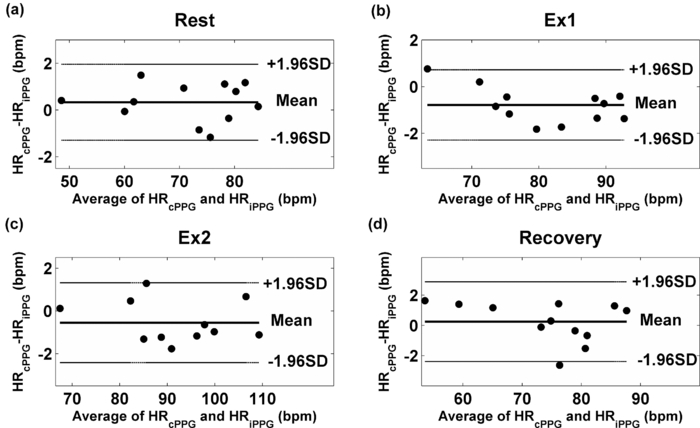
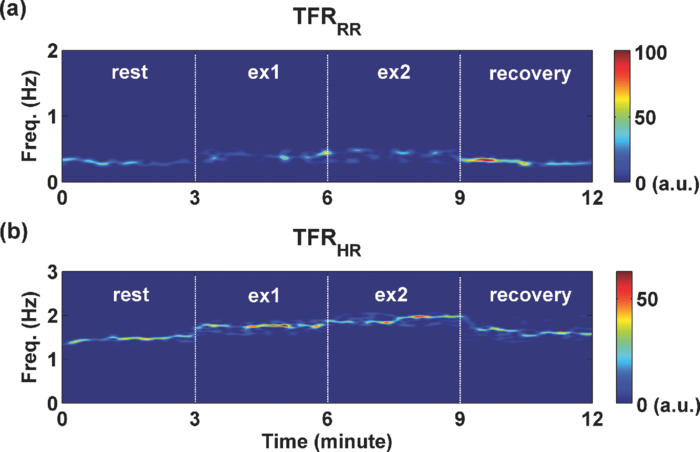
2.2.Imaging Photoplethysmography SetupThe iPPG system is schematically presented in Fig. 1. A monochrome CMOS camera (model EnSens MC1360-63, Mikrotron GmbH, Unterschleissheim, Germany) with a maximum resolution of 1280×1024 pixels, was focused on the palm of the participant's right hand (experiment 1) or face (experiment 2) using a standard F-mount lens (model Nikkor 20 mm f/2.8D, Nikon, Japan). The pixels were encoded in 10-bit gray scale, allowing the camera to detect the weak pulsations of the microvascular tissue bed. A custom-built infrared (λ = 870 nm, Δλ = 15 nm) ring-light illumination source (RIS), comprising 100-RCLEDs (model 0603SMD, JMSienna Co., Ltd., Taoyuan, Taiwan) fitted into a parabolic ring reflector, was mounted around the lens to collimate and homogenize the illumination at the target area. The RIS was current-controlled and synchronized with the camera capture cycle. 2.2.1.Experiment 1: Comparison between cPPG and iPPG before and after exercise2.2.1.1.Protocol.The experimental procedures are depicted in Fig. 2. All measurements were taken in a temperature-controlled darkroom (27 ± 1°C) by a trained operator. For this experiment, 12 healthy subjects aged 20–55 years were enrolled from Loughborough University. On arrival, each subject was required to sit on an adjustable chair and rest for at least 10 min before blood pressure measurements were taken from their left arm using a clinically validated blood pressure monitor (model M6, Omron, Japan). Each subject was then asked to sit at ease and rest their right hand, maintaining it as motionless as possible during the test. A soft black cushion was placed under the hand to further minimize the motion. The right palm of each subject was exposed to the infrared RIS, and the distance between camera lens/RIS and skin was ∼350 mm. A commercial contact pulse oximetry sensor (model P871RA, Viamed, United Kingdom) was placed on the index finger of the right hand to measure the participant's pulse signal for subsequent validation of remotely acquired physiological signals. The analog signal outputs from the contact sensor were digitized using a DISCO4 (Dialog Devices, United Kingdom) data acquisition system comprising a 12-bit A/D converter running at a sample frequency of 128 Hz. The images captured from the camera were synchronized to the physiological signals acquired from the contact sensor via an additional signal from the camera to the A/D converter (Fig. 1). The images were captured for 34 s at a rate of 50 fps and an exposure time of 15 ms, yielding raw images with 640×480 pixel resolution. Contact PPG signals were captured from the finger probe for ∼3 min to verify that the heart rate (HR) was stable. The acquisition of frames was initiated 60 s later, at which time a synchronization signal triggered simultaneous recording of signals from the finger probe. The subject was then asked to ride a gym cycle (model XR-580, PowerTrek, United Kingdom) at a speed of 15 km/h (exercise 1) for 5 min. Immediately after the exercise, the subject's blood pressure and second set of images was acquired, again for 34 s. After a 10-min rest, the subject performed another 5 min of exercise at 25 km/h (exercise 2) and the postexercise data acquisition procedures were repeated. A final set of measurements were taken after another 10-min rest period. 2.2.1.2.Image processing.Once a set of recordings was successfully acquired, the raw image frames were divided into discrete subwindows to produce a new set of reduced frames, where the value of each pixel in the reduced frame was set as the average of all the pixel values within each subwindow. Though compromising the spatial resolution, such a procedure was used to significantly improve the signal-to-noise ratio.6 In the present study, the subwindow size was set at 10×10 pixels. This resulted in a reduced frame size of 64×48 pixels, yielding PPG signals at each pixel position across a sequence of frames. The PPG signals were then bandpass filtered using a fifth-order Butterworth filter. Cutoff frequencies were set at [0.5, 4] Hz to allow a wide range of heart-rate measurements. The joint time-frequency analysis (e.g., TFR) was then performed on the iPPG signals to assess the heart rate. 2.2.2.Experiment 2: Motion compensation during exercise2.2.2.1.Protocol.To investigate the continuous pulsatile and respiratory variations under various exercise levels, an additional video was taken from the face of one male volunteer (age = 27 yr, height = 1.78 m; BMI = 20.5 kg/m2). The face is a convenient target for remote detection because it is uncovered during the cycling exercise, and it has been shown in the literature that the facial PPG signal is typically stronger than that from other anatomical locations.6 A continuous set of data was recorded while the subject performed four routines, each lasting 3 min. In the first routine, the subject sat still for recording of baseline signals; in the second and third routines, the subject performed cycling exercise at 15 and 25 km/h, respectively; in the fourth routine, the subject sat still for recording of his recovery from exercise. For the video recording, the participant was asked to move naturally with his face pointing directly toward the camera, only taking care to remain seated and to maintain planar alignment of his face with the camera during the exercise. Images of 512×512 pixels were taken from the face at a lower frame rate (20 fps, T exposure = 40 ms) to allow image capture over an increased duration of exercise (∼12 min). The distance between the camera lens and the face was 400 mm, and all other factors were maintained as in experiment 1. 2.2.2.2.Image processing.An overview of the image processing procedures for the face recordings is schematically presented in Fig. 3. Raw frames were submitted to a set of preprocessing algorithms to detect planar shifts within the sequence of frames and to shift these into alignment. More specifically, a reference region (50×50 pixels) of high contrast (around the nose) was manually chosen on the first frame of the set. The planar shift was determined via 2-D cross-correlation of the reference region and regions on all subsequent frames.17 Two-dimensional cross-correlation is a basic statistical approach that measures the degree of similarity between an image and a template.18 The cross-correlation peaks at positions where the template most closely matches the image; therefore, it is possible to reveal the shift by computing the correlation over template-sized regions in the image. A fast Fourier transform–based normalized correlation method was applied in the present study.19 Alignment of the raw set of frames resulted in a set of smaller frames (300×400 pixels). These stabilized frames were then divided into discrete subwindows, as described earlier, and a new set of reduced frames was obtained. 2.2.2.3.Single-channel independent component analysis.Differing from ICA, which relies on multichannel data, single-channel independent component analysis (SCICA) is a method to isolate multiple components using only the temporal information inherent in a single-channel recording.16 In essence, SCICA assumes that a set of the observed data points from a single channel is a linear combination of unknown and statistically independent sources.15 SCICA can be mathematically expressed as follows: let x(t) t = 1, 2, …, n be the observed single data channel with n elements. Then break it up into a sequence of contiguous blocks and treat these as the multichannel observations from which the following constructed matrix can be obtained: Eq. 1[TeX:] \documentclass[12pt]{minimal}\begin{document}\begin{equation} X = \left[ {\begin{array}{*{20}c} {x_t } & {x_{t + \tau } } & \cdots & {x_{t + N\tau } } \\ {x_{t + \tau } } & {x_{t + 2\tau } } & \cdots & {x_{t + (N + 1)\tau } } \\ \vdots & \vdots & \ddots & \vdots \\ {x_{t + (m - 1)\tau } } & {x_{t + (m)\tau } } & \cdots & {x_{t + (N + m - 1)\tau } } \\ \end{array}} \right], \end{equation}\end{document}Eq. 2[TeX:] \documentclass[12pt]{minimal}\begin{document}\begin{equation} b_i (t) = \frac{1}{m}\sum\limits_{k = 1}^m {B_{k,t + k - 1}^i } \quad (T = 1,2, \ldots N), \end{equation}\end{document}2.3.Photoplethysmography Signal ProcessingFourier transform (FT) offers a passage from the time domain to the frequency domain and is widely applied in conventional PPG signal processing because it can straightforwardly provide fundamental information, such as heart and respiration rates.5, 13 However, it assumes that signals are steady state when physiological signals are transient in nature. Hulsbusch and Blazek have shown that the uncritical use of the FT could lead to misinterpretation of perfusion PPG signals.4 To obtain a potentially more revealing picture of the temporal localization of a signal's spectral components, one must resort to the joint time-frequency analysis (e.g., TFR). The TFR approach converts a one-dimensional time signal into a two-dimensional function of time and frequency so that frequency components can be localized with a good temporal resolution.21 One attempt has recently been made to reveal the time-varying heart and respiration rates from imaging PPG via short-time Fourier transform (STFT).6 STFT yields a time-frequency representation of a signal by performing FT along the time axis using an analysis window.21 However, the joint time-frequency resolution of the STFT is limited [i.e., an increased time resolution (through the use of a short analysis window) leads to a loss of frequency resolution and vice versa]. To better characterize properties of the obtained PPG signals in the joint time-frequency domain, a smoothed pseudo-Wigner-Ville distribution (SPWVD) (for a review, see Refs. 21 and 22), was chosen for the TFR estimation, where x(s) and x*(s) are the PPG signal and its complex conjugate respectively, g(s) and h(τ) are two smoothing windows whose effective lengths independently determine the time and frequency resolution. On the basis of previous experience in PPG signal processing, the Kaiser–Bessel function is adopted as both the time and frequency smoothing window. Originating from the Wigner–Ville distribution (WVD), SPWVD has the advantage of good time and frequency resolution yet minimizes the main drawback of WVD (i.e., cross-term interference; making it a suitable technique in the present application). In this work, postprocessing and analysis of both iPPG and physiological recordings were performed with custom software in Matlab 2008a (MathWorks, Nantik, Massachusetts).2.4.Statistical AnalysisStatistical analysis was performed with SPSS15 for MS Windows. Significant difference between the physiological measurements after different conditions was tested with analysis of variance (ANOVA) to demonstrate the influence of exercise on the cardiovascular system. Posthoc analysis with Duncan's test was also employed to test the group difference. Moreover, to test the performance of the iPPG system, Bland–Altman analysis23 was performed for comparison between iPPG and cPPG. The difference between iPPG and cPPG was plotted against the averages of both systems, as was the mean and standard deviation (S.D.) of the differences, the mean of the absolute differences, and 95% limits of agreements (±1.96 S.D.). In addition, the Pearson's correlation coefficients and the corresponding p-values were calculated to estimate HR from iPPG and contact-PPG system. 3.Results3.1.Experiment 1Four physiological measurements were taken as described previously (i.e., rest, post-ex1, post-ex2, and recovery). Figure 4 summarizes the results of the measured variables: HR, systolic blood pressure (SBP), and diastolic blood pressure (DBP). ANOVA showed a significant influence of exercise on SBP and HR (F = 7.608, p = 0.001 and F = 12.666, p < 0.001). Posthoc tests revealed that, compared to the rest condition, the HR and SBP were significantly higher than baseline after both exercise levels (ex1 versus rest, p < 0.05, ex2 versus rest, p < 0.01). A significant difference in HR and SBP was also observed between exercise levels. Higher HR (p = 0.004) and SBP (p = 0.039) were revealed after exercise 2 (25 km/h) compared to the moderate exercise level (15 km/h). After a 10-min rest, the hemodynamic parameters all returned to the rest level. No significant effect of exercise on DBP was observed. Fig. 4Effects of exercise on blood pressure and heart rate. Each bar represents the average of 12 subjects for (a) SBP, (b) DBP, and (c) HR for each state (rest, post-ex1, post-ex2, recovery). Error bars represent standard deviations (S.D.). Significant statistical differences are indicated with * for p < 0.05 and ** for p < 0 .01. 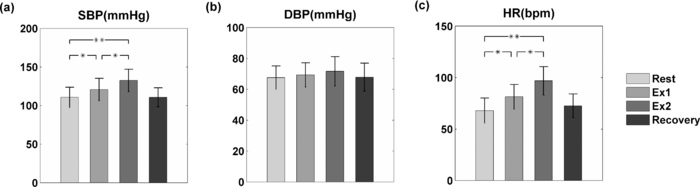 Figure 5 shows an example of the PPG signals obtained from a single subject and the TFR, with HR frequency and second harmonic components. The HR derived from the TFR plot was in excellent agreement with the HR obtained from the commercial pulse oximeter sensor readings. A slowly varying HR is also detected from the TFR trace, indicating the potential use of TFR in revealing the time-varying HR during the exercise. To statistically evaluate the performance of the iPPG system, Bland–Altman plots were employed to compare the agreement of HR between iPPG (HRiPPG) and cPPG (HRcPPG) measurements. The HRiPPG was obtained through averaging the HR within all the subwindows (64×48 pixels). Historical HR estimations were used to define a maximum threshold for deviation among different regions. First, the HR was calculated in the middle of the processed frames (x = 32, y = 24) and, then, the HR within this region was treated as a reference. Successive calculations were then performed where, if the difference between the current HR estimation and the reference value exceeded the threshold (9 bpm in this study), the algorithm isolated these regions as nontissue or corrupt and rejected the invalid HR. The comparison of HRcPPG and HRiPPG is shown in Fig. 6. Specifically, the mean bias is 0.33 bpm with 95% limits of agreement −1.29 to 1.96 bpm in the rest state, whereas the mean bias obtained after the first and second exercises are −0.78 and −0.55 bpm, respectively. The corresponding 95% limits of agreement are from −2.29 to 0.73 bpm and −2.42 to 1.32 bpm. After a 10-min rest, the mean bias is 0.24 bpm with 95% confidence interval −2.40 to 2.88 bpm. Moreover, significant correlation coefficients between both measurements are revealed in all states (Pearson's correlation, r 2 > 0.9, p < 0.01). Fig. 5A representative figure showing (a) a reduced frame (frame 49, t = 1 s) of experiment 1, (b) contact and imaging PPG signals, and (c) the corresponding TFR results. The upper TFR trace is from the noncontact iPPG, and the lower is from contact PPG with the color bar indicating the absolute power intensity. The signal is from subject 7 (Male, age = 55 yr) under rest condition. The position from which the iPPG signal was obtained is highlighted with a black box (1×1 pixels) and an arrow. 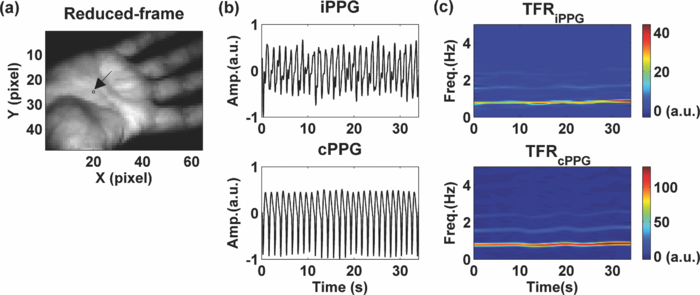 3.2.Experiment 2Figure 7 depicts a 12-min iPPG signal [Fig. 7b] extracted from the motion-compensated face images of one male subject who was asked to perform two sets of cycling exercise, continuously. The dashed vertical lines indicate different states (i.e., rest, ex1, ex2, and recovery). The region where the iPPG signal is obtained is shown as rectangular areas (10×5 pixels) on the forehead [Fig. 7a]. For qualification of the effectiveness of SCICA, three iPPG signals (duration = 15 s) were selected at random from data corresponding to the low, medium, and high motion conditions (i.e., rest, ex1 and ex2 respectively). SCICA was then used to extract physiological components from these signals. As can be seen in Fig. 7c, the physiological information (i.e., respiration and heart rate) is clearly exhibited in the iPPG signals from the motionless rest condition. Both RR and HR are more clearly visible in the extracted components obtained through SCICA. Compared to the rest condition, the oscillations of RR and HR in both ex1 and ex2 states are poorly represented due to the motion artifacts introduced by strenuous exercise. However, the two target components can be clearly identified after the extraction in both exercise conditions [Fig. 7c]. The selected segments in Fig. 7c are representative of the SCICA for the whole data set in each state. Fig. 7Representative figure showing (a) a reduced frame (frame 239, t = 12 s) under rest condition from experiment 2, (b) iPPG signal, and (c) the extracted physiological components for three randomly selected sets of iPPG signal under resting conditions (t = 65–80 s), exercise 1 (t = 275–290 s), and exercise 2 (t = 495–510 s). In the iPPG signal corresponding to the rest state, the respiration and the heart rate can be clearly observed. The region from which the iPPG signal is obtained is indicated with a black box (10×5 pixels) and an arrow. The position where the three sets of iPPG signal were selected is highlighted with three boxes.  The continuous nature of the extracted respiratory and pulsatile variation under different exercise conditions is depicted in Fig. 8. Here, the characteristics of the HR trend are very similar to the steady postexercise results in experiment 1, thereby supporting that the extracted components in Fig. 7 are true HR and RR. Compared to the rest condition, the RR and HR increase in both ex1 and ex 2 states. Specifically, at t = 3 min the subject was asked to perform a moderate cycling exercise at 15 km/h, the RR in the ex1 state is found to increase from 0.3 to 0.4 Hz [Fig. 8a]. Simultaneously, the HR gradually increases from 1.45 to ∼1.75 Hz after ∼15 s of cycling [Fig. 8b]. The high-intensity exercise (25 km/h) performed 3 min later resulted in a higher RR and HR. HR peaks at 2 Hz at the end of ex2 while the RR increases to 0.5 Hz. At t = 9 min, the subject stopped cycling and was asked to inhale and exhale deeply at a slow pace until t = 10.5 min, whereupon the subject was asked to breathe normally. During the subject's deep-breathing period, the TFR diagram reveals higher amplitude of RR as well as a gradually decreasing HR. At the end of monitoring, the subject appeared to recuperate from the physical exercise as both RR and HR returned to the rest level. 4.DiscussionThe performance of the iPPG system was evaluated by comparing it to a commercial pulse oximeter sensor. The strong correlation and good agreement between these two methods for PPG capturing signals indicate that the iPPG system can successfully obtain information about cardiovascular variables such as respiration and heart rate. The method applied in this study is well suited for motion-tolerant RR and HR measurements during exercise. The results of the second experiment verify the effectiveness of the proposed method for removing motion-associated noise even under physical exercise of high intensity. The optimal amount of exercise to maintain fitness and reduce mortality from cardiovascular disease remains a matter of debate. For instance, Lee showed that moderate-intensity exercise training was sufficient to produce substantial benefits,24 while Williams argued that high-intensity training produced proportionally greater effects.25 Developing a remote and reliable technique might help clinical professionals and biomedical researchers to evaluate and optimize the effects of exercise. In the present study, two different exercise levels, which represent moderate- and high-intensity exercise, respectively, were performed by 12 normotensive subjects. Compared to the resting condition, a gradual increase in SBP and HR was uncovered in the post-ex1 and post-ex2 states, which agrees well with previous studies.26, 27 Moreover, Bland-Altman analysis showed that the physiological signals obtained from the iPPG system were comparable to the commercial contact sensor; the maximum heart rate difference was <3 bpm in all states. The word “comparable” in clinical applications means that measurements by the two instruments should be sufficiently close, thereby not changing the actions and decisions regarding the patient.12 The clinically acceptable error of such measurements depends on the application (e.g., in the Emergency Severity Index triage, an adult patient with a heart rate of >100 bpm is considered to be tachycardic).28 In this case, a difference of <3 bpm (<3% error) obtained by our experimental remote iPPG system would be acceptable. Compared to the contact PPG sensor, the iPPG technique is still not extensively accepted in clinical applications mainly due to the problem of motion artifacts. One recent study7 reports attempts to remove/attenuate the motion artifacts from iPPG signals. The method was based on automatic face tracking and blind source separation of multichannel signals (i.e., R, G, and B color signals) into independent components. The motion artifacts evaluated were typically slow and relatively small movements, such as tilting the head sideways, nodding the head, or looking up/down. Although such an approach is not suitable for the present study (monochrome camera), the pioneering research in Ref. 7 attempts an alternative approach to compensate for motion for a more effective extraction of physiological variables. Specifically, in the present study, after a sequence of images was recorded, motion compensation techniques (2-D cross correlation) were first employed to bring successive images into spatial alignment. This approach removes most of the motion artifacts and results in accurate and reliable data. The desired physiological measurements (i.e., heart and respiration rates) can then be extracted through blind source separation (SCICA in this study). With the help of this novel approach, continuous pulsatile and respiratory variations were successfully traced under different exercise levels, producing results that were consistent with those obtained in experiment 1. This study addresses the planar motion artifact in pulse waveforms acquired from iPPG. Cross-correlation measures the degree of similarity between an image and a template. In the present study, a user-defined region is employed and serves as a template for image coordinate transformation which assumes that the two images differ only by a 2-D translation. In experiment 2, the participant was free to move his body during exercise while remaining seated to minimize the swaying of body and maintaining the direction of his face toward the camera to attenuate the nonplanar motion. Typical movements included lateral tilting of the head (where the amplitude increased with exercise intensity), and mild leaning of the body (and hence the head) toward/away from the camera due to deep breathing. Involuntary motion artifacts are inherently complex and cannot be completely removed through 2-D cross-correlation. However, the primary application introduced in this paper is to extract useful physiological variables from the images recorded during exercise. Furthermore, frame numbers in the long-term monitoring could be huge (e.g., 14,400 frames for 12-min recording at 20 fps). In this study, therefore, the motion artifact reduction technique should be simple as well as accurate. Another limitation is the determination of the extracted independent components. As can be seen in Fig. 7c, the physiological waveforms are not constant in the extracted components under different conditions (e.g., the pulsatile signals are recovered in IC#4 in the rest state while in IC#7 and IC#11 in ex1 and ex2, respectively). 5.ConclusionThe emerging field of imaging PPG technologies offers some nascent opportunities in effective and comprehensive interpretation of the physiological parameters (e.g., heart/respiratory rate, tissue blood perfusion, and arterial oxygen saturation distributions), indicating a promising alternative to conventional contact PPG. In the present study, we have described, implemented, and evaluated a novel imaging PPG methodology for the recovery of physiological parameters from different anatomical locations under various conditions. The results of this study have demonstrated that the clinical assessment of vital signs could be remotely assessed in situations of significant motion, thus supporting its use in new applications such as triage and sports training. Further development of a fully automated physiological parameters extraction technique is a subject of a future study. A further study is also needed to assess the performance of the system with a larger number of subjects. AcknowledgmentsThe authors thank the NIHR, UK (Grant No. FPD1 II-FS-0109-11005) for their financial support and also are grateful to Loughborough University and Shanghai Jiao Tong University for their support. ReferencesJ. Allen,
“Photoplethysmography and its application in clinical physiological measurement,”
Physiol. Meas., 28
(3), R1
–39
(2007). https://doi.org/10.1088/0967-3334/28/3/R01 Google Scholar
A. B. Hertzman,
“Photoelectric plethysmography of the fingers and toes in man,”
Exp. Biol. Med., 37
(3), 529
–534
(1937). https://doi.org/10.3181/00379727-37-9630 Google Scholar
X. F. Teng and
Y. T. Zhang,
“The effect of contacting force on photoplethysmographic signals,”
Physiol. Meas., 25
(5), 1323
–1335
(2004). https://doi.org/10.1088/0967-3334/25/5/020 Google Scholar
M. Hulsbusch and
V. Blazek,
“Contactless mapping of rhythmical phenomena in tissue perfusion using PPGI,”
Proc. SPIE, 4683 110
–117
(2002). https://doi.org/10.1117/12.463573 Google Scholar
F. P. Wieringa, F. Mastik, and
A. F. W. van der Steen,
“Contactless multiple wavelength photoplethysmographic imaging: a first step toward ‘SpO(2) camera’ technology,”
Ann. Biomed. Eng., 33
(8), 1034
–1041
(2005). https://doi.org/10.1007/s10439-005-5763-2 Google Scholar
W. Verkruysse, L. O. Svaasand, and
J. S. Nelson,
“Remote plethysmographic imaging using ambient light,”
Opt. Express, 16
(26), 21434
–21445
(2008). https://doi.org/10.1364/OE.16.021434 Google Scholar
M. Z. Poh, D. J. McDuff, and
R. W. Picard,
“Non-contact, automated cardiac pulse measurements using video imaging and blind source separation,”
Opt. Express, 18
(10), 10762
–10774
(2010). https://doi.org/10.1364/OE.18.010762 Google Scholar
S. W. Farrell, J. B. Kampert, H. W. Kohl, C. E. Barlow, C. A. Macera, R. S. Paffenbarger Jr., L. W. Gibbons, and
S. N. Blair,
“Influences of cardiorespiratory fitness levels and other predictors on cardiovascular disease mortality in men,”
Med. Sci. Sports Exerc, 30
(6), 899
–905
(1998). https://doi.org/10.1097/00005768-199806000-00019 Google Scholar
F. Quigley,
“A survey of the causes of sudden death in sport in the Republic of Ireland,”
Br. J. Sports Med., 34
(4), 258
–261
(2000). https://doi.org/10.1136/bjsm.34.4.258 Google Scholar
K. Iwasaki, R. Zhang, J. H. Zuckerman, and
B. D. Levine,
“Dose-response relationship of the cardiovascular adaptation to endurance training in healthy adults: how much training for what benefit,”
J. Appl. Physiol., 95
(4), 1575
–1583
(2003). https://doi.org/10.1152/japplphysiol.00482.2003 Google Scholar
J. Zheng, S. Hu, V. Azorin-Peris, A. Echiadis, V. Chouliaras, and
R. Summers,
“Remote simultaneous dual wavelength imaging photoplethysmography: a further step towards 3-D mapping of skin blood microcirculation,”
Proc. SPIE, 6850 68500S
(2008). https://doi.org/10.1117/12.761705 Google Scholar
K. Humphreys, T. Ward, and
C. Markham,
“Noncontact simultaneous dual wavelength photoplethysmography: a further step toward noncontact pulse oximetry,”
Rev. Sci. Instrum., 78
(4), 044304
(2007). https://doi.org/10.1063/1.2724789 Google Scholar
G. Cennini, J. Arguel, K. Aksit, and
A. van Leest,
“Heart rate monitoring via remote photoplethysmography with motion artifacts reduction,”
Opt. Express, 18
(5), 4867
–4875
(2010). https://doi.org/10.1364/OE.18.004867 Google Scholar
B. S. Kim and
S. K. Yoo,
“Motion artifact reduction in photoplethysmography using independent component analysis,”
IEEE Trans. Biomed. Eng., 53
(3), 566
–568
(2006). https://doi.org/10.1109/TBME.2005.869784 Google Scholar
C. J. James and
D. Lowe,
“Extracting multisource brain activity from a single electromagnetic channel,”
Artif. Intell. Med., 28
(1), 89
–104
(2003). https://doi.org/10.1016/S0933-3657(03)00037-X Google Scholar
C. J. James, O. Gibson, and
M. Davies,
“On the analysis of single versus multiple channels of electromagnetic brain signals,”
Artif. Intell. Med., 37
(2), 131
–143
(2006). https://doi.org/10.1016/j.artmed.2006.03.003 Google Scholar
J. B. Maintz and
M. A. Viergever,
“A survey of medical image registration,”
Med. Image Anal., 2
(1), 1
–36
(1998). https://doi.org/10.1016/S1361-8415(01)80026-8 Google Scholar
L. Brown,
“A survey of image registration techniques,”
ACM Comput. Surv. (CSUR), 24
(4), 325
–376
(1992). https://doi.org/10.1145/146370.146374 Google Scholar
D. I. Barnea and
H. F. Silverman,
“A class of algorithms for fast digital image registration,”
IEEE Trans. Comput., 100
(2), 179
–186
(1972). https://doi.org/10.1109/TC.1972.5008923 Google Scholar
M. E. Davies and
C. J. James,
“Source separation using single channel ICA,”
Signal Process., 87
(8), 1819
–1832
(2007). https://doi.org/10.1016/j.sigpro.2007.01.011 Google Scholar
F. Hlawatsch and
G. F. Boudreaux-Bartels,
“Linear and quadratic time-frequency signal representations,”
IEEE Signal Proc. Mag., 9
(2), 21
–67
(1992). https://doi.org/10.1109/79.127284 Google Scholar
S. Qian and
D. Chen,
“Joint time-frequency analysis,”
IEEE Signal Process. Mag., 16
(2), 52
–67
(1999). https://doi.org/10.1109/79.752051 Google Scholar
J. M. Bland and
D. G. Altman,
“Statistical methods for assessing agreement between two methods of clinical measurement,”
Lancet, 1
(8476), 307
–310
(1986). https://doi.org/10.1016/S0140-6736(86)90837-8 Google Scholar
I. M. Lee, C. C. Hsieh, and
R. S. Paffenbarger,
“Exercise intensity and longevity in men—the Harvard Alumni Health Study,”
J. Am. Med. Assoc., 273
(15), 1179
–1184
(1995). https://doi.org/10.1001/jama.273.15.1179 Google Scholar
P. T. Williams,
“Relationships of heart disease risk factors to exercise quantity and intensity,”
Arch. Intern. Med., 158
(3), 237
–245
(1998). https://doi.org/10.1001/archinte.158.3.237 Google Scholar
M. S. Lauer, P. M. Okin, M. G. Larson, J. C. Evans, and
D. Levy,
“Impaired heart rate response to graded exercise. Prognostic implications of chronotropic incompetence in the Framingham Heart Study,”
Circulation, 93
(8), 1520
–1526
(1996). https://doi.org/10.1161/01.CIR.93.8.1520 Google Scholar
L. Wang, E. Pickwell-MacPherson, Y. P. Liang, and
Y. T. Zhang,
“Noninvasive cardiac output estimation using a novel photoplethysmogram index,”
1746
–1749
(2009). https://doi.org/10.1109/IEMBS.2009.5333091 Google Scholar
P. Tanabe, R. Gimbel, P. R. Yarnold, D. N. Kyriacou, and
J. G. Adams,
“Reliability and validity of scores on The Emergency Severity Index version 3,”
Acad. Emerg. Med., 11
(1), 59
–65
(2004). https://doi.org/10.1197/j.aem.2003.06.013 Google Scholar
|