|
|
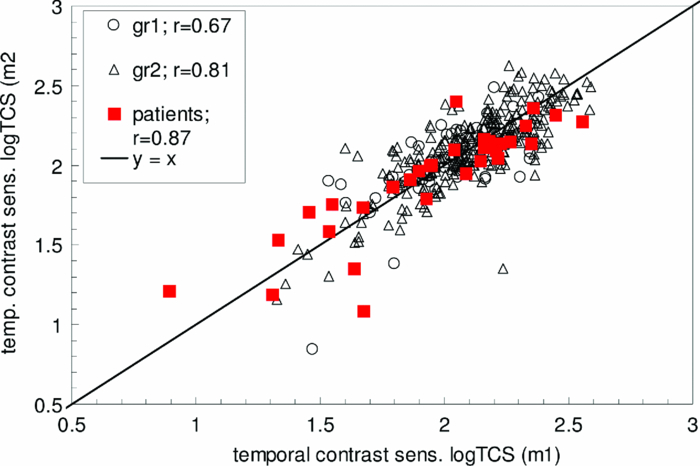
1.IntroductionA few years ago, Oculus launched an instrument for assessing straylight in a patient's eye—the C-Quant. Straylight is the functional result of entoptic light scattering, and the standard for disability glare according to the definition by the Commission International d’Eclairage, an international standards committee, known, e.g., from the V λ curve and the chromaticity diagram.The C-Quant is based on the equivalence principle, i.e., identity between straylight and a reference light. To establish identity, it employs flicker in a 2AFC (two alternative forced choice) procedure. This paper describes the use of this instrument to assess flicker sensitivity, relevant for checking the subjects’ capability to perform the straylight test, and as a test for retinal integrity for clinical purposes. Visual function depends on the quality of eye optics, retinal functioning, and higher order processing. If any of these degrade, visual function overall degrades. Tests for examining the nonneuronal aspect of the eye, i.e., the optical eye media, are slit lamp observation and LOCS III classification, or more objective and quantitative techniques such as aberrometry and straylight measurement. The latter have been very successful in explaining the defects in visual function.1, 2, 3, 4 The optical parts of the eye are relatively easy to quantitatively assess. This is contrary to retinal or higher neuronal functioning, where neuronal signal transduction may be impaired and assessment of their signal transduction more difficult. Originally,5 spatial contrast sensitivity testing was used to better assess neuronal function, since visual acuity strongly depends on optical factors. However, spatial contrast sensitivity, even at the lower spatial frequencies, is also confounded by the optics of the eye.6 Flicker sensitivity was then proposed as a technique to better isolate neuronal function, without the confounding effects of the eye optics.7, 8, 9 Flicker sensitivity or temporal contrast sensitivity (TCS) testing is a relatively easy technique. 10, 11, 12, 13, 14, 15, 16 As early as the 1950s and 60s, De Lange17 and Kelly18 introduced important concepts, such as the modulation transfer function of the eye. When a sinusoidal signal is presented to the eye, the neuronal output would be a sinusoidal signal at the same frequency, with a shift in phase and different amplitude. The threshold amplitude as a function of frequency results in a so called “de Lange curve,” which has a peak sensitivity between 5 and 10 Hz at (low) photopic levels for fields of a few degrees.17 In the healthy population, the TCS as a function of age shows three phases.19, 20 The first phase, where the TCS increases, is up to an age of approximately 16 years. From 16 to 60 years, the TCS is relatively constant. After the age of 60 years the TCS goes into decline.19 In retinal disorders the neuronal signal transduction can be impaired, which may result in a reduction of TCS.5, 21 Reduction in TCS has been observed in cases of retinitis pigmentosa (RP),13, 14, 22 glaucoma,15, 23 and age-related maculopathy (ARM).16 Although the concept of TCS has been around for decades and several studies have shown the usefulness of TCS in cases of affected retinal function, this has not yet resulted in a wide use. Clinical devices facilitating flicker or temporal modulation perimetry for testing the visual field were developed.24, 25, 26 Since these devices map retinal deficiencies over the visual field, their measurements tend to be more elaborate and time consuming than a foveal (<2º) TCS measurement, as discussed in the present paper, with the drawback that retinal deficiencies in the periphery are not assessed. The C-Quant device for measuring ocular straylight uses a psychophysical approach with flickering stimuli. In the present study, an adaptation of this device was used to develop TCS measurements with reliability control using the experience of the straylight approach, and to establish a normal reference set. 2.Materials and Methods2.1.Psychophysical ProcedureSoftware was written in MATLAB to allow TCS measurements with the standard C-Quant device. Procedures are similar to those for straylight measurement.27, 28 Stimulus consisted of a circular test area with a diameter of 3.3 deg divided in two halves, surrounded by an area of constant luminance. The average (white) luminance of both halves and the surround was 25 cd m−2. The TCS was determined at 8 Hz, the frequency where flicker sensitivity is at its maximum for this luminance level, with square wave form improving the sensitivity further—by 0.1 log units—because a square wave contains 4/π times more of the fundamental harmonic. The 8 Hz flicker was randomly applied to one of the two halves of the test area for a maximum of 6 s. This allows a 2AFC method, where the subject has to indicate, usually within 2 s, by pressing one of two buttons, in which half of the test area the flicker is present. An adaptive psychophysical procedure, according to the nonparametric stochastic approximation method,29 was used to determine the flicker threshold. The Michelson contrast definition was used, and TCS was defined as 1/threshold contrast. Starting with a stimulus of log contrast = 0 (100% contrast), stimuli were generated according to Treutwein's formula 15 (Ref. 29) with target probability φ = 0.75, and initial step size c = 5. The number of trials per measurement was 35, with the exception of 95 eyes where the number of trials per measurement was 25. In the latter case, the trials of 2 measurements were interwoven and presented as a single measurement of 50 (2×25 interwoven) trials. Every correct answer led to a decrement in temporal contrast, whereas wrong answers resulted in an increment of temporal contrast. The binary (0–1) answers of 35 (or 2×25) trials were analyzed using a maximum likelihood analysis28 to determine the best estimate for temporal contrast sensitivity (threshold), assuming a cumulative Gaussian psychometric function with fixed steepness parameter β = 1/σ = 7 (Strasburger,30 formula 17), and lapse rate δ = 0.02. 2.2.Reliability (“unc”)As Harvey31 suggested, the width of the peak in the likelihood function can be used as a reliability measure. The uncertainty (unc) was determined by the same method as described by Coppens 28 with unc based in the present study on three confidence levels corresponding to 1, 2, and 3 times the standard deviation in the case of a pure Gaussian function (at 0.607, 0.135, and 0.0111 from the top). An unc < 0.15 log unit was chosen as reliability criterion below which the TCS measurements were considered sufficiently reliable. 2.3.Procedure and PopulationThree groups were studied, one eye per subject in the vast majority: group 1 was tested with a try-out design, and consisted of 95 eyes; groups 2 and 3 were tested with the final design. Group 2 was a nonclinical group of 372 eyes, and group 3 was a clinical group of 33 eyes. Groups 1 and 2 were collected in science fair settings. Group 3 was from part of an RP study of the Rotterdam Ophthalmic Institute. Group 3 was only included to study the reliability of the present test. In groups 1 (all 95 eyes), 2 (279 eyes), and 3 (31 eyes), repeated measurements were performed to determine the reliability of the TCS measurement and to validate the value of the unc parameter. Group 1 was from a try-out period with 2×25 stimuli in an interwoven fashion. In the other two groups, the repeated measurements were done as two separate recordings of 35 stimuli each. Groups 1 and 2 were used as reference. Subjects with known or suspected retinal conditions were excluded. Measurements with unc > 0.15 were omitted. The average age was 52 ± 22 years (6 to 85 years). In addition to the population study, two healthy subjects underwent measurements to investigate the possible influence of two types of optical impairments on the TCS outcome, straylight, and defocus. The measurements were repeated 3 times. Straylight was artificially varied by placing a range of scattering filters (n = 7), normally used in photography, in front of the eye during the TCS measurement, as described before.32 These scattering filters were: Black Pro Mist (BPM) 1&2 (Tiffen, Hauppauge, New York), B+W fog filters (BWF) 1&2 (Schneider Optics, Hauppauge, New York), P087 (Cokin, Rungis Cedex, France), and SO (Stereo Optical Co., Inc., Chicago). The log(s) values for the scattering filters used in this project were separately measured and found to be 1.05 (BPM1), 1.19 (BPM2), 1.27 (BPM2), 1.53 (BWF1), 1.74 (BWF2), 1.41 (P087), 2.11 (SO), and 2.34 (SO+BWF1+BWF2). Inserted before the eyes of the test subjects, this resulted in a straylight range of log(s) = 1.39 to 2.44. In the case of the BPM2 filter, considered to best represent early cataract,32 two different filters were used. There is a slight difference in log(s) values between the two BPM2 filters, possibly due to variation between batches. Defocus was achieved by placing a spherical convex lens with power of 1 to 6 dpt in front of the emmetropic eye during TCS measurements. In a separate measurement series, visual acuity values were assessed for both subjects with each of the six defocus lenses. The study followed the guidelines of the Declaration of Helsinki regarding research in human subjects, and institutional review board permission was obtained. 3.ResultsIn group 1, the time needed to perform the test for a single eye was measured and found to be 121±23 (mean ± s.d.) s for a measurement of 2×25 stimuli in a single eye. It would thus take approximately 5 min to test both eyes. Figure 1 shows the comparison between the two repeated measurements for each of the 3 groups, and with application of the reliability criterion unc < 0.15, leading to 70, 259, and 31 pairs of observations, respectively, for groups 1, 2, and 3. Average values for second minus first logTCS were 0.013, −0.001, and −0.025, with repeated measures standard deviations (rmsd) = 0.11, 0.11, and 0.14, respectively, for groups 1, 2, and 3. Figure 2 shows the psychometric curve resulting from all 280 assessments in groups 2 and 3 with 2×35 trials and mean unc < 0.15, for 560 series in total. For proper averaging, all series needed to be shifted along the stimulus [log(C)] axis to compensate for differences in threshold value. For this reason, they were pooled after registration according to their 75% points, resulting from the fitting as described in Sec. 2. Since it must be anticipated (see Ref. 28 for discussion of bias to be anticipated in pooling psychometric data) that this process results in a curve that is too steep, the same data were also pooled after registration according to the 75% point of the fellow series. Such pooling must be anticipated28 to give a curve that is too shallow. A third way of registration was thus used, based on the average of both 75% points. This yielded the results denoted with symbols in Fig. 2. The largest symbol [at log(C) = 0, corresponding with the 75% point] contains 3081 responses, the smallest symbol [at log(C) = 1] contains 130 responses. The thick line is the psychometric function that best fits the symbols, with β = 6.7 and δ = 0.009. Fig. 2Psychometric function for the proposed technique, based on 280 repeated measurements (2×280×35 = 19,600 responses). Two thin lines and symbols give averaged data according to 3 different ways to register the individual results, explained in the text. The thick line is the best fitting cumulative Gaussian function.  Figure 3 shows an example of a measurement, with (top) the fit of the psychometric function to the data, and (bottom) the corresponding likelihood function. Fig. 3Example of a TCS recording. Top: Crosses are the responses given, the line is the psychometric function fitted (shifted). Bottom: The likelihood function peaking at 2.15, used for placement of the psychometric function in the top figure. The 3 horizontal gray lines used for calculating unc are placed at 0.607, 0.135, and 0.0111, corresponding 1, 2, and 3 times sigma in case of a pure Gaussian likelihood function. The dashed line is a Gaussian with the same peak and sigma = unc.  Figure 4 shows the true repeated measures standard deviation as a function of the psychometrically estimated uncertainty unc for each of the 3 groups, with all repeated measurements included. Note that in this case the data were of course not selected based on unc < 0.15. The data were sorted based on the average unc of 2 measurements and subsequently, the data were split into clusters of about equal numbers of measurements, 10 clusters for the 2 normal populations, and 1 cluster for the patient population. For each cluster, the root mean square of the 2-measurements standard deviations and of the unc values was calculated. The diagonal line represents the line of equality between SD and unc. It must be considered a coincidence that the patient group is so close to the y = x line. Fig. 4True repeated measures standard deviation compared to the psychophysically estimated uncertainty unc. Each datapoint represents an average over about 30 eyes (diamonds, group 2, and squares, group 3 patients) or 10 eyes (circles, group 1).  Figure 5 shows the results of TCS measurements as a function of (increased) straylight by using different scattering filters to artificially increase the straylight value of the eye. Average data and standard deviations for two healthy subjects are shown measured 3 times. The left-most data point is for the naked eye. Only for the 2 highest straylight values a decrease in TCS measurement value is seen. These straylight values are at the upper limit of the measurement range of the C-Quant, and are seldom encountered clinically. Fig. 5Recordings of log temporal contrast sensitivity, compared to straylight levels artificially raised with light scatter filters in front of the eye. Each point gives the average over 6 measurements (2 subjects, 3 repeats). The leftmost point is for the naked eye. Errorbars represent standard deviation.  Figure 6 shows the results of TCS measurements as a function of visual acuity, artificially lowered by using spherical trial lenses. Data for the same two subjects of Fig. 5 is shown. The left-most point is for the naked eye. A decrease in the TCS measurement value is only seen at visual acuities as low as logMAR = 1.26–1.36, which is more than a tenfold decrease in visual acuity. Fig. 6Recordings of log temporal contrast sensitivity, compared to visual acuity artificially worsened with defocusing lenses in front of the eye. Each point gives the average over 6 measurements (2 subjects, 3 repeats). The leftmost point is for the naked eye. Errorbars represent standard deviation.  Figure 7 shows the measured TCS values for all reference eyes in groups 1 and 2 with unc < 0.15, as a function of age. The data shows an increase in TCS at low ages, then a plateau, and a decrease at high ages. As a rough approximation for a model, the data are fitted with 3 line segments, connected at 16 and 60 years of age. The fitted slopes are 0.034 and -0.013 log unit/year, respectively. The residual error is 0.18 log units. 4.DiscussionThe aims of this study are 1. to assess a subject's capability to perform a straylight test and 2. to investigate the psychophysics, reliability, and population values of a flicker sensitivity test (temporal contrast sensitivity or TCS). The straylight test is based on establishing identity between two simultaneously presented flickering stimuli whose modulation varies. An unreliable straylight measurement may be due to causes that are directly solvable, such as the measurement procedure requiring a better explanation, or a physical problem, such as a retinal disorder that reduces TCS. If it is suspected that a subject is unable to perform the straylight test due to a retinal disorder, a TCS measurement could confirm this. Using the reliability parameter unc, repeated measures standard deviation of the test proved to be 0.11 to 0.14 log units (Fig. 1). This level of accuracy falls well within the normal population standard deviation of 0.18 log units, indicating that, apart from the reported age effects, there may be differences in the normal population. The psychometric function proved to correspond closely to the cumulative Gaussian chosen as a model (Fig. 2). The psychometrically estimated unc values are similar to true repeated measures standard deviations (Fig. 4), and are used as a reliability parameter for single TCS measurements. The C-Quant straylight measurement employs a 2AFC design, favored for its psychophysical robustness. It is also used in the flicker test. An essential difference in the flicker test is that it uses stimuli around the threshold for visibility, whereas straylight measurement is based on suprathreshold stimuli. The psychometric function (Fig. 2) is therefore essentially different from that for straylight.27, 28, 33, 34 Please note that in both cases, the key point of the psychometric function is the inflection point, which is the point with the steepest slope, close to the 50% value for straylight and 75% for flicker threshold. For the flicker test, one side of the inflection point of the psychometric function corresponds with random guessing (50%), whereas in the straylight test both sides of the (inflection point of the) psychometric function have close to perfect (0% or 100%) scores. The likelihood function for the flicker test (Fig. 3) is therefore less steep on one side, and as a consequence the outcome value is less precise. Added to this is a difference in steepness between the two psychometric functions. Another difference worth mentioning is potential bias in the case of a threshold test (the flicker test in this case). Although the 2AFC method is known for its superiority to avoid bias linked to patient cooperation, it cannot be considered completely free of such an influence. If the patient does not do his/her utmost to discover the side with flicker, the recorded threshold will increase. Some of the relatively low data points in Fig. 7 could therefore be due to a lack of concentration on the subjects’ part. Straylight measurement, however, precludes bias influence because the straylight test is not a threshold test, but a test to establish the point of identity between two stimuli. Two identical stimuli will be identical no matter the subjects’ efforts. To establish the point of identity suprathreshold stimuli are used. This was studied systematically by Coppens 33 Highly erratic patient responses will adversely affect precision, but randomly, and detectable through the reliability parameter.33 Artificial deterioration of the quality of eye optics was found to have no effect on the TCS values for more than a tenfold decrease in visual acuity or a tenfold increase in straylight (Figs. 5, 6). This is in agreement with other studies testing the potential effects of optical disturbances on the outcome of flicker tests: comparing normal individuals and individuals with media opacities, such as cataract,10, 11 comparing before and after cataract extraction,9, 35 and comparing differences in refraction correction.35 Several (flicker) perimetry studies show systematical variation between measurements and it is suggested that these are learning and fatigue effects.36, 37, 38, 39 However, for single frequency temporal contrast measurements, it is mentioned that fatigue effects are small, due to the relative simplicity and short duration (a few minutes) of the measurement.12 In addition, the 2AFC method applied in this study shows no learning effects, i.e., there is no systematical difference between subsequent measurements, as can be seen in Fig. 1. In numerous studies, patients with different retinal diseases showed reduced flicker sensitivities. 5, 10, 11, 12, 13, 14, 15, 16, 21, 22, 23, 40, 41, 42, 43 It has been suggested that flicker sensitivity may help to detect early glaucoma and should therefore be part of routine testing.10, 11, 12 Flicker sensitivity is also discriminative for ARM, the early stage of which is thought to reduce sensitivity in the mid-frequency range.16, 41, 42, 43 Furthermore, also in RP reduced temporal contrast sensitivity is observed.13, 14, 22 However, measuring at a single frequency poses a limitation in cases when retinal disorders have patterns of frequency selective loss outside the single measured frequency of 8 Hz. In correspondence with earlier studies,19, 44 the normal population—-with ages ranging from 6 to 85 years—shows a slight tendency toward lower TCS values in the older (>60 yrs) and younger (<16 yrs) age ranges. Studies regarding foveal development show that at the age of 4 years, some aspects in the fovea, such as outer segment length of the cones and cone packing density, are not yet fully developed.45 It is suggested that development of temporal contrast sensitivity relates to photoreceptor packing density and the amount of correctly functioning photoreceptors.14 Based on foveal development in nonhuman primates, it has been concluded that cone density will continue to increase up to 8 years of age.46 This may be related to the slightly lower TCS values for the younger subjects (Fig. 7). When fully developed, there are large interindividual variations in foveal cone density that may be related to the population spreading shown in Fig. 7. For healthy individuals, the cone density remains constant as a function of age.47 Figure 7 shows an effect of high age on TCS. Loss of sensitivity at older ages may partially be related to reduced retinal illumination due to the reduction of the pupil area with age48, 49 and an increase in absorption.50 The effect may be significant at high frequencies and small at middle frequencies as used here.17, 18 The literature suggests such corrections to be small indeed, and after correction for pupil size, a loss of 0.17 log units at the age of 70 remained.19 To reduce variation, a correction can be made for the pupil size,10, 11, 12, 16, 19, 48 or a fixed size artificial pupil can be placed in front of the eye.51 A study is needed to assess, in detail, the potential retinal intensity effects for the present test.16, 19, 48, 51 In conclusion, this study shows the ability of an existing clinical device to facilitate reliable flicker sensitivity (TCS) measurements. The outcome was independent of optical blur and light scattering, up to a tenfold decrease in visual acuity and a tenfold increase in straylight. The current clinical instrument opens the possibility of including TCS threshold measurements as an additional (supplementary) method in routine testing for retinal or optic nerve disorders in the ophthalmological practice. AcknowledgmentsUse of psychophysical data from the first group of patients in an ongoing RP study carried out by Maartje van Bree and colleagues from the Rotterdam Ophthalmological Institute and Eye Clinic is gratefully acknowledged. The Royal Academy owns a patent on straylight measurement, which it licenses to Oculus GmbH for the C-Quant instrument. ReferencesA. B. Watson, A. J. Ahumada Jr.,
“Predicting visual acuity from wavefront aberrations,”
J. Vis., 8 17
–19
(2008). https://doi.org/10.1167/8.4.17 Google Scholar
J. D. Marsack, L. N. Thibos, and
R. A. Applegate,
“Metrics of optical quality derived from wave aberrations predict visual performance,”
J. Vis., 4 322
–328
(2004). https://doi.org/10.1167/4.4.8 Google Scholar
L. N. Thibos, R. A. Applegate, and
S. Marcos,
“Aberrometry: the past, present, and future of optometry,”
Optom. Vis. Sci., 80 1
–2
(2003). https://doi.org/10.1097/00006324-200301000-00001 Google Scholar
T. J. T. P. van den Berg, L. Franssen, and
J. E. Coppens,
“Straylight in the human eye: testing objectivity and optical character of the psychophysical measurement,”
Ophthalmic Physiol. Opt., 29 345
–350
(2009). https://doi.org/10.1111/j.1475-1313.2009.00638.x Google Scholar
I. Bodis-Wollner,
“Detection of visual defects using the contrast sensitivity function,”
Int. Ophthalmol. Clin., 20 135
–153
(1980). https://doi.org/10.1097/00004397-198002010-00007 Google Scholar
R. L. Woods, N. C. Strang, and
D. A. Atchison,
“Measuring contrast sensitivity with inappropriate optical correction,”
Ophthalmic Physiol. Opt., 20 442
–451
(2000). https://doi.org/10.1046/j.1475-1313.2000.00525.x Google Scholar
M. Vianya-Estopa, W. A. Douthwaite, B. A. Noble, and
D. B. Elliott,
“Capabilities of potential vision test measurements: clinical evaluation in the presence of cataract or macular disease,”
J. Cataract Refract. Surg., 32 1151
–1160
(2006). https://doi.org/10.1016/j.jcrs.2006.01.111 Google Scholar
M. Vianya-Estopa, W. A. Douthwaite, K. Pesudovs, B. A. Noble, and
D. B. Elliott,
“Development of a critical flicker/fusion frequency test for potential vision testing in media opacities,”
Optom. Vis. Sci., 81 905
–910
(2004). Google Scholar
A. G. Junemann, F. K. Horn, P. Martus, and
M. Korth,
“The full-field temporal contrast sensitivity test for glaucoma: influence of cataract,”
Graefes Arch. Clin. Exp. Ophthalmol., 238 427
–432
(2000). https://doi.org/10.1007/s004170050374 Google Scholar
F. K. Horn, M. Korth, and
P. Martus,
“Quick full-field flicker test in glaucoma diagnosis: correlations with perimetry and papillometry,”
J. Glaucoma., 3 206
–213
(1994). https://doi.org/10.1097/00061198-199400330-00005 Google Scholar
F. K. Horn, I. M. Velten, A. Junemann, and
M. Korth,
“The full-field flicker test in glaucomas: influence of intraocular pressure and pattern of visual field losses,”
Graefes Arch. Clin. Exp. Ophthalmol., 237 621
–628
(1999). https://doi.org/10.1007/s004170050288 Google Scholar
N. X. Nguyen, F. K. Horn, B. Seitz, C. Cursiefen, P. Martus, A. Langenbucher, and
M. Kuchle,
“Temporal contrast sensitivity using full-field flicker test (Erlangen flicker test) in patients after penetrating keratoplasty,”
Graefes Arch. Clin. Exp. Ophthalmol., 240 443
–447
(2002). https://doi.org/10.1007/s00417-002-0456-0 Google Scholar
G. Dagnelie and
R. W. Massof,
“Foveal cone involvement in retinitis pigmentosa progression assessed through psychophysical impulse response parameters,”
Invest. Ophthalmol. Vis. Sci., 34 243
–255
(1993). Google Scholar
J. Felius and
W. H. Swanson,
“Photopic temporal processing in retinitis pigmentosa,”
Invest. Ophthalmol. Vis Sci., 40 2932
–2944
(1999). Google Scholar
M. E. Breton, T. W. Wilson, R. Wilson, G. L. Spaeth, and
T. Krupin,
“Temporal contrast sensitivity loss in primary open-angle glaucoma and glaucoma suspects,”
Invest. Ophthalmol.Vis Sci., 32 2931
–2941
(1991). Google Scholar
M. J. Mayer, S. J. Spiegler, B. Ward, A. Glucs, and
C. B. Kim,
“Mid-frequency loss of foveal flicker sensitivity in early stages of age-related maculopathy,”
Invest. Ophthalmol. Vis. Sci., 33 3136
–3142
(1992). Google Scholar
D. Z. N. De lange,
“Research into the dynamic nature of the human fovea-cortex systems with intermittent and modulated light. I. Attenuation characteristics with white and colored light,”
J. Opt. Soc. Am., 48 777
–784
(1958). https://doi.org/10.1364/JOSA.48.000777 Google Scholar
D. H. Kelly,
“Visual response to time-dependent stimuli. I. Amplitude sensitivity measurements,”
J. Opt. Soc. Am., 51 422
–429
(1961). https://doi.org/10.1364/JOSA.51.000422 Google Scholar
C. B. Kim and
M. J. Mayer,
“Foveal flicker sensitivity in healthy aging eyes. II. Cross-sectional aging trends from 18 through 77 years of age,”
J. Opt. Soc. Am. A Opt. Image Sci. Vis., 11 1958
–1969
(1994). https://doi.org/10.1364/JOSAA.11.001958 Google Scholar
C. W. Tyler,
“Two processes control variations in flicker sensitivity over the life span,”
J. Opt. Soc. Am. A., 6 481
–490
(1989). https://doi.org/10.1364/JOSAA.6.000481 Google Scholar
F. W. Campbell,
“Why do we measure contrast sensitivity?,”
Behav. Brain Res., 10 87
–97
(1983). https://doi.org/10.1016/0166-4328(83)90154-7 Google Scholar
C. W. Tyler, W. Ernst, and
A. L. Lyness,
“Photopic flicker sensitivity losses in simplex and multiplex retinitis pigmentosa,”
Invest. Ophthalmol. Vis. Sci., 25 1035
–1042
(1984). Google Scholar
C. W. Tyler,
“Specific deficits of flicker sensitivity in glaucoma and ocular hypertension,”
Invest. Ophthalmol. Vis. Sci., 20 204
–212
(1981). Google Scholar
P. G. Spry, C. A. Johnson, S. L. Mansberger, and
G. A. Cioffi,
“Psychophysical investigation of ganglion cell loss in early glaucoma,”
J. Glaucoma., 14 11
–19
(2005). https://doi.org/10.1097/01.ijg.0000145813.46848.b8 Google Scholar
A. J. Vingrys and
K. Pesudovs,
“Localized scotomata detected with temporal modulation perimetry in central serous chorioretinopathy,”
Aust. N. Z. J. Ophthalmol., 27 109
–116
(1999). https://doi.org/10.1046/j.1440-1606.1999.00158.x Google Scholar
B. J. Lachenmayr, S. M. Drance, G. R. Douglas, and
F. S. Mikelberg,
“Light-sense, flicker and resolution perimetry in glaucoma: a comparative study,”
Graefes Arch. Clin. Exp. Ophthalmol., 229 246
–251
(1991). https://doi.org/10.1007/BF00167877 Google Scholar
L. Franssen, J. E. Coppens, and
T. J. T. P. van den Berg,
“Compensation comparison method for assessment of retinal straylight,”
Invest. Ophthalmol. Vis. Sci., 47 768
–776
(2006). https://doi.org/10.1167/iovs.05-0690 Google Scholar
J. E. Coppens, L. Franssen, L. J. van Rijn, and
T. J. T. P. van den Berg,
“Reliability of the compensation comparison stray-light measurement method,”
J. Biomed. Opt., 11 34027
(2006). https://doi.org/10.1117/1.2209555 Google Scholar
B. Treutwein,
“Adaptive psychophysical procedures,”
Vis. Res., 35 2503
–2522
(1995). https://doi.org/10.1016/0042-6989(95)00016-S Google Scholar
H. Strasburger,
“Converting between measures of slope of the psychometric function,”
Percept. Psychophys., 63 1348
–1355
(2001). https://doi.org/10.3758/BF03194547 Google Scholar
“Efficient estimation of sensory thresholds,”
Behav. Res. Methods Instrum. Comput., 18 623
–632
(1986). https://doi.org/10.3758/BF03201438 Google Scholar
G. C. de Wit, L. Franssen, J. E. Coppens, and
T. J. T. P. van den Berg,
“Simulating the straylight effects of cataracts,”
J. Cataract Refract. Surg., 32 294
–300
(2006). https://doi.org/10.1016/j.jcrs.2006.01.048 Google Scholar
J. E. Coppens, L. Franssen, and
T. J. T. P. van den Berg,
“Reliability of the compensation comparison method for measuring retinal stray light studied using Monte-Carlo simulations,”
J. Biomed. Opt., 11 054010
(2006). https://doi.org/10.1117/1.2357731 Google Scholar
L. Franssen, J. E. Coppens, and
T. J. T. P. van den Berg,
“Modulation depth threshold in the compensation comparison approach,”
J. Vis., 7 8
(2007). https://doi.org/10.1167/7.1.8 Google Scholar
G. B. del Romo, W. A. Douthwaite, and
D. B. Elliott,
“Critical flicker frequency as a potential vision technique in the presence of cataracts,”
Invest. Ophthalmol. Vis. Sci., 46 1107
–1112
(2005). https://doi.org/10.1167/iovs.04-1138 Google Scholar
J. Lamparter, A. Schulze, A. C. Schuff, M. Berres, N. Pfeiffer, and
E. M. Hoffmann,
“Learning curve and fatigue effect of flicker defined form perimetry,”
Am. J. Ophthalmol., 151 1057
–1064
(2011). https://doi.org/10.1016/j.ajo.2010.11.031 Google Scholar
D. P. Castro, J. Kawase, L. A. Melo Jr.,
“Learning effect of standard automated perimetry in healthy individuals,”
Arq. Bras. Oftalmol., 71 523
–528
(2008). https://doi.org/10.1590/S0004-27492008000400011 Google Scholar
L. Bernardi, V. P. Costa, and
L. O. Shiroma,
“Flicker perimetry in healthy subjects: influence of age and gender, learning effect and short-term fluctuation,”
Arq. Bras. Oftalmol., 70 91
–99
(2007). https://doi.org/10.1590/S0004-27492007000100017 Google Scholar
C. A. Johnson, C. W. Adams, and
R. A. Lewis,
“Fatigue effects in automated perimetry,”
Appl. Opt., 27 1030
–1037
(1988). https://doi.org/10.1364/AO.27.001030 Google Scholar
W. Seiple, V. Greenstein, and
R. Carr,
“Losses of temporal modulation sensitivity in retinal degenerations,”
Br. J. Ophthalmol., 73 440
–447
(1989). https://doi.org/10.1136/bjo.73.6.440 Google Scholar
M. J. Mayer, S. J. Spiegler, B. Ward, A. Glucs, and
C. B. Kim,
“Foveal flicker sensitivity discriminates ARM-risk from healthy eyes,”
Invest. Ophthalmol. Vis. Sci., 33 3143
–3149
(1992). Google Scholar
M. J. Mayer, S. J. Spiegler, B. Ward, A. Glucs, and
C. B. Kim,
“Preliminary evaluation of flicker sensitivity as a predictive test for exudative age-related maculopathy,”
Invest. Ophthalmol. Vis. Sci., 33 3150
–3155
(1992). Google Scholar
M. J. Mayer, B. Ward, R. Klein, J. B. Talcott, R. F. Dougherty, and
A. Glucs,
“Flicker sensitivity and fundus appearance in pre-exudative age-related maculopathy,”
Invest. Ophthalmol. Vis. Sci., 35 1138
–1149
(1994). Google Scholar
C. W. Tyler,
“2 processes control variations in flicker sensitivity over the life-span,”
J. Opt. Soc. Am. A Opt. Image Sci. Vis., 6 481
–490
(1989). https://doi.org/10.1364/JOSAA.6.000481 Google Scholar
C. Yuodelis and
A. Hendrickson,
“A qualitative and quantitative analysis of the human fovea during development,”
Vision Res., 26 847
–855
(1986). https://doi.org/10.1016/0042-6989(86)90143-4 Google Scholar
A. E. Hendrickson,
“Primate foveal development: a microcosm of current questions in neurobiology,”
Invest. Ophthalmol. Vis. Sci., 35 3129
–3133
(1994). Google Scholar
C. A. Curcio, C. L. Millican, K. A. Allen, and
R. E. Kalina,
“Aging of the human photoreceptor mosaic: evidence for selective vulnerability of rods in central retina,”
Invest. Ophthalmol. Vis. Sci., 34 3278
–3296
(1993). Google Scholar
M. J. Mayer, C. B. Kim, A. Svingos, and
A. Glucs,
“Foveal flicker sensitivity in healthy aging eyes. I. Compensating for pupil variation,”
J. Opt. Soc. Am. A, 5 2201
–2209
(1988). https://doi.org/10.1364/JOSAA.5.002201 Google Scholar
C. E. Wright and
N. Drasdo,
“The influence of age on the spatial and temporal contrast sensitivity function,”
Doc. Ophthalmol., 59 385
–395
(1985). https://doi.org/10.1007/BF00159172 Google Scholar
R. A. Weale,
“The lenticular nucleus, light, and the retina,”
Exp. Eye Res., 53 213
–218
(1991). https://doi.org/10.1016/0014-4835(91)90076-Q Google Scholar
B. R. Wooten, L. M. Renzi, R. Moore, and
B. R. Hammond,
“A practical method of measuring the human temporal contrast sensitivity function,”
Biomed. Opt. Express, 1 47
–58
(2010). https://doi.org/10.1364/BOE.1.000047 Google Scholar
|