|
|
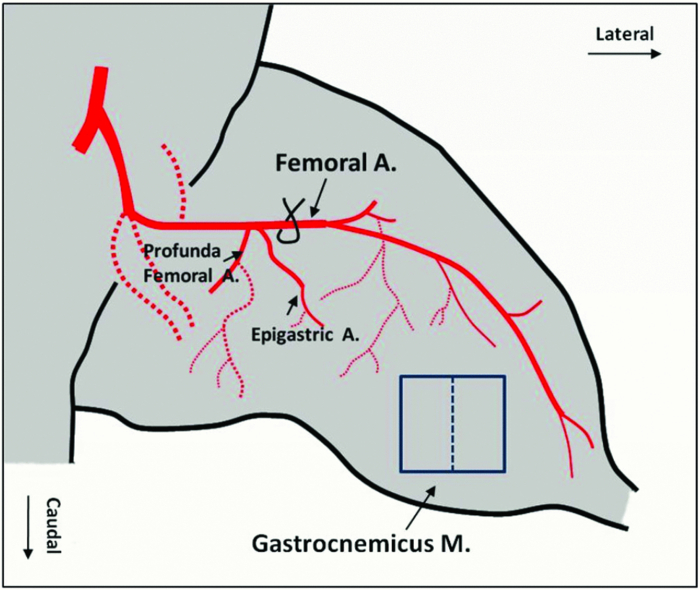
1.IntroductionIn patients with peripheral arterial disease (PAD), tissue perfusion to the lower limb muscles, in response to tissue demand, is compromised due to circulatory dysfunction, which often involves atherosclerosis related to diabetes mellitus and inappropriate clot formation.1 Further development of PAD depends on the balance between the compensatory growth of collateral circulation and the severity of the blood vessel narrowing. Collateral vasculature may provide an alternative route for blood flow to reach the ischemic tissue, partially maintaining oxygen and nutrient support during ischemia. Accordingly, disease management attempts to change this balance in favor of collateral vessel growth and the subsequent restoration of perfusion to the affected limb. There is a growing clinical need for therapies designed to elicit vessel collateralization, enhancing distal limb tissue perfusion, and ultimately improving muscle function.2 A relatively simple animal model that mimics many of the characteristics of PAD is represented by hind-limb ischemia induced by femoral artery ligation in mice.3, 4, 5 In order to evaluate the collateral development after ischemia and further investigate the clinical interventions that can stimulate or enhance the collateralization process, a noninvasive method to assess the longitudinal time-dependent changes in perfusion and perfusion distribution in different muscle groups would be of great value. To date, functional magnetic resonance imaging (fMRI) has provided an unsurpassed, noninvasive imaging tool in the clinical setting, allowing for the study of skeletal muscle perfusion, but limited to exercising muscle. The relatively low signal changes induced by perfusion make this method less sensitive for measuring perfusion at a lower level, e.g., in resting muscle.6, 7 Furthermore, the lack of specificity to vascular events hampers data interpretation. Optical methods, such as laser Doppler imaging (LDI) and laser speckle contrast imaging (LSI), employing the Doppler effect or speckle statistics, are attractive for their dynamic tracking of muscle perfusion in preclinical studies.5 These methods have relatively high flow sensitivity compared with fMRI, but their low-resolution, two-dimensional (2D) image can only determine boundaries between normal and damaged portions of the tissue perfusion. As an extension of optical coherence tomography technology,8, 9 optical microangiography (OMAG)10 has been used to image detailed blood perfusion in a number of tissues, e.g., mouse brain,11 human retina,12 and rat cochlea.13 It is a label-free optical method, producing imaging contrasts via endogenous light backscattered from flowing blood cells. It is also a three-dimensional (3D) imaging method, resolving microcirculatory tissue beds up to ∼2 mm in biological tissue. It has been reported that the minimal blood flow detected by OMAG is ∼160 μm/s, which is determined by optical heterogeneity of biological tissue.14, 15 However, the blood flow in capillaries of most tissues is mainly around tens of micrometers/s.16 To increase the blood flow sensitivity, our group designed an improved and ultrahigh sensitive OMAG (UHS-OMAG) system using different scanning protocol.17 UHS-OMAG applied high-pass filtering along the slow-scan direction, rather than the fast-scan direction as in conventional OMAG. The flow sensitivity of UHS-OMAG of ∼4 μm/s has been demonstrated in flow phantoms.17 Recently, this method has been applied in studying detailed microcirculation in tissues, such as human skin,17 retina,18 and mouse meninges,19 though it has not been applied to evaluate microcirculation in skeletal muscle. The aim of the present study is to establish an improved imaging methodology to longitudinally monitor muscular detailed perfusion in an animal model that has clinical relevance to PAD. First, we will briefly describe the UHS-OMAG system used in this study, showing our observations of depth-resolved microvasculature in skeletal muscles. Then, using UHS-OMAG, we will evaluate time-dependent changes in perfusion following unilateral femoral artery ligation in mouse hind-limb muscles at rest. To display the advantages of the UHS-OMAG method, we will compare it to LSI, which was performed in parallel, under the same experimental conditions. 2.Material and Methods2.1.Unilateral Femoral Artery LigationThree-month-old C57BL/6 male mice, weighing 20 to 30 g, were housed in a temperature-controlled room, fed with mouse food and tap water. All experimental animal procedures performed in this study conform to the guidelines of the US National Institutes of Health. Mice were anesthetized with isoflurane (0.2 l/min O2, 0.8 l/min air) and placed in the supine position on a circulating warm water blanket, which maintained body temperature at 37°C. After shaving and disinfection, a 1 cm transversal skin incision was made in the groin. The femoral artery was identified, as shown in Fig. 1, and aparted from the femoral vein. An artery ligation thread was put through the opening of 1 to 2 mm between the femoral artery and vein proximally, just below the joint point between the profunda femoral artery and epigastric artery (see Fig. 1). Then, the animal was moved to a custom-made stereotaxic stage under isoflurane anesthesia and then subject to UHS-OMAG and LSI imaging. After control images were captured, the femoral artery was occluded using triple surgical knots without changing imaging position. After acquiring follow-up imaging data, the incision was closed with silk sutures. 2.2.UHS-OMAG In Vivo ImagingThe system setup used to achieve UHS-OMAG is similar to that used in our previous work.11, 17 Briefly, a superluminescent diode with a central wavelength of 1310 nm and a bandwidth of 65 nm was used as the light source providing a ∼8.9 μm axial resolution in the tissue. In the sample arm, a 30 mm focal length objective lens was used to achieve ∼9 μm lateral resolution. The output light from the interferometer was sent to a spectrometer with spectral resolution of ∼0.141 nm, producing a total depth range of ∼2.2 mm in the tissue. To achieve ultrahigh sensitive imaging of the flow, we used a high speed camera with 47,000/s of line rate and applied a novel scanning protocol in this system, as described in Ref. 17. With this upgrade, a whole 3D data volume covering ∼2.56 mm in both the X and Y directions was captured in 10 s. The detectable blood flow ranged from ∼4 μm/s to ∼23 mm/s, a range sufficient to image the blood supply in muscle tissue. Before UHS-OM3AG imaging, the right hind-limb of the mice was shaved and depilated. To avoid the influence of skin on imaging quality, a 5 mm longitudinal skin incision was made to expose our imaging objective, the gastrocnemius muscle (see Fig. 1); this area was kept moist under a piece of plastic foil. During the imaging, the animal was immobilized in a custom-made stereotaxic stage and was lightly anesthetized with isoflurane. The body temperature was kept at 37°C by use of a warming blanket; temperature was monitored by a rectal thermal probe throughout the experiment. Before ligating the femoral artery, a control C-scan (3D) and repeated B-scan (2D, M-B mode) of 10 s were acquired as the baseline for future comparison. The imaging sites of C- and B-scan are shown by a solid line box and dashed line, respectively, in Fig. 1. The two ends of ligating thread were then held by hand. Once ligation started, M-B scan was initiated and continued for 1 min. Then, the final C-scan recorded the perfusion at 5 min after onset of ligation at the same site as the control. Follow-up UHS-OMAG images were taken at 48 h, and 1 week after the femoral artery was banded. 2.3.Laser Speckle-Contrast Imaging for ComparisonA laser diode (808 nm) and CMOS camera were positioned above the gastrocnemius muscle such that a 4×4 mm2 area was imaged. Raw speckle images were acquired at 300 Hz for 5 s and a speckle-contrast image was computed from each raw speckle image according to its definition, the ratio of the standard deviation of the intensity to the mean intensity of speckle pattern in the imaging region.20 Speckle contrast is a measure of speckle visibility, which is related to the motion of the scattering particles, in this case blood flow. Each set of 20 speckle-contrast images was averaged together. A relative blood flow image was then obtained by using speckle-contrast values. Blood flow was imaged before ligation introduction, during ligation, at 5 min, and 48 h after ligation. 3.Results3.1.Imaging of Muscle MicrovascularizationIn Fig. 2, the UHS-OMAG in vivo imaging results produced by one volume dataset [2.5×2.5×2 (x-y-z) mm3] are shown. Figure 2a shows one typical cross-sectional image within the UHS-OMAG structural volume, which is identical to the conventional optical coherence tomography (OCT) image, where the borders between different muscle groups are visualized (see dashed lines, for example). Figure 2b gives the corresponding blood flow image obtained from the UHS-OMAG algorithm,17 where the capillary flows within the cross section of skeletal muscle are abundant from the surface to a depth of 700 μm, as shown by a bar. Due to strong light attenuation in the muscular tissue, the capillaries are not readily apparent below 700 μm, but the arterioles with faster flow velocity are still identified as illustrated by arrows. Because the flow and structural images are co-registered in UHS-OMAG, they can be reconstructed in one 3D image [Fig. 2c], allowing the observation of detailed information regarding microvascular blood perfusion. For example, within this volume data set, the 3D view [Fig. 2c] can be rotated, cut from any angle to examine, in detail, the blood flows at different depths within tissue. With the application of the volume segmentation algorithm21 and by the reference to the typical schematic [Fig. 2g] of a vascular network in skeletal muscle,22 the blood perfusion in the muscle tissue was separated into three layers, shown in Figs. 2d, 2e, 2f, respectively. As articulated in Fig. 2g, the first layer [∼200 μm in thickness, Fig. 2d] gives a segment of the venules (V) and a thinner portion of capillary network, in which the lateral capillary connections exist besides the typical longitudinal orientation of the capillaries (shown by arrows). The second layer [with a thickness of ∼500 μm, Fig. 2e] depicts a few branches of arterioles or venules providing connections between dense capillary bundles, which correspond to the transverse arterioles (TA) or collecting venules (CV) designated in Fig. 2g. Another consistent finding in our segmented images was that arterioles seem to lie in the deeper layer [thickness of ∼500 μm, Fig. 2f], connecting with their neighboring venules in the superficial layer through the interconnected branches in the middle layer. Fig. 2Typical in vivo UHS-OMAG images of detailed microcirculation within skeletal muscle in mice are compared with the typical schematic obtained from histological work. (a) is one UHS-OMAG cross-sectional image (B-scan) of microstructures, and (b) is the corresponding blood flow image where the capillary flows in a layer shown by a bar are readily apparent. (c) shows 3D volumetric rendering of blood perfusion within scanned muscle tissue volume. After segmentation, the 2D x-y projection views of muscle blood microflows in three layers [(d)–(f)] are in agreement with the vascular network described in schematic (g). Venule (V); arteriole (A); collecting venule (CV), and transverse arteriole (TA).  3.2.Dynamic Imaging of Skeletal Muscle PerfusionThe changes in blood perfusion in skeletal muscle in response to femoral artery ligation were characterized in anesthetized mice. Figure 3 shows a set of representative time-course blood perfusion patterns from the gastrocnemius muscle area of the same hind-limb. Compared to the perfusion image before ligation [Fig. 3a], the image at 5 min [Fig. 3b] reflected the compromised blood supply to the limb caused by the acute femoral artery ligation. In our preliminary trials, the reduction in blood supply was always pronounced in the limbs within 1 h after ligation; here, only the image at 5 min is presented. Soon after, the collateralization process was initiated in the ligated limb. Figure 3c shows that the imaging tissue volume was collaterally perfused at 48 h. By comparing Figs. 3a and 3c, we find that, although the muscle perfusion was quickly re-established, significant changes in perfusion distribution persisted during this period. It was also evident that the microvessels were dilated after their blood flow was restored. As illustrated in Fig. 3d, a significant restoration of perfusion in the affected skeletal muscle was observed one week after ligation. It seems that the blood perfusion at this time point surpassed that of the baseline, despite the flow stoppage in the acute period after ligation. This suggests that the collaterally dependent perfusion reserve in the hind-limb has the capacity to reach, or even to exceed, the normal resting perfusion level at a higher demand, which agrees with the results previously published in Refs. 23 and 24. Specifically, UHS-OMAG is able to identify the collateral vessels [arrows in Fig. 3d], that were developed from an arteriole, at 48 h after ischemic onset, which was thought to be associated with the augmenting blood supply in this period. Fig. 3Representative functional microcirculation network in the muscle in response to femoral artery ligation. (a)–(d) show time course of perfusion changes before ligation (a), at 5 min, (b) 48 h and, (c) 1 week (d) after ligation. Acute perfusion reduction and restoration can be observed. The brighter microvessels observed in (c) are indicative of increased blood flow associated with collateral perfusion. In (d), arrows indicate that new patterns of collateral vessels are developed during perfusion recovery. Cross-sectional images (e)–(h) detect the variation of blood perfusion before ligation (e) at 5 min, (f) 48 h and, (g) 1 week (h) after ligation along tissue depth.  Detected variation in blood perfusion along tissue depth, as seen in the cross-sectional UHS-OMAG images [Figs. 3e, 3f, 3g, 3h], provides more useful information as to the collateral perfusion after hind-limb ischemia. By comparing the baseline [Fig. 3e] to the 5 min image [Fig. 3f], we find that the ligation had a more pronounced effect on the flow in the capillaries than that on the flow in arterioles. At 48 h after ligation, the superficial tissue layer recovers the blood flow much faster than the deep layer, and vessel diameters seemed to become larger than those in the baseline. One week after ligation, no further difference can be observed in the capillary blood flow within the superficial layer; however, the arteriole blood flow in the deep layer was seen to become higher, and some newly developed collateral vessels were evident. Besides providing the perfusion evolution during the ligation, both projection and cross-section UHS-OMAG maps (Fig. 3) also show that the recovery response was inhomogeneous across different types of vessels over time. The current temporal resolution (180 fps) of the UHS-OMAG system allowed us to observe the acute flow response and high-frequency blood flow changes in the muscle suffering from ligation. By normalizing the results from all time points to that of the baseline preligation period, the fractional flow signal changes were computed based on consecutive B-scan images. Figure 4a is a representative cross-sectional B-scan at the baseline, showing the muscular microcirculation involved during the time-course analysis. Figures 4b and 4c demonstrate the values of fractional flow signal change in each B-scan from two individual vessels [the arrows in Fig. 4a], along with a fitting line showing the flow reaction trends 45 s after ligation. Figure 4d shows the averaged time course for the flow signal changes over the region denoted by the dashed box in Fig. 4a. The temporal sequences of flow response for this representative region revealed a clear decrease that deviates from the baseline up to ∼60% within the first 10 s, indicating an acute phase following ligation. This gradually reached a constant level near 70% during the following 30 s, suggesting a chronic phase after the acute one. 3.3.Comparison of UHS-OMAG Imaging With LSI ImagingThe comparison between UHS-OMAG and LSI imaging was performed on the same type of animal and under the same surgical conditions. The LSI images provided the maps of relative blood flow. In the baseline image [Fig. 5a], blood vessels were evident, but capillary bundles were difficult to distinguish, due to the limited sensitivity of LSI imaging to the slow blood flows. The ligation was performed in the same limb, causing a rapid reduction in muscle perfusion [Fig. 5b] and a significant reduction at 5 min after ligation [Fig. 5c]. Forty-eight hours after ischemic onset, the restoration of flow could not be identified in the same field of view. Although the time course of UHS-OMAG and LSI maps were not co-registered, the results clearly suggest that UHS-OMAG has greater sensitivity to the slow blood flows than the LSI does, in addition to its ability to depth-resolve the restored blood flow. Fig. 5Mapping blood perfusion after femoral artery ligation using LSI. (a)–(d) show LSI blood perfusion maps before, during, 5 min and 48 h after ligation. It is noteworthy that a rapid flow reduction initiated during ligation (b) and continuously developed immediately after ligation (c) and persisted at 48 h after onset (d) by use of LSI where the sensitive analysis of the capillary flow is currently difficult.  4.DiscussionIn the present study, we have demonstrated the feasibility of using UHS-OMAG to longitudinally assess tissue perfusion in a depth-resolved fashion in mouse skeletal muscle upon ligation. The volumetric perfusion image provided a detailed measure of tissue perfusion. We first addressed the capability of UHS-OMAG to visualize the detailed functional microcirculation, up to ∼2 mm in depth, in skeletal muscles. Unlike the previous optical methods, such as LSI, which also utilized signals backscattered from flowing particles, this method has the advantage of super high flow sensitivity (down to ∼4 μm/s), making it suitable for detecting the slow blood flows in microvessels, especially capillaries. As shown by the UHS-OMAG results in Fig. 2d, the typical longitudinal orientation of the individual capillaries within the superficial layer agrees well with the observations from the previous studies25, 26 that used the multiphoton or confocal microscopy where the fluorescent dyes have to be involved in imaging. With its depth-resolved attributes, UHS-OMAG could produce volumetric images in which the microvessel networks within different layers can be easily segmented and visualized. As shown by Figs. 2d, 2e, 2f, cross-connections between capillary bundles along depth were consistent with the typical microvessel arrangements22 as reconstructed by traditional histological techniques. In our study, UHS-OMAG was employed to serially evaluate the development of functional collateral circulation after the induction of hind-limb ischemia in the mouse. In the representative results (shown in Fig. 3), we detected an initial reduction in skeletal muscle perfusion at 5 min after femoral artery ligation. In response to the sudden blockage of the primary vascular network, we observed a strong adaptability in the ligated limb. Two days post-ligation, a rapid restoration occurred, indicating substantial pre-existing collateral vascular trees that open to ameliorate the detrimental effects produced by the abrupt femoral artery ligation. From the longitudinal OMAG flow maps, it is obvious that blood perfusion distribution within muscular tissue has been largely altered after femoral artery ligation. This alteration may be a result of the redistribution of muscle perfusion through pre-existing vessel trees, including collateral vessels. The collateral perfusion has a capacity to restore perfusion in some regions; however, in the regions where the collateral vessels open tardily, muscular tissue may become chronically ischemic. This might partially explain why reperfusion is mainly distributed in the superficial muscle layer at 48 h after ligation. Some previous studies27 have documented a full recovery of blood flow as early as 2 days post-ligation. However, these prior studies used the 2D imaging methods, which may mask the observation of the muscular perfusion restoration within the deep tissue layers. In our UHS-OMAG results, the evidence of over-perfusion was observed 1 week after ligation, particularly in the deep muscle layer, which may be caused by the continuous collateral vessel development during the prolonged ligation of femoral artery. The value of flow signals in UHS-OMAG images is not completely defined at the current stage of development, but it should still provide the improved quality of diagnostic information and treatment planning by providing an alternative optical perfusion imaging technique with a high flow sensitivity and high spatial and temporal resolution. For example, in Fig. 4, we showed that the changes in blood flow in both the individual vessels and the areas of interest, can be quantified by relative flow signals, from which an acute phase within 1 min post-ligation can be identified, which corresponds well to the previous report in Ref. 28. Fig. 4Representative flow responses within 1 min after femoral artery ligation. (a) is a representative cross-sectional B-scan at baseline, showing the microcirculation involved in the quantification analysis. (b) and (c) show the fractional flow signal changes in each B-scan collected from two individual vessels pointed by arrows in (a) along with the fitted curves to show quantified flow response after acute artery ligation. (d) is the averaged time-course for flow change over the region denoted by a dashed box in (a).  When comparing the UHS-OMAG perfusion images with the LSI results, it is important to point out the differences between the two optical techniques. In this study, the image capturing time of LSI, using temporal mode, is equivalent to the multiple of one camera integration time and is determined by the number of images captured in the temporal sequence. This temporal resolution is realistic for in vivo measurements. With the UHS-OMAG method, the total scan time of one 3D data is dependent on the imaging speed, and to some extent on the spatial imaging resolution; the higher speeds will inevitably affect the quality and sensitivity range of the blood flow measurement. However, for the current resolution, the time for a 3D scan only took up to 10 s and that for a 2D scan took ∼25 ms for one flow image. Subsequently, this imaging speed is suitable for the temporal resolution requirement for in vivo preclinical analysis of high-frequency blood flow changes. The perfusion images in Figs. 3, 5 demonstrate the similarity between LSI and UHS-OMAG measurements for acute decrease in perfusion within 5 min post-ligation. The higher flow sensitivity in the UHS-OMAG images is immediately advantageous. Both methods are capable of depicting regions of higher and lower perfusion in this ischemic condition, but the higher sensitivity UHS-OMAG images contain details of the vascular structure not shown with LSI. This ability of the UHS-OMAG allows for the observation of the effects of occlusion on the muscular perfusion at the capillary level. Although the vascular disruption due to occlusion is viewed as an immediate response in both methods, the UHS-OMAG image demonstrated a high vascular adaptation to occlusion that occurred at 48 h and 1 week after ligation. This observed difference can be attributed to the flow sensitivity associated with the LSI and UHS-OMAG instrumentation. For example, the reperfusion reaction occurs mainly within microvessels at 48 h as shown by UHS-OMAG image in Figs. 3c and 3g, and also perfusion restoration within big collateral vascular trees occurs mainly in the deep layer. As a result, LSI measurement limits our ability to visualize the response of the slow blood flows in the superficial tissue layer due to its lower flow sensitivity, as well as the response of the fast flows in the deep layer owing to its 2D imaging nature. In summary, we have demonstrated a prototype, high-sensitivity UHS-OMAG system that allows direct measurements of microcirculation, including capillaries, within skeletal muscles. Using UHS-OMAG, we have been able to unmask both resting muscle perfusion and perfusion reserve in a mouse model of PAD. These findings support the use of this method as a way to explore a more complete evaluation of therapeutics aimed to improve collateral dependent blood flow in PAD. AcknowledgmentsThis work was made possible with support in part from the National Heart, Lung, and Blood Institute (R01 HL093140 and R01HL093140S), National Institute of Biomedical Imaging and Bioengineering (R01 EB009682), and the American Heart Association (0855733G). ReferencesJ. I. Weitz, J. Byrne, G. P. Clagett, M. E. Farkouh, J. M. Porter, D. L. Sackett, D. E. Strandness, and
L. M. Taylor,
“Diagnosis and treatment of chronic arterial insufficiency of the lower extremities: a critical review,”
Circulation, 94 3026
–3049
(1996). Google Scholar
J. P. Cook,
“The pathophysiology of peripheral arterial disease: rational targets for drug intervention,”
Vasc. Med., 2 227
–230
(1997). Google Scholar
S. Rey, K. Lee, G. L. Semenza, C. J. Wang, K. Gupta, S. Chen, A. McMillan, N. Bhise, A. Levchenko, and
G. L. Semenza,
“Synergistic effect of HIF-1alpha gene therapy and HIF-1-activated bone marrow-derived angiogenic cells in a mouse model of limb ischemia,”
Proc. Natl. Acad. Sci. U.S.A., 106
(48), 20399
–20404
(2009). https://doi.org/10.1073/pnas.0911921106 Google Scholar
C. Emanueli, A. Minasi, A. Zacheo, J. Chao, L. Chao, M. B. Salis, S. Straino, M. G. Tozzi, R. Smith, L. Gaspa, G. Bianchini, F. Stillo, M. C. Capogrossi, and
P. Madeddu,
“Local delivery of human tissue kallikrein gene accelerates spontaneous angiogenesis in mouse model of hindlimb ischemia,”
Circulation, 103
(1), 125
–32
(2001). Google Scholar
A. Limbourg, T. Korff, L. C. Napp, W. Schaper, H. Drexler, and
F. P. Limbourg,
“Evaluation of postnatal arteriogenesis and angiogenesis in a mouse model of hind-limb ischemia,”
Nat. Protoc., 4
(12), 1737
–1746
(2009). https://doi.org/10.1038/nprot.2009.185 Google Scholar
L. R. Frank, E. C. Wong, L. J. Haseler, and
R. B. Buxton,
“Dynamic imaging of perfusion in human skeletal muscle during exercise with arterial spin labeling,”
Magn. Reson. Med., 42 258
–267
(1999). https://doi.org/10.1002/(SICI)1522-2594(199908)42:2<258::AID-MRM7>3.0.CO;2-E Google Scholar
B. T. Archer, J. L. Fleckenstein, L. A. Bertocci, R. G. Haller, B. Barker, R. W. Parkey, and
R. M. Peshock,
“Effect of perfusion on exercised muscle: MR imaging evaluation,”
J. Magn. Reson. Imaging, 2 407
–413
(1992). https://doi.org/10.1002/jmri.1880020409 Google Scholar
A. F. Fercher, W. Drexler, C. K. Hitzenberger, and
T. Lasser,
“Optical coherence tomography – principles and applications,”
Rep. Prog. Phys., 66 239
–303
(2003). https://doi.org/10.1088/0034-4885/66/2/204 Google Scholar
P. H. Tomlins and
R. K. Wang,
“Theory, development, and applications of optical coherence tomography,”
J. Phys. D Appl. Phys., 38 2519
–2535
(2005). https://doi.org/10.1088/0022-3727/38/15/002 Google Scholar
R. K. Wang, S. L. Jacques, Z. Ma, S. Hurst, S. R. Hanson, and
A. Gruber,
“Three-dimensional optical angiography,”
Opt. Express, 15
(7), 4083
–4097
(2007). https://doi.org/10.1364/OE.15.004083 Google Scholar
Y. L. Jia, N. J. Alkayed, and
R. K. Wang,
“The potential of optical micro-angiography to monitor cerebral blood perfusion and vascular plasticity following traumatic brain injury in mice in vivo,”
J. Biomed. Opt., 14 040505
(2009). https://doi.org/10.1117/1.3207121 Google Scholar
L. An and
R. K. Wang,
“In vivo volumetric imaging of vascular perfusion within human retina and choroids with optical micro-angiography,”
Opt. Express, 16 11438
–11452
(2008). https://doi.org/10.1364/OE.16.011438 Google Scholar
N. Choudhury, F. Y. Chen, X. R. Shi, A. L. Nuttall, and
R. K. Wang,
“Volumetric imaging of blood flow within cochlea in gerbil in vivo,”
IEEE J. Sel. Top. Quantum Electron., 16 524
–529
(2010). https://doi.org/10.1109/JSTQE.2009.2032671 Google Scholar
R. K. Wang,
“Optical microangiography: a label free 3D imaging technology to visualize and quantify blood circulations within tissue beds in vivo,”
IEEE J. Sel. Top. Quantum Electron., 16
(3), 545
–554
(2010). https://doi.org/10.1109/JSTQE.2009.2033609 Google Scholar
R. K. Wang and
L. An,
“Doppler optical micro-angiography for volumetric imaging of vascular perfusion in vivo,”
Opt. Express, 17 8926
–8940
(2009). https://doi.org/10.1364/OE.17.008926 Google Scholar
H. H. Lipowsky,
“Microvascular rheology and hemodynamics,”
Microcirculation, 12 5
–15
(2005). https://doi.org/10.1080/10739680590894966 Google Scholar
L. An, J. Qin, and
R. K. Wang,
“Ultrahigh sensitive optical microangiography for in vivo imaging of microcirculations within human skin tissue beds,”
Opt. Express, 18 8220
–8228
(2010). https://doi.org/10.1364/OE.18.008220 Google Scholar
R. K. Wang, L. An, P. Francis, and
D. J. Wilson,
“Depth-resolved imaging of capillary networks in retina and choroid using ultrahigh sensitive optical microangiography,”
Opt. Lett., 35
(9), 1467
–1469
(2010). https://doi.org/10.1364/OL.35.001467 Google Scholar
Y. L. Jia, L. An, and
R. K. Wang,
“Label-free and highly sensitive optical imaging of detailed microcirculation within meninges and cortex in mice with the cranium left intact,”
J. Biomed. Opt., 15 030510
(2010). https://doi.org/10.1117/1.3432654 Google Scholar
A. K. Dunn, H. Bolay, M. A. Moskowitz, and
D. A. Boas,
“Dynamic imaging of cerebral blood flow using laser speckle,”
J. Cereb. Blood Flow Metab., 21 195
–201
(2001). https://doi.org/10.1097/00004647-200103000-00002 Google Scholar
R. K. Wang and
S. Hurst,
“Mapping of cerebrovascular blood perfusion in mice with skin and cranium intact by Optical Micro-AngioGraphy at 1300 nm wavelength,”
Opt. Express, 15 11402
–11412
(2007). https://doi.org/10.1364/OE.15.011402 Google Scholar
T. C. Skalak and
G. W. Schmid-Schonbein,
“The microvasculature in skeletal muscle. A model of the capillary network,”
Microvasc. Res., 32 333
–347
(1986). https://doi.org/10.1016/0026-2862(86)90069-5 Google Scholar
H. T. Yang, R. W. Ogilvie, and
R. L. Terjung,
“Heparin increases exercise-induced collateral blood flow in rats with femoral artery ligation,”
Circ. Res., 76 448
–456
(1995). Google Scholar
H. T. Yang, M. R. Deschenes, R. W. Ogilvie, and
R. L. Terjung,
“Basic fibroblast growth factor increases collateral blood flow in rats with femoral arterial ligation,”
Circ. Res., 79 62
–69
(1996). Google Scholar
R. M. Bateman and
K. R. Walley,
“Microvascular resuscitation as a therapeutic goal in severe sepsis,”
Crit. Care, 9 S27
–S32
(2005). https://doi.org/10.1186/cc3756 Google Scholar
R. Dickie, R. M. Bachoo, M. A. Rupnick, S. M. Dallabrida, G. M. Deloid, J. Lai, R. A. Depinho, and
R. A. Rogers,
“Three-dimensional visualization of microvessel architecture of whole-mount tissue by confocal microscopy,”
Microvas. Res., 72 20
–26
(2006). https://doi.org/10.1016/j.mvr.2006.05.003 Google Scholar
R. A. J. Challiss, D. J. Hayes, R. F. H. Petty, and
G. K. Radda,
“An investigation of arterial insufficiency in rat hindlimb,”
Biochem. J., 236 461
–467
(1986). Google Scholar
H. A. Corcoran, B. E. Smith, P. Mathers, D. Pisacreta, and
J. C. Hershey,
“Laser Doppler imaging of reactive hyperemia exposes blood flow deficits in a rat model of experimental limb ischemia,”
J. Cardiovasc. Pharmacol., 53 446
–451
(2009). https://doi.org/10.1097/FJC.0b013e3181a6aa62 Google Scholar
|