
|
|
1.IntroductionQuantitative assessment of human skin hemodynamics, such as blood perfusion and its oxygenation state, is important for monitoring tissue metabolism and health status, diagnosis of allergic dermatitis, and evaluating tissue viability in surgery and convalescence. The diffuse reflectance spectrum of human skin reflects the optical absorption spectra of chromophores (i.e., oxygenated hemoglobin, deoxygenated hemoglobin, and melanin), and these spectra depend on the concentrations of chromophores in skin tissue. Diffuse reflectance spectroscopy has been widely used for the evaluation of human skin chromophores at a single location. 1, 2, 3, 4, 5, 6, 7, 8, 9, 10 The multispectral imaging technique is a useful tool for extending diffuse reflectance spectroscopy to spatial mapping of the chromophores in skin tissue. This can be simply achieved by a monochromatic CCD camera with narrow band filters and a white light source, which has been used to investigate the hemoglobin perfusion in living tissue.11, 12, 13 In clinical conditions, simpler, more cost-effective, and more portable equipment is needed. The digital RGB imaging technique is a promising tool for satisfying these demands for practical application. Imaging with broadband filters, as in the case of digital RGB imaging, can also provide spectral images without mechanical rotation of a filter wheel. Separated images of melanin and hemoglobin concentrations have been extracted from the RGB digital image with the aid of independent component analysis for the diffuse reflectance spectra of human skin.14 An approach15, 16 has been developed for visualizing the concentration of red blood cells in the subsurface microcirculation of skin tissue. Using differences in the wavelength dependence of the absorption spectra between hemoglobin and background tissue, a tissue viability index, which is defined as a global expression of the capacity of the tissue to react to stimuli by altering microvascular perfusion, is evaluated based on the RGB values. In order to map the melanin, total hemoglobin, and oxygen saturation in human skin, RGB digital images of human skin were analyzed based on principal component analysis.17 In this method, the RGB values are converted into three scores for the principal components of the reflectance spectra by the first look-up table. These three scores are then converted to the concentrations of melanin, total hemoglobin, and oxygen saturation, by the second look-up table. We previously proposed a method by which to visualize the concentrations of melanin, oxygenated blood, and deoxygenated blood distributed in the skin tissue using a digital RGB image.18 In this method, the RGB values are converted into the tristimulus values in the Commission Internationale de l’Éclairage XYZ (CIEXYZ) color space, which is compatible with the common RGB working space of the National Television Standards Committee (NTSC), the standard RGB (sRGB), etc. A Monte Carlo simulation (MCS) of light transport for the human skin model is used to specify the relationship among the tristimulus XYZ values and the concentrations of melanin, oxygenated blood, and deoxygenated blood. Images of total blood concentration and oxygen saturation can also be reconstructed from the results of oxygenated blood and deoxygenated blood. In the present study, we further investigate the validity of the proposed method for visualizing the hemodynamics of human skin tissue. Experiments using tissue-like agar gel phantoms are conducted in order to simulate the transition from oxygenated blood to deoxygenated blood in dermis in vitro. In order to confirm the applicability of the method to evaluate human skin hemodynamics, in vivo imaging of the total blood concentrations and tissue oxygen saturation are performed for 14 subjects during upper limb occlusion at pressures of 50 and 250 mm Hg. The responses of blood flow to the occlusion are evaluated by the forearm volume changes measured by a conventional strain-gauge plethysmograph (SPG). The results of total blood concentration obtained by the proposed method are compared to the SPG recordings. The results of oxygen saturation are discussed based on the physiological perspectives for microcirculation in human skin tissue. 2.PrincipleRGB values of a pixel on a skin surface image acquired by a digital camera can be expressed as Eq. 1[TeX:] \documentclass[12pt]{minimal}\begin{document}\begin{equation} \left[ {\begin{array}{*{20}c} {\rm R} \\ {\rm G} \\ {\rm B} \\ \end{array}} \right] = {\bf L}_{\bf 1} \left[ {\begin{array}{*{20}c} X \\ Y \\ Z \\ \end{array}} \right],\end{equation}\end{document}Eq. 2[TeX:] \documentclass[12pt]{minimal}\begin{document}\begin{equation} X = k\sum {E(\lambda)\bar x(\lambda)O(\lambda)}, \end{equation}\end{document}Eq. 3[TeX:] \documentclass[12pt]{minimal}\begin{document}\begin{equation} Y = k\sum {E(\lambda)\bar y(\lambda)O(\lambda)}, \end{equation}\end{document}Eq. 4[TeX:] \documentclass[12pt]{minimal}\begin{document}\begin{equation} Z = k\sum {E(\lambda)\bar z(\lambda)O(\lambda)}. \end{equation}\end{document}Eq. 5[TeX:] \documentclass[12pt]{minimal}\begin{document}\begin{equation} k = 100\mathord{\left/ {\vphantom {\sum {E(\lambda)\bar y(\lambda)}}} \right. \kern-\nulldelimiterspace}\sum {E(\lambda)\bar y(\lambda)}. \end{equation}\end{document}Eq. 6[TeX:] \documentclass[12pt]{minimal}\begin{document}\begin{eqnarray} O \!&=&\! I/I_0 = \left[ {\int_0^\infty {P_{{\rm sc}} ({\mu _{s,{\rm sc}},g_{{\rm sc}},l_{{\rm sc}} })\exp ({ - \mu _{a,{\rm sc}} l_{{\rm sc}} })dl_{{\rm sc}} } } \right] \nonumber\\ &&\times \left[ {\int_0^\infty {P_e ({\mu _{s,e},g_e,l_e })\exp ({ - \mu _{a,m} l_e })dl_e } } \right] \nonumber\\ &&\times \left\{ {\int_0^\infty {P_d ({\mu _{s,d},g_d,l_d })\exp [ { - ({\mu _{a,ob} + \mu _{a,db} })l_d }]dl_d } } \right\},\nonumber\\ \end{eqnarray}\end{document}Figure 1 shows the flow of estimation using the proposed method. First, RGB values in each pixel of the image are transformed into XYZ values by a matrix N 1 as Eq. 7[TeX:] \documentclass[12pt]{minimal}\begin{document}\begin{equation} \left[ {\begin{array}{*{20}c} X \\ Y \\ Z \\ \end{array}} \right] = {\bf N}_{\bf 1} \left[ {\begin{array}{*{20}c} {\rm R} \\ {\rm G} \\ {\rm B} \\ \end{array}} \right].\end{equation}\end{document}We determined the matrix N 1 based on measurements of a standard color chart (ColorChecker, X-Rite Incorporated, Michigan) that has 24 color chips and is supplied with data giving the CIEXYZ values for each chip under specific illuminations and corresponding reflectance spectra. The values of X, Y, and Z are then transformed into C m, C ob, and C db by a matrix N 2. It is difficult to determine the matrix N 2 based on L 1 and Eqs. 2, 3, 4, 5, 6 because P(μ s, g, l) and l for each layer are usually unknown. We calculated 300 diffuse reflectance spectra O(λ) in a wavelength range from 400 to 700 nm at intervals of 10 nm by MCS for light transport19 in skin tissue. We used the skin baseline absorption coefficient20 as that of the stratum corneum. The absorption coefficient of the epidermis depends on the volume concentration of melanin in the epidermis C m. We used the absorption coefficient of melanosome given in the literature21 as the absorption coefficient of melanin μ a,m. This corresponds to the absorption coefficient of the epidermis for the case in which C m = 100%. Then, we derived the absorption coefficients of the epidermis for 10 different lower concentrations of C m = 1% to 10% at intervals of 1%, by simply proportioning it to that for C m = 100%, and the absorption coefficients were input to the epidermis. The sum of the absorption coefficient of oxygenated blood for C ob and that of deoxygenated blood for C db were considered for the dermis. This summation provides the total blood concentration C tb = C ob + C db and oxygen saturation SO2% = (C ob/C tb)×100. The absorption coefficients of blood having a 44% hematocrit with 150 g/l of hemoglobin22 were assumed to be that of the dermis for the case in which C tb = 100% and were input to the dermis as μ a,ob + μ a,db. Then, the absorption coefficients of the dermis were derived for 5 different concentrations of C tb = 0.2, 0.4, 0.6, 0.8, and 1.0% for six different cases of SO2 = 0, 20, 40, 60, 80, and 100%. Typical published values for μ s(λ)23 and g(λ)24 were input to the stratum corneum, epidermis, and dermis, which are provided as a function of wavelength. The layer thicknesses of stratum corneum, epidermis, and dermis were set to be 0.02, 0.06, and 4.92 mm, respectively. The refractive index of the stratum corneum was set to be 1.47.25 The refractive index of the epidermis was set to be 1.3725, which is the average value of the volar side of the lower arm, the granular layer of the palm of the hand, and the basal layer of the palm of the hand.25 The refractive index of the dermis was set to be 1.42, which is the average value of the volar side of the lower arm and the palm of the hand.25 The optical parameters used in the Monte Carlo simulation for the skin tissue model are summarized in Fig. 2. The XYZ-values were then calculated based on the simulated O(λ). The above calculations were performed for various combinations of C m, C ob, and C db in order to obtain the data sets of chromophore concentrations and XYZ-values. Multiple regression analysis with 300 data sets established three regression equations for C m, C ob, and C db: Eq. 8[TeX:] \documentclass[12pt]{minimal}\begin{document}\begin{equation} C_m = a_0 + a_1 X + a_2 Y + a_3 Z,\end{equation}\end{document}Eq. 9[TeX:] \documentclass[12pt]{minimal}\begin{document}\begin{equation} C_{{\rm ob}} = b_0 + b_1 X + b_2 Y + b_3 Z,\end{equation}\end{document}Eq. 10[TeX:] \documentclass[12pt]{minimal}\begin{document}\begin{equation} C_{{\rm db}} = c_0 + c_1 X + c_2 Y + c_3 Z.\end{equation}\end{document}Eq. 11[TeX:] \documentclass[12pt]{minimal}\begin{document}\begin{eqnarray} {\bf N}_2 = \left[ \begin{array}{c@{\quad}c@{\quad}c@{\quad}c} {a_0 } & {a_1 }& {a_2 }& {a_3 }\\ {b_0 } & {b_1 }& {b_2 }& {b_3 }\\ {c_0 } & {c_1 }& {c_2 }& {c_3 }\\ \end{array}\right]. \end{eqnarray}\end{document}Eq. 12[TeX:] \documentclass[12pt]{minimal}\begin{document}\begin{equation} \left[ {\begin{array}{*{20}c} {C_m } \\ {C_{ob} } \\ {C_{db} } \\ \end{array}} \right] = {\bf N}_2 \left[ {\begin{array}{*{20}c} 1 \\ X \\ Y \\ Z \\ \end{array}} \right].\end{equation}\end{document}Fig. 2Optical parameters used in the Monte Carlo simulation for the skin tissue model. The absorption coefficients of skin baseline (from Ref. 20) was used as those of the stratum corneum μ a , sc. The absorption coefficients for melanin in epidermis μ a , m (from Ref. 21); oxygenated blood in dermis μ a , ob (from Ref. 22); deoxygenated blood in dermis μ a , db (from Ref. 22). The scattering coefficients μ s (from Ref. 23) and g (from Ref. 24) was used for stratum corneum, epidermis, and dermis.  3.Materials and Method3.1.Measurement ApparatusFigure 3 schematically shows the experimental configurations for (a) the imaging system, (b) the tissue-like agar gel phantom, and (c) in vivo experiments with upper arm occlusion. A metal halide lamplight (LA-180Me-R, Hayashi, Japan) illuminated the surface of a sample via a light guide with a ring illuminator. The light source covered a range from 380 to 740 nm. Diffusely reflected light was captured by a 24-bit RGB CCD camera (DFK-21BF04, Imaging Source LLC, USA) with a camera lens (Pentax/Cosmica, Japan; f 16 mm, 1:1.4) to acquire an RGB color image of 640 × 480 pixels. The field of view of the imaging system was 360 mm × 270 mm. The lateral resolution of the images was estimated to be 0.56 mm. This means the best resolution with a nonscattering object. An IR-cut filter in the camera rejects unnecessary longer-wavelength light (> 700 nm). A standard white diffuser with 99% reflectance (SRS-99-020, Labsphere Incorporated, New Hampshire) was used to correct instrument to instrument difference in output of the camera and the spatial nonuniformity of the illumination. The RGB image was an average of 16 video frames and it was stored in a personal computer and analyzed according to the visualization process described above. The computation time for analyzing a typical human skin image was 5 s. RGB filters usually have cross-talk. The regression model used in the present study is based on the results of Monte Carlo simulation. We derived the theoretical diffuse reflectance spectra from the Monte Carlo simulation. A set of theoretical tristimulus values in the CIEXYZ color system, X, Y, and Z, were calculated using the diffuse reflectance spectrum, the spectral distribution of the illuminant, and color matching functions based on Eqs. 2, 3, 4. In this case, the color matching functions correspond to the product of the transmittance spectra of RGB color filters and the spectral sensitivity of the CCD. Like RGB filters, the color matching functions also have cross-talk. We derive RGB values from the theoretical XYZ values using the color transformation matrix L1 in Eq. 1. Since this method estimates the values of C m, C ob, and C db from the XYZ values, the regression model takes the cross-talk of RGB values into account in the estimation of these chromophore concentrations. 3.2.Experiments Using PhantomsThe tissue-like agar gel phantom used in the present study consists of an epidermis layer and a dermis layer. We prepared an agar solution by diluting agar powder (Ina Food Industrial Incorporated, Ina, Japan) with saline at a weight ratio of 0.8%. Intralipid 10% stock solution (Fresenius Kabi AB, Sweden) was added to the agar solution to cause scattering in the phantom. The resultant solution was used as a base material for the epidermis and dermis layers. The final volume concentration of Intralipid in each layer was 1%. We tried to make the phantoms with three-layers similar to the theoretical skin model. However, it was difficult to make a thinned layer representing the stratum corneum by the agar gel in the present study. We investigated the effect of the stratum corneum layer on the RGB values numerically. We made a comparison between the RGB values calculated from the Monte Carlo skin model with and without the stratum corneum layer. The difference in the RGB value between the two models was 2.8 on average. This difference may be of minor importance for simulating the transition from oxygenated blood to deoxygenated blood in dermis. Thus, we ignored the stratum corneum layer in the phantom experiments. A coffee solution was introduced as a substitute for melanin into the base material, and this mixture was used to make the epidermis. Therefore, we used the variable C c for the epidermis layer in the phantom experiments. Several materials, such as India ink, have been used to mimic the absorption properties of melanin.26 We first tried to mimic the absorption spectrum using an India ink solution. We investigated the absorbance spectrum of India ink (R591217, Rotring, Germany) based on the transmittance measurement in the preliminary experiment. Figure 4 shows the measured absorption spectra of India ink solution and coffee solution. The absorption spectrum of melanin21 is also presented in Fig. 4. The absorption spectrum of the India ink solution decays linearly as the wavelength increases, whereas that of melanin decays exponentially as the wavelength increases. Therefore, it was difficult to reproduce the diffuse reflectance spectra of human skin over the visible wavelength range using India ink. Thus, we used a coffee solution to mimic the absorption spectrum of melanin. The coffee solution contained a brown pigment called melanoidin.27 The absorption spectrum of melanoidin28, 29 has been reported to be similar to that of melanin. We observed the absorbance spectrum of coffee solution within a cuvette based on transmittance measurements. As shown in Fig. 4, the absorption spectrum of the coffee solution decays exponentially as the wavelength increases. An oxygenated dermis was made by adding a small amount of fully oxygenated horse blood having a 44% hematocrit to the base material. We established oxygenation of the horse blood by gassing it with 95% O2, 5% CO2. Fig. 4Absorption spectra of India ink solution (dashed line) and coffee solution (solid line) obtained from the transmittance measurements, and absorption spectrum of melanin (from Ref. 21). All the absorption spectra are normalized at 500 nm.  The volume concentration of the coffee solution in the epidermis layer was set to be C c = 5.0%, whereas that of oxygenated blood in the dermis layer was set to be C tb = 0.4%. Therefore, the volume concentrations of deoxygenated blood and total blood and the oxygen saturation were assumed to be C db = 0.0%, C tb = 0.4%, and SO2 = 100%, respectively. All of these layers were hardened in various molds having the required thickness and size by cooling at approximately 5.5ºC for 30 min. The thickness of the epidermis and dermis layers were made to be 1.0 and 5.0 mm, respectively, whereas the area of each layer was 26 mm × 23 mm. These layers were then stacked to obtain a layered phantom. Empirical formulas for the phantom should also be prepared. The Monte Carlo simulations for the phantom conditions generated spectral diffuse reflectance samples ranging from 400 to 700 nm. The optical parameters of μ s(λ) and μ a(λ) for the phantom were determined by the inverse Monte Carlo method for measured diffuse reflectance and total transmittance.8, 30, 31 Optical properties for the skin tissue phantoms estimated by the inverse Monte Carlo method are shown in Figure 5. The refractive index n for each layer was assumed to be 1.33 at three wavelengths. The anisotropy factor g of Intralipid was derived from the equation reported in literature32 as, Eq. 13[TeX:] \documentclass[12pt]{minimal}\begin{document}\begin{equation} g\left(\lambda \right) = 1.1 - 0.58 \,\times\, \lambda\, \times\, 10^{ - 3},\end{equation}\end{document}The proposed method assumes that the scattering coefficients μ s(λ) and the thickness t of the skin tissue are known, and typical values reported in the literature are used to derive the empirical formulas. However, these values have subject-to-subject variability and may change due to the physiological or structural condition of the tissue. In order to investigate the effect of variation in scattering coefficients and thickness of the epidermis on the measurements, we also performed experiments on the phantoms for various values of μ s(λ) and t. For test samples, the values of μ s(λ) in the epidermis layer were set with a 50% decrement or increment of the typical value, whereas those of t in the epidermis layer were set with a 50% decrement or increment. 3.3.Upper Arm Occlusion ExperimentsA pressure cuff was applied to the upper arms of 14 Japanese subjects (10 males and four females, mean age: 25±8 yr), as shown in Fig. 3c. A SPG (EC6, D.E. Hokanson, Washington) and a rapid cuff inflator (E-20, D.E. Hokanson, Washington) were used to measure in vivo forearm volume change ΔV/V ml/100 ml, which has been used to evaluate limb blood flow.33, 34 The SPG is a device that measures the volume changes in limbs and digits using a gauge consisting of a mercury-filled silastic rubber tube. The volume change of tissue induced by the blood flow causes the gauge to stretch or contract. The SPG can determine the volume change based on the variation of electrical resistance caused by the stretching or contraction of the gauge.35 Measurements of limb blood flow at 50 mm Hg have been performed in order to estimate physiological indices of blood circulation such as arterial inflow rate, venous capacitance, and maximum venous outflow,35 whereas those at 250 mm Hg have been performed to investigate the relationship between vasodilatation response and endothelial functions for a peripheral blood vessel.34, 35 During the measurements, the subjects sat with their hands placed on a sample stage at approximately heart-level. After resting for 300 s, image acquisition and SPG recording were started and continued for 640 s at 4 s intervals. After 40 s of control, the cuff was inflated to 50 or 250 mm Hg for 300 s by a rapid cuff inflator, which was then deflated for 300 s. Inflation of the cuff to 50 mm Hg prevents blood flow from leaving the measurement site but does not hinder arterial inflow, whereas that at 250 mm Hg blocks both venous outflow and the arterial inflow. Analyses of the RGB images and the forearm volume change ΔV/V were performed offline after the measurements were completed. Three regions of interest (ROIs) of different sizes were placed in different parts of each image, as shown in Figure 3c. The sizes of ROI1, ROI2, and ROI3 were 250 × 25 pixels, 150 × 150 pixels, and 100 × 100 pixels, respectively. 4.Results and Discussion4.1.Experiments Using PhantomsFigure 6 shows typical images obtained from a phantom, four sides of the dermis layer of which were immersed in Na2S2O4-added saline, at different time points during the measurement. Note that the edge of the RGB image is dark before the application of Na2S2O4 (0 min). This is primarily due to the light being less diffusive at the edge than in the center. Similar artifacts were also observed in the estimated images of C c, C ob, C db, C tb, and SO2 Therefore, the results for the ROIs (white squares) in the images are discussed here. A correction map based on the spatial distribution of diffuse reflected light intensity from the phantom may be promising to correct for the edge effects. This issue should be investigated in a future work. The images of C db and C ob altered inversely from the edge to the center because only the sides of the phantom were surrounded by Na2S2O4-added saline. Consequently, the reduction in SO2 covered most of the image at the end of measurement (t = 90 min). The images of C tb and C c remained approximately constant because they are independent of the oxygen state of hemoglobin. The time courses of the average values over ROIs in the images of C c, C ob, C db, C tb, and SO2 shown in Fig. 6 are plotted in Fig. 7. At the beginning of measurement, the values of C c, C ob, C db, C tb, and SO2 were estimated to be 5.8±2.7%, 0.36±0.07%, 0.09±0.01%, 0.45±0.16%, and 84±19%, whereas the given values were 5.0%, 0.4%, 0.0%, 4.0%, and 100%, respectively. During measurement, C ob decreased and C db increased, whereas C tb and C c were almost unchanged, as should be expected. The value of SO2 decreased gradually and finally fell to approximately 15%. The results obtained from the phantom experiment demonstrate the usefulness of the method in visualizing quantitatively the transition from oxygenated blood to deoxygenated blood in the dermis. Fig. 6Typical images obtained from a phantom, the dermis layer of which was immersed in Na2S2O4-added saline (from top to bottom: RGB image, C ob, C db, C tb, SO2, and C c) for different time points during measurement. 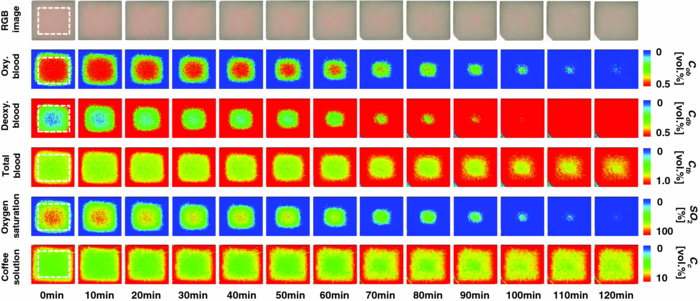 Fig. 7Time courses of C c, C ob, C db, C tb, and SO2 averaged over the ROIs (white squares) in Fig. 6.  Table 1 lists the relative errors in C c, C ob, C db, C tb, and SO2 for two different variations in μ s(λ) and t of the epidermis layer. The estimated values of C c, C ob, C db, and C tb decrease as the variation in μ s(λ) changes from negative to positive. This is because the absorption by each chromophore is estimated to be small due to the increase in O(λ) associated with the increase in μ s(λ). The estimated value of C c decreases as the variation in t changes from positive to negative, whereas that of SO2 increases. This is due to the following consideration. As the thickness of the epidermis layer becomes small, the probability that light is absorbed in it will decrease. Thus, the value of C c will be underestimated if the thickness of the epidermis is smaller than the typical value. On the other hand, more light will penetrate into the dermis layer as the epidermis layer becomes thinner. In this case, the diffuse reflectance will be affected by the absorption of hemoglobin in the dermis layer more strongly than that of the coffee solution in the epidermis. In addition, the hemoglobin strongly absorbs the light at the shorter wavelength. Therefore, the increase in diffuse reflectance at the longer wavelength is larger than that at the shorter wavelength. This may cause over- and underestimation of C ob and C db, respectively. Consequently, the oxygen saturation SO2 will be overestimated if the thickness of the epidermis is smaller than the typical value. Table 1Relative errors of C c, C ob, C db, C tb, and SO2 for different variations in μ s(λ) and t of the epidermis layer for the phantom.
4.2.Upper Arm Occlusion ExperimentsFigure 8 shows the forearm volume change ΔV/V measured by the SPG for cuff pressures of (a) 250 mm Hg and (b) 50 mm Hg. In Fig. 8a, ΔV/V first increases as a result of cuff inflation. A second increase due to reactive hyperemia is evident after cuff deflation. In Fig. 8b, ΔV/V rises quickly after the inflation of the cuff, and the rate of increase in ΔV/V then slows. A rapid decrease in ΔV/V occurred after deflation of the cuff. Figure 9 shows an example of the in vivo results obtained from one single subject during cuff occlusion at 250 mm Hg. The time courses of C m, C ob, C db, C tb, and SO2 averaged over the area for the ROIs (white squares) in Fig. 9 are shown in Figs. 10a, 10b, 10c, 10d, 10e. Figure 11 shows the time courses of C m, C ob, C db, C tb, and SO2 averaged over the three ROIs for all 14 subjects during cuff occlusion at 250 mm Hg. The average values of C m and C tb were 4.3±1.2% and 1.1±0.4%, respectively, in pre-occlusion (control), which are close to typical values reported in the literature.2, 11, 13 The average value of 71±16% for SO2 in pre-occlusion is lower than typical arterial SO2, which ranges from 90% to 98%. Typical value of venous SO2 is almost 60%. The value of SO2 measured by this method represents oxygen saturation for the mixture of arterio-venous blood. Almost 75% of the total blood volume in whole body is contained within the veins and venules, whereas 25% of it is contained within the arteries and arterioles. Assuming that the blood volume ratio of venules and arterioles in the skin tissue is similar to that of whole body, and the oxygen saturation of arterial blood under the normal condition is 96%, the oxygen saturation of skin tissue is calculated to be 69%. This value is close to the average values of 71±16% for SO2 obtained by this method in preocclusion. During cuff occlusion, C ob and C db decreased and increased, respectively. The value of SO2 exhibited the well-known deoxygenation curve, in which the oxygen saturation falls exponentially. The slight increase in C tb probably has a physiological cause. This is because, during occlusion, the venous outflow is reduced more than the arterial inflow. This is supported by the results for ΔV/V shown in Fig. 8a. After the cuff was deflated, both SO2 and C tb increased sharply and then gradually returned to their normal levels. The error ranges for each subject were taken into account for the calculation of the error range for the trace in Fig. 11. Therefore, interindividual differences in response times and levels may have caused some skewing of traces in Fig. 11. Fig. 8Time courses of forearm volume changes ΔV/V measured by SPG during upper arm occlusion at (a) 250 mm Hg and (b) 50 mm Hg. The error bars show the standard deviations (n = 14). 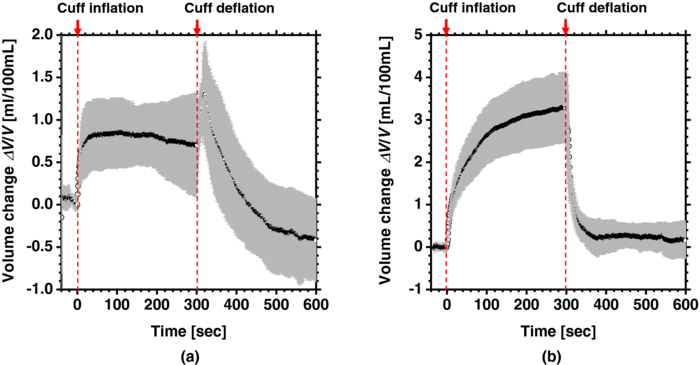 Fig. 9Typical images of in vivo measurements during cuff occlusion at 250 mm Hg (from top to bottom: RGB image, C ob, C db, C tb, SO2, and C m).  Fig. 11Time courses of (a) C ob, (b) C db, (c) C tb, (d) SO2, and (e) C m averaged over the three ROIs for all 14 subjects during cuff occlusion at 250 mm Hg. The error bars show the standard deviations (n = 14).  Figure 12 shows an example of in vivo results obtained from one single subject during cuff occlusion at 50 mm Hg. The time courses of C m, C ob, C db, C tb, and SO2 averaged over the ROIs (white squares) in Fig. 12 are shown in Figs. 13a through 13e. Figure 14 shows the time courses of C m, C ob, C db, C tb, and SO2 averaged over the three ROIs for all 14 subjects during cuff occlusion at 50 mm Hg. The first increase in C ob appeared after the cuff was inflated, which caused a temporal increase in SO2, probably due to the blockage of venous outflow and the continuous arterial inflow. After peaking, C ob became constant, whereas C db increased during occlusion. These changes in C ob and C db indicate the decrease of the arterial inflow rate and the deoxygenation of hemoglobin resulting from the consumption of oxygen by the tissue, respectively. The rapid decreases in both C ob and C db immediately after the deflation of the cuff suggest the outflow of venous blood. The tendency of the response in C tb to the upper arm occlusions at 50 mm Hg corresponds to the results for ΔV/V shown in Fig. 9b. Note that, whereas C db decreases monotonically, the change in C ob after deflation of the cuff has three separate phases: an initial rapid decrease, a slight increase, and then a gradual decrease. This means that the reactive response of arterial blood can be caused by the occlusion at not only 250 mm Hg but also 50 mm Hg. However, the reactive response at 50 mm Hg cannot be observed in the results for the total blood volume, i.e., C tb and ΔV/V, because the slight variation in C ob was hidden by the change in deoxygenated blood that decreases dramatically. This indicates the possibility of using this method to evaluate the post-occlusion reactive hyperemia at a pressure of 50 mm Hg. Despite the remarkable changes in C ob, C db, C tb, and SO2, the value of C m, which is independent of temporary hemodynamics, remained almost unchanged during the measurements, as shown in Figs. 11, 14. The results shown in Figs. 10, 13 demonstrate that the use of ROIs of different sizes and in different parts of the hand would not change the results significantly. Although there are a number of artifacts due to the shadow originating from the curved and irregular surfaces of the hand, the lateral distributions of C m, C ob, C db, C tb, and SO2, and their responses to the occlusion were successfully visualized. Fig. 10Time courses averaged over the ROIs (white squares) in Fig. 9 of (a) oxygenated blood C ob, (b) deoxygenated blood C db, (c) total blood C tb, (d) oxygen saturation SO2, and (e) melanin C m. The error bars show the standard deviations for each ROI.  Fig. 12Typical images of in vivo measurements during cuff occlusion at 50 mm Hg (from top to bottom: RGB image, C ob, C db, C tb, SO2, and C m). 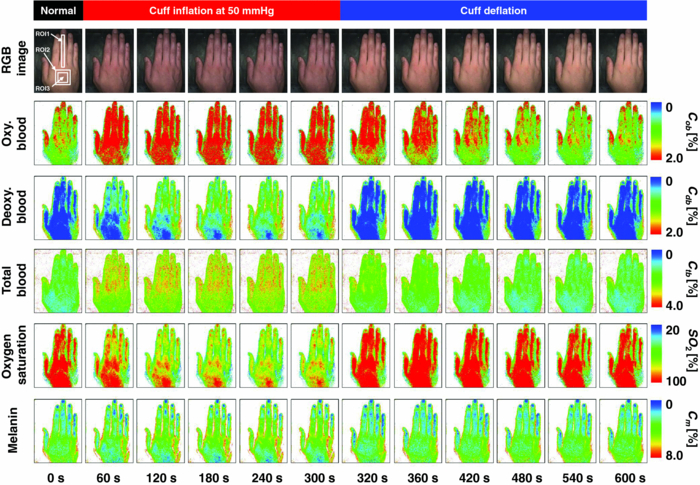 Fig. 13Time courses averaged over the ROIs (white squares) in Fig. 12 of (a) oxygenated blood C ob, (b) deoxygenated blood C db, (c) total blood C tb, (d) oxygen saturation SO2, and (e) melanin C m. The error bars show the standard deviations for each ROI. 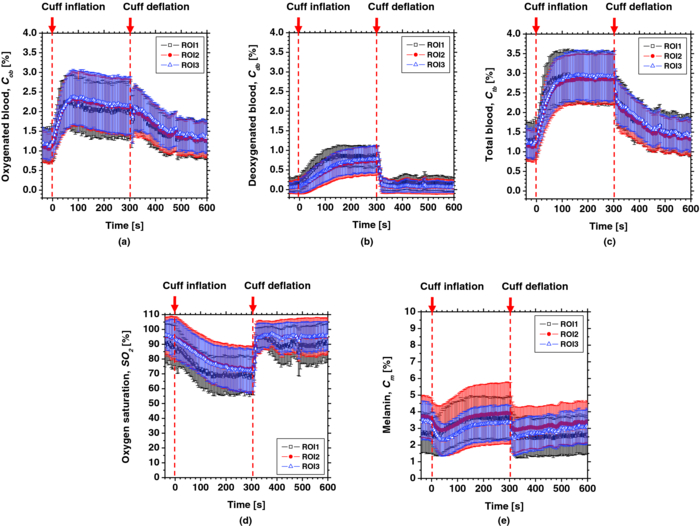 Fig. 14Time courses of (a) C ob, (b) C db, (c) C tb, (d) SO 2, and(e) C m averaged over the three ROIs for all 14 subjects during cuff occlusion at 50 mm Hg. The error bars show the standard deviations (n = 14).  Figure 15 shows images obtained from a Japanese subject of the inner forearm skin including a freckle. A high melanin concentration is observed in the area of the freckle and the estimated values of oxygenated and deoxygenated blood are extremely low and high, respectively. The RGB values in high-melanin areas of freckles will be very small at very low resolution, and the conversion to XYZ color space could compound likely artifacts in measurement. In this case, the conversion from RGB color space to XYZ color space may cause misestimation of oxygenated and deoxygenated blood in the dermis. The results shown in Fig. 15 imply a limitation of the method in measuring the hemodynamics of people with darker skin colors. Experiments involving individuals of African or Indian descent should be performed in the future. Fig. 15Images of the inner forearm skin including a freckle obtained from a Japanese subject. (a) RGB image, (b) melanin C m, (c) oxygenated blood C ob, (d) deoxygenated blood C db, (e) total blood C tb, and (f) oxygen saturation SO2.  We used a single thickness for the epidermis and the dermis and only one typical wavelength-dependent scattering value and anisotropy for skin in the Monte Carlo simulation to derive the regression Eqs. 8, 9, 10 for the concentration of melanin C m, oxygenated blood C ob, and deoxygenated blood C db. We also assumed a single thickness for the epidermis and the dermis in the Monte Carlo simulation. As expected from the results of phantom experiments, changes in these parameters will affect the regression model. Diffusely reflected light from the skin will increase as the absorption of light in skin becomes small and will increase as the scattering coefficient μ s(λ) becomes small. Thus, if the scattering coefficients μ s(λ) of a sample are larger than the typical values used in the Monte Carlo simulation, the regression model will underestimate the chromophore concentrations. Diffusely reflected light from the skin will also increase as the anisotropy factors g(λ) decrease. Therefore, if the anisotropy factors g(λ) of a sample are larger than the typical values, the regression model will underestimate the chromophore concentrations. The probability that light is absorbed by melanin in the epidermis will be higher than the probability that light is absorbed by blood in the dermis as the epidermis becomes thicker. Therefore, if the thickness t of the epidermis is larger than the typical values, then the concentration of melanin in the epidermis or that of blood may be under- or overestimated, respectively. Hence, the measurements could be varied with the changes in the scattering coefficients μ s(λ), the anisotropy factors g(λ), and the thickness t of each layer. However, the possibility of relative measurements of melanin, oxygenated blood, and deoxygenated blood in the skin tissue could still prove valuable. Studies on the Monte Carlo simulation model with the variations in the scattering coefficients, the anisotropy factors, and the thickness of each layer would strength the method in the future. We will investigate the matrix N 2 involving those variations further in future work. This method should integrate all information along the depth direction because it relies on diffuse reflection. Therefore, the imaging system does not limit the depth of the measurement. The RGB camera used in the present study has a spectral sensitivity in the visible wavelength region from 400 to 700 nm. Light at longer wavelengths in this region may penetrate the subcutaneous region. Thus, the measurements shown in Figs. 9, 10, 11, 12, 13, 14 in the original manuscript may reflect the hemodynamics not only of skin but also of the overall limb. This is supported by the fact that the time courses of C tb shown in Figs. 9 through 14 correlate with the SPG reading, which measures the total blood flow primarily through skeletal muscle, skin, and bone. Cuff pressures of 50 and 250 mm Hg used in the in vivo experiments should usually be higher than the venous blood pressures. Occlusions of the forearm with these pressures, therefore, may induce the onset of edema.36, 37, 38 Edema will change the volume of the limb, thereby diluting the bulk concentration of the chromophores and some biological scatterers in the skin tissue. In such a case, under- or overestimation of C m, C ob, and C db may have occurred due to the decrease in the bulk absorption or bulk scattering, respectively. The Monte Carlo simulated spectra in this study were noise-free, while the measured spectra always contain some noise in real applications. Since the matrix N 2 is determined on the basis of the Monte Carlo simulated spectra, the estimated concentrations of chromophores can be affected by the noise. Although we performed the averaging procedure to reduce the noise component in the RGB image, the results presented in the manuscript may still have some errors due to the noise. It would be reasonable to add some noise in the Monte Carlo simulated spectra to simulate reality better and improve the robustness of the method. It may be helpful to apply partial least square (PLS) regression analysis instead of multiple regression analysis to obtain the matrix N 2, because PLS regression analysis is particularly suited when the matrix of predictors has more variables than observations, and when there is multicollinarity among predictor variables. The imaging system used in the present study does not eliminate specular reflection from the measured reflected image. Thus, there should be some specular components in the measured RGB signals. On the other hand, we did not take the specular reflectance into account in the Monte Carlo simulation model. This specular component included in the measured RGB values could provide the estimation errors in C m, C ob, and C db. The specular reflection may be eliminated by the use of the polarized imaging technique. These considerations should be investigated in the future. 5.ConclusionIn summary, we investigated a method that was specifically developed for visualizing concentrations of melanin, oxygenated blood, and deoxygenated blood distributed in skin tissue using RGB digital images. Monte Carlo simulation of light transport in the skin tissue specified a relation between the chromophore concentrations and RGB values. Images of total blood concentrations and oxygen saturation were also reconstructed. The feasibility of this method for monitoring the oxygenation state of blood in skin tissue was demonstrated through experiments using tissue-like agar gel phantoms. In vivo experiments confirmed the ability of the method to visualize the concentration of melanin, oxygenated blood, deoxygenated blood, total blood, and tissue oxygen saturation. The responses of the total blood concentration in the skin of the human hand acquired by this method as well as forearm volume changes obtained from the conventional SPG were comparable during upper arm occlusion at pressures of 50 and 250 mm Hg. The results of the present study demonstrate the possibility of visualizing the hemodynamics of subsurface skin tissue. The great advantages of this method are its simplicity and applicability, because the only devices required are a digital RGB camera with a known color profile, a white light source, and a personal computer. We expect to further extend this method in order to investigate the physiological and clinical indices of blood flow, such as the arterial inflow rate, the venous capacitance, and the maximum venous outflow. AcknowledgmentsThe present study was supported in part by a Grant-in-Aid for Scientific Research from the Japan Society for the Promotion of Science. ReferencesJ. B. Dawson, D. J. Barker, D. J. Ellis, E. Grassam, J. A. Cotterill, G. W. Fisher, and
J. W. Feather,
“A theoretical and experimental study of light absorption and scattering by in vivo skin,”
Phys. Med. Biol., 25 695
–709
(1980). https://doi.org/10.1088/0031-9155/25/4/008 Google Scholar
J. W. Feather, M. H. -Saffar, G. Leslie, and
J. B. Dawson,
“A portable scanning reflectance spectrophotometer using visible wavelengths for the rapid measurement of skin pigments,”
Phys. Med. Biol., 34 807
–820
(1989). https://doi.org/10.1088/0031-9155/34/7/002 Google Scholar
D. K. Harrison, S. D. Evans, N. C. Abbot, J. S. Beck, and
P. T. McCollum,
“Spectrophotometric measurements of haemoglobin saturation and concentration in skin during the tuberculin reaction in normal human subjects,”
Clin. Phys. Physiol. Meas., 13 349
–363
(1992). https://doi.org/10.1088/0143-0815/13/4/005 Google Scholar
D. J. Newton, D. K. Harrison, C. J. Delaney, J. S. Beck, and
P. T. McCollum,
“Comparison of macro- and maicro-lightguide spectrophotometric measurements of microvascular haemoglobin oxygenation in the tuberculin reaction in normal human skin,”
Physiol. Meas., 15 115
–128
(1994). https://doi.org/10.1088/0967-3334/15/2/002 Google Scholar
A. A. Stratonnikov and
V. B. Loschenov,
“Evaluation of blood oxygen saturation in vivo from diffuse reflectance spectra,”
J. Biomed. Opt., 6 457
–467
(2001). https://doi.org/10.1117/1.1411979 Google Scholar
G. Zonios, J. Bykowski, and
N. Kollias,
“Skin melanin, hemoglobin, and light scattering properties can be quantitatively assessed in vivo using diffuse reflectance spectroscopy,”
J. Invest. Dermatol., 117 1452
–1457
(2001). https://doi.org/10.1046/j.0022-202x.2001.01577.x Google Scholar
G. N. Stamatas and
N. Lollias,
“Blood stasis contributions to the perception of skin pigmentation,”
J. Biomed. Opt., 9 315
–322
(2004). https://doi.org/10.1117/1.1647545 Google Scholar
I. Nishidate, Y. Aizu, and
H. Mishina,
“Estimation of melanin and hemoglobin in skin tissue using multiple regression analysis aided by Monte Carlo simulation,”
J. Biomed. Opt., 9 700
–710
(2004). https://doi.org/10.1117/1.1756918 Google Scholar
P. R. Bargo, S. A. Prahl, T. T. Goodell, R. A. Sleven, G. Koval, G. Blair, and
S. L. Jacques,
“In vivo determination of optical properties of normal and tumor tissue with white light reflectance and empirical light transport model during endoscopy,”
J. Biomed. Opt., 10 034018
(2005). https://doi.org/10.1117/1.1921907 Google Scholar
S.-H. Tseng, P. Bargo, A. Durkin, and
N. Kollias,
“Chromophore concentrations, absorption and scattering properties of human skin in vivo,”
Opt. Expess, 17 14599
–14617
(2009). https://doi.org/10.1364/OE.17.014599 Google Scholar
M. G. Sowa, J. R. Payette, M. D. Hewko, and
H. H. Mantsch,
“Visible-near infrared multispectral imaging of the rat dorsal skin flap,”
J. Biomed. Opt., 4 474
–481
(1999). https://doi.org/10.1117/1.429957 Google Scholar
A. K. Dunn, A. Devor, H. Bolay, M. L. Andermann, M. A. Moskowitz, A. M. Dale, and
D. A. Boas,
“Simultaneous imaging of total cerebral hemoglobin concentration, oxygenation, and blood flow during functional activation,”
Opt. Lett., 28 28
–30
(2003). https://doi.org/10.1364/OL.28.000028 Google Scholar
A. Vogel, V. V. Chernomordik, J. D. Riley, M. Hassan, F. Amyot, B. Dasgeb, S. G. Demos, R. Pursley, R. F. Little, R. Yarchoan, Y. Tao, and
A. H. Gandjbakhche,
“Using noninvasive multispectral imaging to quantitatively assess tissue vasculature,”
J. Biomed. Opt., 12 051604
(2007). https://doi.org/10.1117/1.2801718 Google Scholar
N. Tsumura, H. Haneishi, and
Y. Miyake,
“Independent-component analysis of skin color image,”
J. Opt. Soc. Am., A 16 2169
–2176
(1999). https://doi.org/10.1364/JOSAA.16.002169 Google Scholar
J. O’Doherty, J. Henricson, C. Anderson, M. J. Leahy, G. E. Nilsson, and
F. Sjöberg,
“Sub-epidermal imaging using polarized light spectroscopy for assessment of skin microcirculation,”
Skin Res. Technol, 13 472
–484
(2007). https://doi.org/10.1111/j.1600-0846.2007.00253.x Google Scholar
J. O’Doherty, P. McNamara, N. T. Clancy, J. G. Enfield, and
M. J. Leahy,
“Comparison of instruments for investigation of microcirculatory blood flow and red blood cell concentration,”
J. Biomed. Opt., 14 034025
(2009). https://doi.org/10.1117/1.3149863 Google Scholar
D. Nakao, N. Tsumura, and
Y. Miyake,
“Real-time multi-spectral image processing for mapping pigmentation in human skin,”
80
–84
(2001). Google Scholar
I. Nishidate, K. Sasaoka, T. Yuasa, K. Niizeki, T. Maeda, and
Y. Aizu,
“Visualizing of skin chromophore concentrations by use of RGB images,”
Opt. Lett., 33 2263
–2265
(2008). https://doi.org/10.1364/OL.33.002263 Google Scholar
L.-H. Wang, S. L. Jacques, and
L.-Q. Zheng,
“MCML-Monte Carlo modeling of photon transport in multi-layered tissues,”
Comput. Methods Programs Biomed., 47 131
–146
(1995). https://doi.org/10.1016/0169-2607(95)01640-F Google Scholar
S. L. Jacques, R. D. Glickman, and
J. A. Schwartz,
“Internal absorption coefficient and threshold for pulsed laser disruption of melanosomes isolated from retinal pigment epithelium,”
Proc. SPIE, 2681 468
–477
(1996). https://doi.org/10.1117/12.239608 Google Scholar
S. L. Jacques,
“Origins of tissue optical properties in the UVA, Visible, and NIR region,”
OSA TOPS on Advances in Optical Imaging and Photon Migration, 2 364
–369 Optical Society of America, Washington, DC
(1996). Google Scholar
M. J. C. van Gemert, S. L. Jacques, H. J. C. M. Sterenborg, and
W. M. Star,
“Skin optics,”
IEEE Trans. Biomed. Eng., 36 1146
–1154
(1989). https://doi.org/10.1109/10.42108 Google Scholar
A. Knüttel and
M. Boehlau-Godau,
“Spatially confined and temporally resolved refractive index and scattering evaluation in human skin performed with optical coherence tomography,”
J. Biomed. Opt., 5 83
–92
(2000). https://doi.org/10.1117/1.429972 Google Scholar
P. D. Ninni, F. Martelli, and
G. Zaccanti,
“The use of India ink in tissue-simulating phantoms,”
Opt. Express, 18 26854
–26865
(2010). https://doi.org/10.1364/OE.18.026854 Google Scholar
D. Gniechwitz, N. Reichardt, J. Ralph, M. Blaut, H. Steinhart, and
M. Bunzel,
“Isolation and characterisation of a coffee melanoidin fraction,”
J. Sci. Food. Agric., 88 2153
–2160
(2008). https://doi.org/10.1002/jsfa.3327 Google Scholar
H. Motai and
S. Inoue,
“Conversion of color components of melanoidin produced from the glycine-xylose system,”
Agric. Bio. Chem., 38 233
–239
(1974). https://doi.org/10.1271/bbb1961.38.233 Google Scholar
A. Serban and
A. Nissenbaum,
“Light induced production of hydrogen from water by catalysis with ruthenium melanoidins,”
Int. J. Hydrogen Energy, 25 733
–737
(2000). https://doi.org/10.1016/S0360-3199(99)00086-5 Google Scholar
I. Nishidate, Y. Aizu, and
H. Mishina,
“Estimation of absorbing components in a local blood layer embedded in the turbid media on the basis of visible to near-infrared (VIS-NIR) reflectance spectra,”
Opt. Rev., 10 427
–435
(2003). https://doi.org/10.1007/s10043-003-0427-7 Google Scholar
I. Nishidate, T. Maeda, Y. Aizu, and
K. Niizeki,
“Visualizing depth and thickness of a local blood region in skin tissue using diffuse reflectance images,”
J. Biomed. Opt., 12 054006
(2007). https://doi.org/10.1117/1.2798703 Google Scholar
H. J. van Staveren, C. J. M. Moes, J. Marle, S. A. Prahl, and
M. J. C. Gemert,
“Light scattering in Intralipid-10% in the wavelength range of 400-1100 nm,”
Appl. Opt., 30 4507
–4514
(1991). https://doi.org/10.1364/AO.30.004507 Google Scholar
Y. Higashi, S. Sasaki, K. Nakagawa, T. Ueda, A. Yoshimizu, S. Kurisu, H. Matsuura, G. Kajiyama, and
T. Oshima,
“A comparison of angiotensin-converting enzyme inhibitors, calcium antagonists, beta-blockers and diuretic agents on reactive hypermia in patients with essential hypertension: a multicenter study,”
J. Am. Coll. Cardio, 35 284
–291
(2002). https://doi.org/10.1016/S0735-1097(99)00561-6 Google Scholar
R. J. Cody, F. B. Müller, S. H. Kubo, H. Rutman, and
D. Leonard,
“Identification of the direct vasodilator effect of milrinone with an isolated limb preparation in patients with chronic congestive heart failure,”
Circulation, 73 124
–129
(1986). https://doi.org/10.1161/01.CIR.73.1.124 Google Scholar
D. E. Hokanson, D. S. Sumner, and
D. E. Strandness,
“An electrically calibrated plethysmograph for direct measurement of limb blood flow,”
IEEE Trans. Biomed. Eng., 22 25
–29
(1975). https://doi.org/10.1109/TBME.1975.324535 Google Scholar
G. N. Stamatas, M. Southall, and
N. Kollias,
“In vivo monitoring of cutaneous edema using spectral imaging in the visible and near infrared,”
J. Investigat. Dermatol., 126 1753
–1760
(2006). https://doi.org/10.1038/sj.jid.5700329 Google Scholar
G. N. Stamatas and
N. Kollias,
“In vivo documentation of cutaneous inflammation using spectral imaging,”
J. Biomed. Opt., 12 051603
(2007). https://doi.org/10.1117/1.2798704 Google Scholar
K. G. Brodovicz, K. McNaughton, N. Uemura, G. Meininger, C. J. Girman, and
S. H. Yale,
“Reliability and feasibility of methods to quantitatively assess peripheral edema,”
Clin. Med. Res., 7 21
–31
(2009). https://doi.org/10.3121/cmr.2009.819 Google Scholar
|
||||||||||||||||||||||||||||||||||||||||||


