|
|
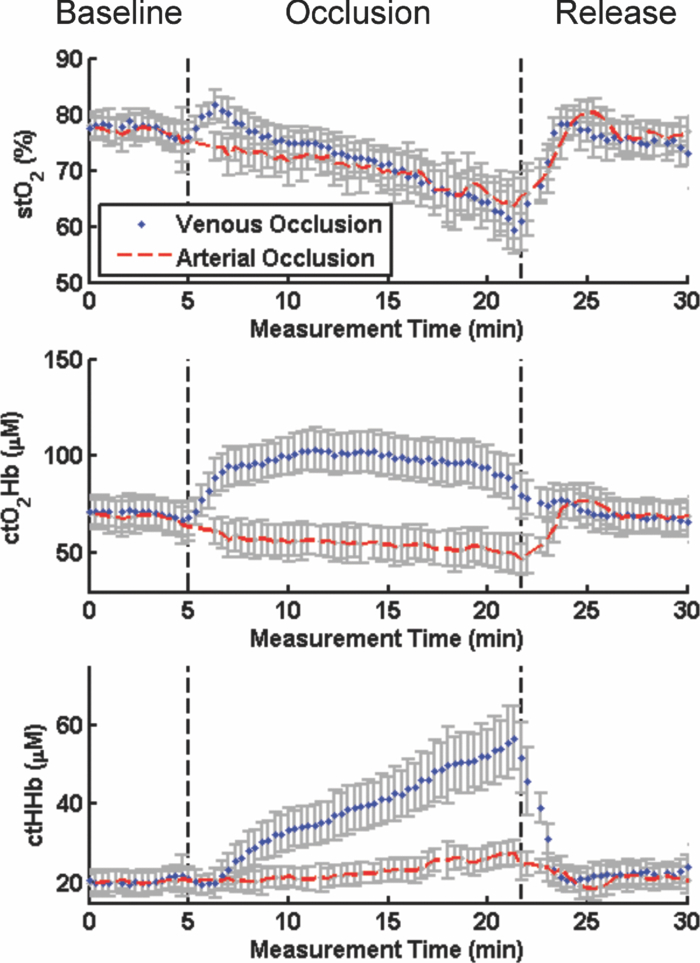
1.IntroductionThe introduction of pulse oximetry in the 1970s provided a new vital sign to physicians for monitoring patient care.1, 2, 3 While easy to use and relatively inexpensive, pulse oximetry only monitors arterial oxygenation. More recent advances in modeling and instrumentation have led to the development of quantitative spectroscopic probes capable of measuring total tissue oxygenation (arterial & venous).4, 5, 6, 7, 8, 9 However, these devices typically provide local measurements and require a priori knowledge of the location of a potential oxygenation defect. Thus, an imaging system that offers truly passive monitoring by measuring large areas of tissue oxygenation without a priori knowledge would aid patient management in many surgical and critical care applications. Near-infrared (NIR) spectroscopy methods rely on the attenuation of light as a function of wavelength to provide information on tissue constituents and function. 10, 11, 12, 13, 14, 15, 16 These methods quantify tissue chromophores (i.e., oxyhemoglobin, deoxyhemoglobin, lipids, and water) by deconvolving the spectral signature of each constituent. Such methods can be used in an imaging geometry by shining planar and constant, i.e., continuous wave, multispectral illumination on tissue to extract two-dimensional depth-averaged maps of blood volume, and blood oxygenation in living tissue over larger fields of view (>5 cm2). 17, 18, 19, 20, 21, 22, 23 However, variations in optical path length due to multiple scattering can be a major challenge for accurate chromophore measurement using these methods. Temporally and spatially resolved techniques can separate absorption and reduced scattering coefficients (μ a and μ s ′), which can be combined with spectroscopic methods to extract path length-corrected chromophore concentrations. 24, 25, 26, 27, 28, 29, 30 Spatial frequency domain imaging (SFDI, a.k.a. spatially modulated near-infrared light), is a spatially resolved technique that allows for fast (<1 s) and accurate measurement of optical properties at a single wavelength over large fields of view (>100 cm2).31, 32 Spectrally resolved SFDI quantifies tissue chromophores while accounting for multiple scattering, which makes it a potential candidate for rapidly performing oxygenation imaging over large fields of view in a clinical setting.33, 34 In this study, we present the design, validation, and clinical translation of an SFDI system for intraoperative imaging of oxygenation. First, we introduce the design of our clinically compatible SFDI system, which has been optimized for surface profile correction and wavelength selection. Second, we validate the SFDI system in a preclinical environment by comparing extracted oxygenation maps with a clinical FDA-approved oxygenation probe (ViOptix) during measurements of skin flap, bowel, and liver in Yorkshire pigs. Finally, we present a first-in-human pilot study for tissue oxygenation measurements of a skin flap during breast reconstructive surgery after a mastectomy. 2.Materials and Methods2.1.SFDISFDI has been well described in the literature so only a brief description is provided here. Researchers have shown that the spatial intensity decay of the diffuse reflectance from a point illumination is dependent upon the optical properties of the medium.24, 25 This decay can also be referred to as the spatial “point-spread function” (s-PSF) of the turbid medium and its measurement can be used to deduce the optical properties of the medium. An alternative method to measure this spatially dependent decay in the frequency domain has been proposed by Dögnitz and Wagnieres31 and Cuccia 32 This method characterizes the Fourier equivalent of the s-PSF, or the spatial “modulation transfer function” (s-MTF), by measuring the attenuation of the ac amplitude of a two-dimensional intensity sine wave as a function of spatial frequency. The variation of the ac amplitude as a function of frequency permits the recovery of optical properties over large fields of view (typically >5 cm).32, 35, 36, 37 SFDI has been implemented in several applications including fluorescence imaging,38, 39 brain imaging,40 skin imaging,33, 34, 41 and absorption tomography.35, 42, 43, 44, 45 In this study, we used the look-up table (LUT)-based approach described by Cuccia and used two spatial frequencies (0 and 0.2 mm−1) to separate absorption from scattering.32, 46 The ac component of the intensity sine wave was extracted using a demodulation of three offset phases (0°, 120°, and 240°) per frequency. The LUT was generated using a Monte Carlo model and used to compute the optical properties in a rapid fashion. Clinical translation of SFDI required additional work to ensure proper function in a clinical setting. First, surface topography poses a significant challenge in a noncontact and wide-field geometry by causing intensity variations. To account for this, we designed and implemented a robust and fast surface profile correction method that allows accurate measurements of optical properties over a large range of height and surface angles.47 Second, near real-time imaging is an effective feedback tool needed by the surgeon during the procedure. Acquisition time due to spectral density is a major limitation for imaging times. Thus, we proposed and validated a wavelength optimization procedure that reduced acquisition times without sacrificing chromophore measurement accuracy.48, 49, 50 2.2.Imaging SystemThe imaging system used in this study is based on the fluorescence-assisted resection and exploration (FLARETM) imaging system developed at the Beth Israel Deaconess Medical Center. This instrument has been successfully translated to the clinic for patients undergoing sentinel lymph node resection for breast cancer staging and for patients undergoing breast reconstruction following mastectomy.51, 52, 53 The FLARETM system head is composed of two co-registered NIR cameras, an RGB color camera, and a light-emitting diode (LED)-based light source. In this study, we modified the system head and light source by incorporating a custom multispectral laser-based source and a spatial light modulator to project patterns of light. These modifications are designed to enable both exogenous fluorescence and endogenous contrast imaging of chromophores in tissue, while taking advantage of the clinical compatibility of the FLARETM system for clinical translation of SFDI. 2.3.NIR Light SourceHigh power multispectral light sources deliverable to a digital micromirror device (DMD) are currently unavailable. The small entrance of the DMD (∼6 mm × 4.5 mm) requires a low etendue light source (small diameter and divergence) for efficient coupling. Our previous approach towards surgical light sources used LEDs,54 but this technology does not meet the etendue requirement for efficient coupling into a DMD. Supercontinuum lasers are good candidates for this application, but their power is too low and their cost is prohibitive. Thus, we designed a custom fiber-coupled multispectral light source based on laser diodes. Laser diodes were chosen because they are small in size, easily coupled into small diameter optical fibers, high power, and available at various wavelengths. Six discrete laser diodes (670, 730, 760, 808, 860, and 980 nm) were selected based on a previous wavelength optimization study to measure endogenous contrast (i.e., hemoglobin, water, and lipids),50 and also to perform fluorescence imaging of FDA approved agents such as methylene blue and indocyanine green (670- and 760-nm excitation, respectively).53 The two fluorescence-dedicated wavelengths required much higher power than those used for tissue chromophore imaging to collect sufficient fluorescence signal. A total of 12 laser diodes were integrated in the light source (4 diodes per fluorescence-dedicated wavelength and 1 diode per chromophore-dedicated wavelength). Laser diodes were purchased from RPMC Lasers, Inc. (O’Fallon, Missouri) and manufactured by LDX Optronics (Maryville, Tennessee). They were fiber-coupled into 300-μm, 0.37 NA fibers using custom tuned couplers with integrated thermoelectric coolers (TEC) from OZOptics (Ottawa, Ontario). A 12 to 1 fiber bundle from CeramOptec (East Longmeadow, Massachusetts) was used to combine all wavelengths (12 legs of 300 μm solid core to a 1.33-mm common end, 0.37 NA). Each diode and TEC were controlled by a Thorlabs, Inc. (Newton, New Jersey) OEM controller with ±3 Amp current driving capability for both the diode and the TEC. Custom printed circuit boards were used for ensuring device interconnection. A central board with serial peripheral interface (SPI) integrated circuits (digital to analog converters and port expanders) and USB-SPI controller (DIMAX Inc., Seattle, Washington) ensured communication with a PC. All devices were enclosed in a custom made enclosure (OZOptics) with forced fan cooling and a single FC output connector with an interlocked proximity sensor (OZOptics) to ensure the light source was turned off when the fiber was disconnected. Two 900-W ac-dc power supplies (COSEL, Toyama, Japan) were used to provide power to the light source. 2.4.Imaging HeadA 0.7-in. XGA (1024 × 768 pixel resolution) digital light projector control board (GFM, Berlin, Germany) and NIR compatible projection optics (Carl Zeiss, Oberkochen, Germany) were purchased from Modulated Imaging, Inc. (Irvine, California). The light source output was fiber-coupled (1.5 mm diameter, 0.44 NA fiber from Ceramoptec) to the entrance of the DMD using custom coupling hardware compatible with Thorlab's SM1 thread manufactured by Modulated Imaging, Inc. The DMD and projection optics were integrated into a custom designed housing compatible with the FLARETM imaging system; therefore, easily translatable to clinical trials. Eighteen rebel LED white light modules were included to provide more than 40,000 lux of NIR-depleted white light during surgery.54 The collection optics used for this system were the same as those used for the FLARETM imaging system as previously described51 and included 1 color camera (IMI Technology, Seoul, Korea) co-registered with 2 NIR cameras (Hamamatsu, Bridgewater, New Jersey) permitting simultaneous acquisition of color and NIR information. Light paths are depicted in Fig. 1a. The light was projected from the DMD module and collected through an objective lens before being diverted to 3 wavelengths ranges by dichroic mirrors: color (below 680 nm), NIR1 (between 680 and 770 nm), and NIR2 (above 770 nm). A 650-nm short pass filter was used in front of the color camera to reject NIR illumination. A 655-nm long pass filter was used in front of the NIR1 camera and a 785-nm long pass filter was used in front of the NIR2 camera to reject stray light to these cameras. Linear polarizers (Moxtek, Inc., Orem, Utah) were cross-polarized at the source and detector, respectively, to isolate photons that diffused into the tissue and prevent data contamination from specular reflections. A small aperture size was used (under f/11) to permit large depth-of-field imaging needed for large height variations (>3 cm) encountered in a surgical environment, and to limit the light incidence angle for maximum interference filter efficiency. Fig. 1Clinical imaging system working in the spatial frequency domain: (a) Schematics of the system showing the light paths for all wavelengths into the system imaging head. The light from the NIR light source is propagated to the DMD and projected onto the field through polarizer #1. Light is then collected though polarizer #2 and split onto the three cameras using dichroic mirrors. Wavelengths shown in green and red are collected by NIR cameras 1 and 2, respectively. (b) Picture of the clinical imaging system composed of a cart containing the NIR light source, control electronics, computer, mast, and arm holding the adjustable imaging head. (c) Computer-aided design semi-transparent drawing of the illumination section of the imaging head. Note white light LED modules and the DMD projection module. (d) Bottom view of the actual illumination section of the imaging head. Note the white light LED modules, the DMD projection optics, and the cone aperture. 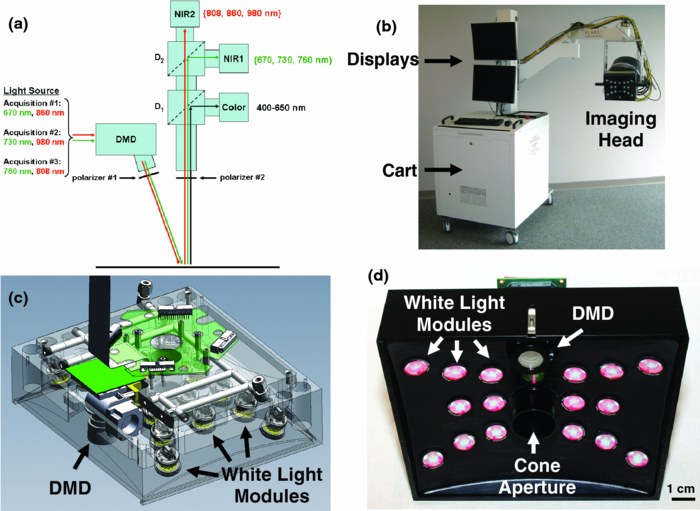 2.5.Acquisition and ProcessingThe SFDI acquisition sequence included 2 spatial frequencies (0 and 0.2 mm−1), and 3 phases (0, 120, and 240 deg) at each wavelength for optical properties measurements.32 One spatial frequency (0.15 mm−1) was projected at 3 phases at 670 nm to extract surface profile using phase shifting profilometry.55, 56 Optical properties measurements were typically acquired with wavelength pairs ([670, 860], [730, 980], and [760, 808] nm) as shown in Fig. 1a. A color image acquisition was taken at the beginning of each acquisition sequence. A calibration measurement of a tissue simulating phantom with known optical properties was taken at 5 heights ranging from −2 cm to +2 cm of vertical translation relative to a 45-cm imaging plane before the system was used in surgery.47 The entire system was wrapped in a sterile shield and drape for clinical measurements (Medical Technique Inc., Tucson, Arizona). Image acquisition software written and designed in C# by Modulated Imaging, Inc. was used to synchronize and control the DMD projection, light source, cameras, and data storage. Custom software was written in MATLAB (Mathworks; Natick, Massachusetts) to extract surface profile-corrected optical properties and chromophore content fitting (oxyhemoglobin [ctO2Hb] and deoxyhemoglobin [ctHHb] and water [ctH2O]). Images were collected during surgery in real time and post-processed. 2.6.Oxygenation Measurement Reference DeviceSFDI results were compared with an FDA-approved local oxygenation probe in order to validate extracted measurements of tissue saturation. The ViOptix T.Ox (Tissue Oximeter) is a contact probe with 2 sources (690 and 830 nm) and 2 detectors that measures tissue oxygenation (arterial and venous). The probe is FDA-approved and has been used in reconstructive surgery to predict flap viability,57, 58 making it an appropriate technology to compare with SFDI. 2.7.Animal ExperimentsRecent work from Pharaon and Yafi presented a preclinical model and results from pedicle flap vascular occlusion in Wister rats using a multispectral SFDI system.33, 34 In a similar manner, in vivo validation of our clinical SFDI system was accomplished by performing arterial and venous occlusions of skin flap, bowel, and liver on large animals approaching the size of humans. Yorkshire pigs weighing 30 kg and of either sex were purchased from E. M. Parsons and Sons (Hadley, Massachusetts). Anesthesia was induced using 4.4 mg/kg intramuscular Telazol (Fort Dodge Labs, Fort Dodge, Iowa), and maintained through a 7-mm endotracheal tube with 1.5% isoflurane/balance O2 at 5 l/min. Arterial and venous occlusions in three different tissues/organs were performed. Animals were used under the supervision of a protocol approved by the institution. For skin flap measurements, pedicle abdominal flaps were designed to encompass the deep superior epigastric artery (DSEA) and deep superior epigastric vein (DSEV). Arterial or venous occlusion models were completed by using the bulldog clamps to occlude the DSEA or DSEV, respectively. The measurement consisted of 5 min of baseline acquisition, followed by 17 min occlusion (arterial or venous) and 15 min recovery. The SFDI system was placed at a 45 cm (∼18 in.) working distance from the skin flap. The Vioptix local oxygenation probe was placed in the field of view (FOV) of the SFDI measurements with black tape was placed over it to prevent light contamination from either system. Vioptix tissue oxygenation was recorded at the end of each SFDI measurement in order to coregister measured values of both systems. For bowel (jejunum) measurements, a standard midline laparotomy was performed, a right transrectus incision was added, and a section of the jejunum was exposed. The superior mesenteric vein was exposed and clamped using a hemostat for a venous occlusion model. A rubber band was used between the vein and the hemostat to prevent injury to the vein. First, 4 min of baseline acquisition was performed, followed by 11 min occlusion and 15 min recovery. The experimental setup was similar during the skin flap measurements, except that the Vioptix local oxygenation probe was placed on a posterior section of the bowel and stitched to maintain contact with the bowel. For liver measurements, the hepatoduodenal ligament, which includes the hepatic artery and portal vein, was clamped to produce both arterial and venous occlusion. A hemostat was used with a rubber band during clamping to prevent damage. First, 5 min of baseline acquisition was performed, followed by 10 min occlusion and 15 min recovery. The experimental setup was the same as during previous measurements. The ViOptix probe was placed on the liver in the same field of view as the SFDI measurement. The ViOptix probe suffered from contact issues during the measurement and lost contact with the liver at some time points. After each study, anesthetized pigs were euthanized by rapid intravenous injection of 10 ml of Fatal-Plus (Vortech Pharmaceuticals, Dearborn, Michigan). 2.8.First-in-Human Pilot StudyThe clinical pilot study was approved by the Institutional Review Board (IRB) of the Beth Israel Deaconess Medical Center and was performed in accordance with the ethical standards of the Helsinki Declaration of 1975. The IRB deemed the SFDI imaging system a “nonsignificant risk” device. Study subjects were women undergoing unilateral or bilateral mastectomy and reconstruction with a microsurgical deep inferior epigastric perforator flap. Two SFDI measurements were first taken before flap elevation by positioning the system 45 cm over each abdomen. Based on standard practice, the surgeon chose to elevate one of these 2 flaps for transfer to the chest. A third SFDI measurement was taken following dissection of the vessels through the intramuscular course and isolation of the selected perforator vessels and vascular pedicle. The flap was then transferred to the chest and a microsurgical anastomosis was performed of the deep inferior epigastric artery and vein to the internal mammary vessels. A final measurement was performed using SFDI at this time point. Results from the SFDI measurements were not accessible to the operating surgeons in this feasibility study, thereby not altering the standard of care. Subjects were evaluated for complications at 1 week and 6 weeks after surgery as part of regular postoperative follow-up. 3.Results3.1.Imaging SystemA picture of the clinical SFDI system is shown in Fig. 1b. The system included a cart designed to withstand 10 deg tilt angle, a mast, and an arm positioning the imaging head in space with 6 degrees of freedom. The mobile cart contained all hardware and control electronics, including the computer and the NIR light source. The cart hosted two display monitors for the imaging system operator. The first showed the control software and the second displayed the surgeon's view. A mobile satellite pole with one monitor was used to display the image to the surgeon (not shown). A computer-aided design drawing from Design and Assembly Concepts, Inc. (Leander, Texas) using SolidWorks (Concord, Massachusetts) is shown in Fig. 1c. An actual picture of the imaging head manufactured by LAE Technologies, Inc. (Barrie, Ontario) is shown in Fig. 1d. Various components are indicated with arrows, such as white light modules and the DMD module. A 2-mm ring spacer (Edmund Optics, Barrington, New Jersey) between the NIR projection optics and the DMD was used to ensure projection of the image onto a 210 ×158 mm2 field of view focused at 45 cm. A schematic of the light source is shown in Fig. 2a. The optical output from several modules, composed of 1 laser diode, a TEC, a heatsink, and custom coupling hardware, were combined together into a 12-to-1 fiber bundle. Coupling efficiencies ranged from 60% to 80%. A picture of the assembled light source is shown in Fig. 2b. The light source was coupled to the DMD projector through a solid core fiber using an FC output connector with an interlocked proximity sensor to ensure the light source was turned off if the fiber was disconnected. Fig. 2Laser diode-based NIR light source: (a) Schematics of the NIR light source. Note the wavelength modules composed of one laser diode, a TEC with its heatsink, and an FC coupler. The wavelength modules are combined through a 12-to-1 fiber bundle. (b) Picture of the actual NIR laser light source with the top cover removed. Note the wavelength modules and the fiber bundle.  All together, the imaging system was capable of providing irradiances of 1.1, 0.5, 2.0, 0.75, 0.40, and 0.35 mW/cm2 at 670, 730, 760, 808, 860, and 980 nm, respectively, over a 210 ×158 mm2 FOV. Exposure times were determined automatically using a tissue-like phantom (μ a = 0.02 mm−1 and μ s = 1 mm−1 at 670 nm) before acquisition and typically consisted of 40, 120, 40, 40, 70, and 470 ms for 670, 730, 760, 808, 860, and 980 nm, respectively. SFDI acquisition required 6 images per pair of wavelengths and 3 additional images to perform profilometry. Thus, a total of 3.6 s was required to acquire a full set of data. This number included 2.8 s needed for acquisition at 980 nm due to poor CCD sensitivity. Full data sets were acquired every 20 s during in vivo animal experiments. Data were not acquired continuously during the first patient measurement to minimize disruption of the regular clinical workflow. Instead, a measurement was taken after each step of the procedure: before isolation on both sides, after elevation of the chosen flap, and after transfer of the chosen flap. 3.2.Animal ExperimentsResults from a venous skin flap occlusion are shown in Fig. 3. Color images before (t = 0 min), during (t = 20 min), and postocclusion (t = 30 min) are shown in Fig. 3 (top images). A purple discoloration of the tissue was observed during occlusion as blood pooled in the tissue. Tissue saturation maps determined from SFDI are plotted at the same time points in Fig. 3 (bottom images). Figure 3 (top graph) shows that the mean tissue saturation values determined by SFDI inside a region of interest (black square in Fig. 3 bottom images) revealed a maximum 25% decrease in tissue saturation after occlusion. The commercial ViOptix probe (bottom right of color image in Fig. 3) measured a 15% decrease in tissue saturation during the same time. We believe that the absolute saturation value differences between the devices are due to spatial variations in oxygen saturation and the different volumes being interrogated by each instrument. Finally, SFDI was able to extract individual oxyhemoglobin concentration (ctO2Hb) and deoxyhemoglobin concentration (ctHHb). These time traces showed an accumulation of each chromophore during occlusion as shown in Fig. 3 (bottom graph). This is consistent with expected blood pooling seen in the setting of venous stagnation. SFDI data were recorded continuously, and the images and graphs from Fig. 3 are presented in a time-lapse movie over the course of the experiment (1). Fig. 3Venous occlusion of skin flap in Yorkshire pig: Top images: Color images before, during occlusion, and after release, at t = 0, 20, and 30 min, respectively, and over the entire time course. Note a purple discoloration of the tissue during occlusion as blood pools in the tissue. The Vioptix probe can be seen at the bottom right corner of the image. Bottom images: Oxygen saturation images before, during occlusion, and after release, at t = 0, 20, and 30 min, respectively, and over the entire time course. Note the significant decrease in saturation of the right flap during the occlusion. Results are representative of N = 3 separate animals. Top graph: Comparison of SFDI and Vioptix oxygenation measurements as a function of time. SFDI oxygenation saturation values are averaged over a region of interest (black square in SFDI images). Standard deviation of SFDI measurements within the region of interest is also plotted (gray bars). Bottom graph: Concentrations of oxyhemoglobin (ctO2Hb, red) and deoxyhemoglobin (ctHHb, blue) measured using the imaging system as a function of time. Concentration values are averaged over a region of interest (black square in SFDI images). Standard deviation of SFDI measurements within the region of interest is also plotted (gray bars). (1, QuickTime, 1 MB).  The SFDI instrument can also be effectively used for splanchnic measurements. Results from venous occlusion of the bowel are shown in Fig. 4. Color images before (t = 0 min), during (t = 12 min), and postocclusion (t = 20 min) are shown in Fig. 4 (top images). A discoloration is observed in the bowel during the occlusion in the color image. Tissue saturation maps determined from SFDI are plotted at the same time points in Fig. 4 (bottom images). Mean tissue saturation values as determined by SFDI in a region of interest (black square in Fig. 4 bottom images) are plotted in Fig. 4 (top graph) during the course of the occlusion. A 38% drop in saturation from baseline was observed using SFDI. The ViOptix probe recorded the same trend with a 35% drop in the same time frame. Finally, SFDI extracted individual ctO2Hb and ctHHb concentrations and showed an accumulation of each chromophore during the occlusion consistent with expectations from venous stagnation (Fig. 4, bottom graph). The images and graphs from Fig. 4 are presented in a time-lapse movie over the course of the experiment (2). Fig. 4Venous occlusion of bowel in a Yorkshire pig: Top images: Color images before, during occlusion, and after release, at t = 0, 12, and 20 min, respectively, and over the entire time course. Note a purple discoloration of the tissue during occlusion as blood pools in the tissue. The Vioptix probe can be seen at the bottom right corner of the image. Bottom images: Oxygen saturation images before, during occlusion, and after release, at t = 0, 12, and 20 min respectively, and over the entire time course. Note the significant decrease in saturation during the occlusion. Results are representative of N = 3 separate animals. Top graph: Comparison of SFDI and Vioptix oxygenation measurements as a function of time. SFDI oxygenation saturation values are averaged over a region of interest (black square in SFDI images). Standard deviation of SFDI measurements within the region of interest is also plotted (gray bars). Bottom graph: Concentrations of oxyhemoglobin (ctO2Hb, red) and deoxyhemoglobin (ctHHb, blue) measured using the imaging system as a function of time. Concentration values are averaged over a region of interest (black square in SFDI images). Standard deviation of SFDI measurements within the region of interest is also plotted (gray bars). (2, QuickTime, 0.74 MB).  Results from vascular occlusion (arterial and venous) of the liver are shown in Fig. 5. Color images before (t = 0 min), during (t = 13 min), and postocclusion (t = 20 min) are shown in Fig. 5 (top images). Tissue saturation maps determined from SFDI are plotted at the same time points in Fig. 5 (bottom images). Mean tissue saturation values as determined by SFDI in a region of interest (black square in Fig. 5, bottom images) and the ViOptix probe are plotted during the course of the occlusion in Fig. 5 (top graph). SFDI recorded a maximum 50% drop in tissue saturation from baseline during the occlusion and the ViOptix probe recorded a 40% drop in tissue saturation during the same time frame. Several ViOptix data points could not be acquired due to issues with probe contact on the liver. Finally, SFDI extracted individual ctO2Hb and ctHHb concentrations and shows an exchange of hemoglobin state during the occlusion (Fig. 5, bottom graph). The trends in hemoglobin were characteristic of physiological expectations in a vascular occlusion (oxyhemoglobin is converted to deoxyhemoglobin with time). The images and graphs from Fig. 5 are presented in a time-lapse movie over the course of the experiment in 3. Fig. 5Vascular occlusion (arterial and venous) of liver in a Yorkshire pig: Top images: Color images before, during occlusion, and after release, at t = 0, 13, and 20 min, respectively, and over the entire time course. Note a purple discoloration of the tissue during occlusion as oxyhemoglobin is converted to deoxyhemoglobin in the tissue. The Vioptix probe can be seen at the bottom right corner of the image. Bottom images: Oxygen saturation images before, during occlusion and after release, at t = 0, 13, and 20 min, respectively, and over the entire time course. Note the significant decrease in saturation during the occlusion. Results are representative of N = 3 separate animals. Top graph: Comparison of SFDI and Vioptix oxygenation measurements as a function of time. SFDI oxygenation saturation values are averaged over a region of interest (black square in SFDI images). Standard deviation of SFDI measurements within the region of interest is also plotted (gray bars). Bottom graph: Concentrations of oxyhemoglobin (ctO2Hb, red) and deoxyhemoglobin (ctHHb, blue) measured using the imaging system as a function of time. Concentration values are averaged over a region of interest (black square in SFDI images). Standard deviation of SFDI measurements within the region of interest is also plotted (gray bars). (3, QuickTime, 1 MB).  SFDI is able to measure both oxyhemoglobin and deoxyhemoglobin and distinguish venous from arterial occlusion, improving ischemia diagnosis and treatment plan (Fig. 6). Local contact probes typically report tissue saturation values that drop for both arterial and venous occlusions. On the contrary, SFDI is able to discriminate between venous and arterial occlusion by tracking ctO2Hb and ctHHb individually in the tissue. The recovered saturation values using SFDI are shown in Fig. 6 (top graph) for a region of interest in a skin flap arterial (red) and venous (blue) occlusion measurements. Of special note, changes in oxygen saturation were nearly identical in both cases throughout the course of the experiment. As shown in Fig. 6, though, the type of occlusion was easily distinguishable by SFDI within 1 min of the event. By identifying the origin of the occlusion, surgeons could potentially intervene directly and without any delay during the surgery to avoid any further complications, otherwise not identified and repaired in time.57 3.3.First-in-Human Pilot StudyThe imaging system was deployed into the operating room by trained personnel. The system was draped in sterile fashion using a shield/drape combination that could be applied by a single person (scrub nurse). After draping, the imaging head entered the sterile field and was positioned at a fixed distance. Images were acquired to extract profile information and optical properties at several wavelengths, as described previously. Four SFDI measurements were taken during the bilateral transverse rectus abdominus myocutaneous procedure. These time points included images after preparation of each abdominal skin flap (left and right abdominal skin flap), and images of the right flap after elevation (postflap elevation), and surgical attachment (postflap transplant). Color images for each imaging step are shown in Fig. 7 (top row). Extracted maps of ctO2Hb, ctHHb, and tissue saturation are shown in Fig. 7 (2nd row, 3rd row, and bottom row, respectively). The SFDI maps show a 15% difference in ctO2Hb in the right flap compared to the left flap. There is also a 40% loss in ctO2Hb, and 12% loss in StO2 between preparation and attachment of the flap. Increased patient enrollment and a longitudinal study design is needed to better understand the potential of these measurements in relation to flap selection and flap viability. Fig. 7First-in-human pilot study of SFDI in women undergoing breast reconstruction after mastectomy: Columns, from left to right, include: abdominal skin flaps after preparation (left and right sides), right skin flap after elevation, and right skin flap after attachment (transplantation). The first row presents a color image of the flap, the second row the concentration of oxyhemoglobin (ctO2Hb), the third row the concentration of deoxyhemoglobin (ctHHb), and the fourth row the oxygen saturation images (stO2).  4.DiscussionA major feature of this new SFDI system is the ability to provide oxygenation images without a priori knowledge of the location of an ischemic region. Currently available local contact probes do not offer this advantage. Oxygenation “imaging,” as opposed to point probe measurements, provides oxygenation variations to the physician over large FOVs. Variation of oxygen saturation over the tissue surface, and the different depths interrogated by each instrument, also help explain the observed difference between the absolute saturation values obtained from the contact probe and SFDI. Additional experiments are necessary to fully understand the discrepancies between absolute oxygen saturation, the SFDI results, and the contact probe. Another advantage of oxygenation imaging is that it does not require contact with the patient, yet still provides quantitative measurement over irregularly shaped tissues and organs, such as skin, liver, and bowel. In addition, contact probes require long stabilization times (>1 s) for accurate readings, whereas the SFDI system is limited only by fluence rate and camera sensitivity. Although not presented in this study, true real-time measurements (i.e., acquisition, processing, and visualization) will someday be a major advantage of SFDI systems. Interestingly, both contact probes and SFDI were found to be influenced significantly by operating room overhead lighting, which interferes with optical measurements. We overcame this problem in the SFDI system by providing NIR-depleted white light to the surgeon and turning off overhead lights. Although the SFDI system we describe can extract physiologically relevant information on tissue status and display it to the surgeon, our study has several important limitations. A clinical imaging system that impacts patient care must be integrated efficiently into the clinical workflow and must be capable of acquiring and displaying information in real time at a rate greater than 1 frame per second. In our SFDI system, the two steps that can be improved to achieve this goal are acquisition and processing. Recently, it was demonstrated that reliable imaging of oxygenation (within 10%) was possible by using only one wavelength pair consisting of 670 and 860 nm.50 Data acquisition could then be performed in <540 ms using this combination. Data processing for SFDI is currently performed after surgery using MATLAB. Integration of acquisition and processing algorithms into a single software platform would provide visualization of oxygenation maps to the surgeon at a frame rate faster than one image/s.32, 46 Another limitation of our study, also present in standard pulse oximetry, consists of extracting ctO2Hb and ctHHb concentrations without accounting for all chromophores encountered in living tissues, such as methemoglobin. This can introduce error in the SFDI calculation of oxygen saturation and will be the focus of future work. Profile correction is another essential component for in vivo non-contact quantitative imaging, but can suffer from robustness and noise. Various methods have been described,59, 60, 61, 62 but few can be used in clinical settings to correct for light transport.47, 63, 64 The current profilometry implementation used with SFDI suffers from noise during phase extraction due to the relatively low spatial frequency used to accommodate large height variations. Novel surface profilometry methods based on the projection of multiple spatial frequencies could improve the acquisition of surface profiles showing large height variation, while maintaining fine height resolution.65 The multispectral laser source we introduce in this study is based on the use of several laser diodes combined through a multilegged fiber bundle. This strategy appears optimal for remote lighting applications requiring many wavelengths at high power. In particular, only one light bundle is needed between the light source and the illumination unit, offering an advantage in terms of electrical safety because the imaging head is located above the patient. However, this solution suffers from the long coherence of laser sources resulting in speckle patterns in the illumination. While the presence speckle does not influence SFDI processing, it can cause visual discomfort. Our system employed multimode laser diodes and multimode fibers to minimize speckle effects, but other potential solutions to reduce the influence of speckle include a rotating diffuser at the source, motors that vibrate the fiber at high rates to “blur” the speckle, or spatial data smoothing during postprocessing. 5.ConclusionWe designed a novel oxygenation imaging device based on SFDI and multispectral principles. This system is capable of determining profile-corrected optical properties at six different wavelengths optimized for rapid chromophore imaging within a realistic surgical environment. This system has been validated under various vascular occlusion and release cases on Yorkshire pigs and provided results within 10% of a FDA-approved spectroscopic local probe, the current standard-of-care for intraoperative oxygenation measurement. Finally, the system has been translated to the clinic and used in a first-in-human pilot study for breast reconstruction after a mastectomy where skin flap oxygenation was assessed intraoperatively. This study lays the foundation for providing surgeons with new tools allowing for real-time oxygenation images to be displayed during surgery. AcknowledgmentsThe authors thank Valerie Croft, Midge Garrison, and Eugenia Trabucchi for administrative assistance and Lindsey Gendall for editing. The authors thank the following individuals for their contributions to this project: from Modulated Imaging Inc., Steve Saggese and Frederic Ayers; from Chroma, Kelly Stockwell; from Ceramoptec, Cheryl Kelley; from Design and Assembly Concepts, Clay Sakewitz; from LAE Technologies, Colin Johnson; from OZoptics, Saidou Kane and Ralph Swafford; from RPMC, Al Anthony; from Cosel, Doug Burns. This study was funded by National Institutes of Health/NCI Grant Nos. R21-CA-129758 and R01-CA-115296. Additional support has been provided by the National Institutes of Health/NCRR under Grant No. P41-RR01192 (Laser Microbeam and Medical Program: LAMMP), U.S. Air Force Office of Scientific Research, Medical Free-Electron Laser Program (Grant Nos. F49620-00-2-0371 and FA9550-04-1-0101), and the Beckman Foundation. All FLARETM technology is owned by Beth Israel Deaconess Medical Center, a teaching hospital of Harvard Medical School. As inventor, Dr. Frangioni may someday receive royalties if products are commercialized. Dr. Frangioni is the founder and unpaid director of The FLARE Foundation, a non-profit organization focused on promoting the dissemination of medical imaging technology for research and clinical use. ReferencesY. Mendelson,
“Pulse oximetry: theory and applications for noninvasive monitoring,”
Clin. Chem, 38 1601
–1607
(1992). Google Scholar
J. W. Severinghaus,
“History and recent developments in pulse oximetry,”
Scand. J. Clin. Lab. Invest., 53 105
–111
(1993). https://doi.org/10.3109/00365519309090686 Google Scholar
P. M. Middleton and
J. A. Henry,
“Pulse oximetry: evolution and directions,”
Int. J. Clin. Pract., 54 438
–444
(2000). Google Scholar
R. Rao, M. Saint-Cyr, A. M. Ma, M. Bowling, D. A. Hatef, V. Andrews, X. J. Xie, T. Zogakis, and
R. Rohrich,
“Prediction of post-operative necrosis after mastectomy: a pilot study utilizing optical diffusion imaging spectroscopy,”
World J. Surg. Oncol., 7 91
(2009). https://doi.org/10.1186/1477-7819-7-91 Google Scholar
C. Gelinas, M. Choiniere, M. Ranger, A. Denault, A. Deschamps, and
C. Johnston,
“Toward a new approach for the detection of pain in adult patients undergoing cardiac surgery: near-infrared spectroscopy–a pilot study,”
Heart Lung, 39 485
–493
(2010). https://doi.org/10.1016/j.hrtlng.2009.10.018 Google Scholar
E. S. Lee, W. C. Pevec, D. P. Link, and
D. L. Dawson,
“Use of T-Stat to predict colonic ischemia during and after endovascular aneurysm repair: a case report,”
J. Vasc. Surg., 47 632
–634
(2008). https://doi.org/10.1016/j.jvs.2007.09.037 Google Scholar
E. A. Booth, C. Dukatz, J. Ausman, and
M. Wider,
“Cerebral and somatic venous oximetry in adults and infants,”
Surg. Neurol. Int., 1 75
(2010). https://doi.org/10.4103/2152-7806.73316 Google Scholar
T. M. Hemmerling, M. C. Bluteau, R. Kazan, and
D. Bracco,
“Significant decrease of cerebral oxygen saturation during single-lung ventilation measured using absolute oximetry,”
Br. J. Anaesth., 101 870
–875
(2008). https://doi.org/10.1093/bja/aen275 Google Scholar
D. Myers, M. McGraw, M. George, K. Mulier, and
G. Beilman,
“Tissue hemoglobin index: a non-invasive optical measure of total tissue hemoglobin,”
Crit. Care, 13 Suppl 5 S2
(2009). https://doi.org/10.1186/cc8000 Google Scholar
B. Chance,
“Spectrophotometry of intracellular respiratory pigments,”
Science, 120 767
–775
(1954). https://doi.org/10.1126/science.120.3124.767 Google Scholar
F. Jobsis,
“Noninvasive, infrared monitoring of cerebral and myocardial oxygen sufficiency and circulatory parameters,”
Science, 198 1264
–1267
(1977). https://doi.org/10.1126/science.929199 Google Scholar
D. T. Delpy and
M. Cope,
“Quantification in tissue near-infrared spectroscopy,”
Philos. Trans. R. Soc. London, Ser. B, 352 649
–659
(1997). https://doi.org/10.1098/rstb.1997.0046 Google Scholar
A. E. Cerussi, A. J. Berger, F. Bevilacqua, N. Shah, D. Jakubowski, J. Butler, R. F. Holcombe, and
B. J. Tromberg,
“Sources of absorption and scattering contrast for near-infrared optical mammography,”
Acad. Radiol., 8 211
–218
(2001). https://doi.org/10.1016/S1076-6332(03)80529-9 Google Scholar
G. Zonios, J. Bykowski, and
N. Kollias,
“Skin melanin, hemoglobin, and light scattering properties can be quantitatively assessed in vivo using diffuse reflectance spectroscopy,”
J. Invest. Dermatol., 117 1452
–1457
(2001). https://doi.org/10.1046/j.0022-202x.2001.01577.x Google Scholar
J. E. Bender, A. B. Shang, E. W. Moretti, B. Yu, L. M. Richards, and
N. Ramanujam,
“Noninvasive monitoring of tissue hemoglobin using UV-VIS diffuse reflectance spectroscopy: a pilot study,”
Opt. Express, 17 23396
–23409
(2009). https://doi.org/10.1364/OE.17.023396 Google Scholar
G. M. Palmer, R. J. Viola, T. Schroeder, P. S. Yarmolenko, M. W. Dewhirst, and
N. Ramanujam,
“Quantitative diffuse reflectance and fluorescence spectroscopy: tool to monitor tumor physiology in vivo,”
J. Biomed. Opt., 14 024010
(2009). https://doi.org/10.1117/1.3103586 Google Scholar
M. Attas, M. Hewko, J. Payette, T. Posthumus, M. Sowa, and
H. Mantsch,
“Visualization of cutaneous hemoglobin oxygenation and skin hydration using near-infrared spectroscopic imaging,”
Skin Res. Technol., 7 238
–245
(2001). https://doi.org/10.1034/j.1600-0846.2001.70406.x Google Scholar
K. J. Zuzak, M. D. Schaeberle, E. N. Lewis, and
I. W. Levin,
“Visible reflectance hyperspectral imaging: characterization of a noninvasive, in vivo system for determining tissue perfusion,”
Anal. Chem., 74 2021
–2028
(2002). https://doi.org/10.1021/ac011275f Google Scholar
L. Khaodhiar, T. Dinh, K. T. Schomacker, S. V. Panasyuk, J. E. Freeman, R. Lew, T. Vo, A. A. Panasyuk, C. Lima, J. M. Giurini, T. E. Lyons, and
A. Veves,
“The use of medical hyperspectral technology to evaluate microcirculatory changes in diabetic foot ulcers and to predict clinical outcomes,”
Diabetes Care, 30 903
–910
(2007). https://doi.org/10.2337/dc06-2209 Google Scholar
A. Vogel, V. V. Chernomordik, J. D. Riley, M. Hassan, F. Amyot, B. Dasgeb, S. G. Demos, R. Pursley, R. F. Little, R. Yarchoan, Y. Tao, and
A. H. Gandjbakhche,
“Using noninvasive multispectral imaging to quantitatively assess tissue vasculature,”
J. Biomed. Opt., 12 051604
(2007). https://doi.org/10.1117/1.2801718 Google Scholar
J. Y. Lo, B. Yu, H. L. Fu, J. E. Bender, G. M. Palmer, T. F. Kuech, and
N. Ramanujam,
“A strategy for quantitative spectral imaging of tissue absorption and scattering using light emitting diodes and photodiodes,”
Opt. Express, 17 1372
–1384
(2009). https://doi.org/10.1364/OE.17.001372 Google Scholar
L. L. Randeberg, E. L. Larsen, and
L. O. Svaasand,
“Characterization of vascular structures and skin bruises using hyperspectral imaging, image analysis and diffusion theory,”
J Biophotonics, 3 53
–65
(2010). https://doi.org/10.1002/jbio.200910059 Google Scholar
D. Roblyer, C. Kurachi, V. Stepanek, R. A. Schwarz, M. D. Williams, A. K. El-Naggar, J. J. Lee, A. M. Gillenwater, and
R. Richards-Kortum,
“Comparison of multispectral wide-field optical imaging modalities to maximize image contrast for objective discrimination of oral neoplasia,”
J. Biomed. Opt., 15 066017
(2010). https://doi.org/10.1117/1.3516593 Google Scholar
T. J. Farrell, M. S. Patterson, and
B. Wilson,
“A diffusion theory model of spatially resolved, steady-state diffuse reflectance for the noninvasive determination of tissue optical properties in vivo,”
Med. Phys., 19 879
–888
(1992). https://doi.org/10.1118/1.596777 Google Scholar
A. Kienle, L. Lilge, M. S. Patterson, R. Hibst, R. Steiner, and
B. C. Wilson,
“Spatially resolved absolute diffuse reflectance measurements for noninvasive determination of the optical scattering and absorption coefficients of biological tissue,”
Appl. Opt., 35 2304
–2314
(1996). https://doi.org/10.1364/AO.35.002304 Google Scholar
R. M. Doornbos, R. Lang, M. C. Aalders, F. W. Cross, and
H. J. Sterenborg,
“The determination of in vivo human tissue optical properties and absolute chromophore concentrations using spatially resolved steady-state diffuse reflectance spectroscopy,”
Phys. Med. Biol., 44 967
–981
(1999). https://doi.org/10.1088/0031-9155/44/4/012 Google Scholar
C. Zhu, G. M. Palmer, T. M. Breslin, F. Xu, and
N. Ramanujam,
“Use of a multiseparation fiber optic probe for the optical diagnosis of breast cancer,”
J. Biomed. Opt., 10 024032
(2005). https://doi.org/10.1117/1.1897398 Google Scholar
M. S. Patterson, B. Chance, and
B. C. Wilson,
“Time resolved reflectance and transmittance for the non-invasive measurement of tissue optical properties,”
Appl. Opt., 28 2331
–2336
(1989). https://doi.org/10.1364/AO.28.002331 Google Scholar
M. S. Patterson, J. D. Moulton, B. C. Wilson, K. W. Berndt, and
J. R. Lakowicz,
“Frequency-domain reflectance for the determination of the scattering and absorption properties of tissue,”
Appl. Opt., 30 4474
–4476
(1991). https://doi.org/10.1364/AO.30.004474 Google Scholar
A. E. Cerussi, V. W. Tanamai, R. S. Mehta, D. Hsiang, J. Butler, and
B. J. Tromberg,
“Frequent optical imaging during breast cancer neoadjuvant chemotherapy reveals dynamic tumor physiology in an individual patient,”
Acad. Radiol., 17 1031
–1039
(2010). https://doi.org/10.1016/j.acra.2010.05.002 Google Scholar
N. Dognitz and
G. Wagnieres,
“Determination of tissue optical properties by steady-state spatial frequency-domain reflectometry,”
Lasers Med. Sci., 13 55
–65
(1998). https://doi.org/10.1007/BF00592960 Google Scholar
D. J. Cuccia, F. Bevilacqua, A. J. Durkin, F. R. Ayers, and
B. J. Tromberg,
“Quantitation and mapping of tissue optical properties using modulated imaging,”
J. Biomed. Opt., 14 024012
(2009). https://doi.org/10.1117/1.3088140 Google Scholar
M. R. Pharaon, T. Scholz, S. Bogdanoff, D. Cuccia, A. J. Durkin, D. B. Hoyt, and
G. R. Evans,
“Early detection of complete vascular occlusion in a pedicle flap model using quantitation spectral imaging,”
Plast. Reconstr. Surg., 126 1924
–1935
(2010). https://doi.org/10.1097/PRS.0b013e3181f447ac Google Scholar
A. Yafi, T. S. Vetter, T. Scholz, S. Patel, R. B. Saager, D. J. Cuccia, G. R. Evans, and
A. J. Durkin,
“Postoperative quantitative assessment of reconstructive tissue status in a cutaneous flap model using spatial frequency domain imaging,”
Plast. Reconstr. Surg., 127 117
–130
(2011). https://doi.org/10.1097/PRS.0b013e3181f959cc Google Scholar
D. J. Cuccia, F. Bevilacqua, A. J. Durkin, and
B. J. Tromberg,
“Modulated imaging: quantitative analysis and tomography of turbid media in the spatial-frequency domain,”
Opt. Lett., 30 1354
–1356
(2005). https://doi.org/10.1364/OL.30.001354 Google Scholar
A. Bassi, C. D’Andrea, G. Valentini, R. Cubeddu, and
S. Arridge,
“Detection of inhomogeneities in diffusive media using spatially modulated light,”
Opt. Lett., 34 2156
–2158
(2009). https://doi.org/10.1364/OL.34.002156 Google Scholar
J. Weber, D. J. D. Cuccia, and
B. J. Tromberg,
“Noncontact imaging of absorption and scattering in layered tissue using spatially modulated structured light,”
J. Appl. Phys., 105 102028
(2009). https://doi.org/10.1063/1.3116135 Google Scholar
A. Mazhar, D. J. Cuccia, S. Gioux, A. J. Durkin, J. V. Frangioni, and
B. J. Tromberg,
“Structured illumination enhances resolution and contrast in thick tissue fluorescence imaging,”
J. Biomed. Opt., 15 010506
(2010). https://doi.org/10.1117/1.3299321 Google Scholar
N. Ducros, C. D’Andrea, G. Valentini, T. Rudge, S. Arridge, and
A. Bassi,
“Full-wavelet approach for fluorescence diffuse optical tomography with structured illumination,”
Opt. Lett., 35 3676
–3678
(2010). https://doi.org/10.1364/OL.35.003676 Google Scholar
D. Abookasis, C. C. Lay, M. S. Mathews, M. E. Linskey, R. D. Frostig, and
B. J. Tromberg,
“Imaging cortical absorption, scattering, and hemodynamic response during ischemic stroke using spatially modulated near-infrared illumination,”
J. Biomed. Opt., 14 024033
(2009). https://doi.org/10.1117/1.3116709 Google Scholar
F. R. Ayers, D. J. Cuccia, K. M. Kelly, and
A. J. Durkin,
“Wide-field spatial mapping of in vivo tattoo skin optical properties using modulated imaging,”
Lasers Surg. Med., 41 442
–453
(2009). https://doi.org/10.1002/lsm.20782 Google Scholar
S. D. Konecky, A. Mazhar, D. Cuccia, A. J. Durkin, J. C. Schotland, and
B. J. Tromberg,
“Quantitative optical tomography of sub-surface heterogeneities using spatially modulated structured light,”
Opt. Express, 17 14780
–14790
(2009). https://doi.org/10.1364/OE.17.014780 Google Scholar
V. Lukic, V. A. Markel, and
J. C. Schotland,
“Optical tomography with structured illumination,”
Opt. Lett., 34 983
–985
(2009). https://doi.org/10.1364/OL.34.000983 Google Scholar
S. Belanger, M. Abran, X. Intes, C. Casanova, and
F. D. R. Lesage,
“Real-time diffuse optical tomography based on structured illumination,”
J. Biomed. Opt., 15 016006
(2010). https://doi.org/10.1117/1.3290818 Google Scholar
C. D’Andrea, N. Ducros, A. Bassi, S. Arridge, and
G. Valentini,
“Fast 3D optical reconstruction in turbid media using spatially modulated light,”
Biomed. Opt. Express, 1 471
–481
(2010). https://doi.org/10.1364/BOE.1.000471 Google Scholar
T. A. Erickson, A. Mazhar, D. Cuccia, A. J. Durkin, and
J. W. Tunnell,
“Lookup-table method for imaging optical properties with structured illumination beyond the diffusion theory regime,”
J. Biomed. Opt., 15 036013
(2010). https://doi.org/10.1117/1.3431728 Google Scholar
S. Gioux, A. Mazhar, D. J. Cuccia, A. J. Durkin, B. J. Tromberg, and
J. V. Frangioni,
“Three-dimensional surface profile intensity correction for spatially modulated imaging,”
J. Biomed. Opt., 14 034045
(2009). https://doi.org/10.1117/1.3156840 Google Scholar
A. Corlu, T. Durduran, R. Choe, M. Schweiger, E. M. C. Hillman, S. R. Arridge, and
A. G. Yodh,
“Uniqueness and wavelength optimization in continuous-wave multispectral diffuse optical tomography,”
Opt. Lett., 28 2339
–2341
(2003). https://doi.org/10.1364/OL.28.002339 Google Scholar
M. E. Eames, J. Wang, B. W. Pogue, and
H. Dehghani,
“Wavelength band optimization in spectral near-infrared optical tomography improves accuracy while reducing data acquisition and computational burden,”
J. Biomed. Opt., 13 054037
(2008). https://doi.org/10.1117/1.2976425 Google Scholar
A. Mazhar, S. Dell, D. J. Cuccia, S. Gioux, A. J. Durkin, J. V. Frangioni, and
B. J. Tromberg,
“Wavelength optimization for rapid chromophore mapping using spatial frequency domain imaging,”
J. Biomed. Opt., 15 061716
(2010). https://doi.org/10.1117/1.3523373 Google Scholar
S. L. Troyan, V. Kianzad, S. L. Gibbs-Strauss, S. Gioux, A. Matsui, R. Oketokoun, L. Ngo, A. Khamene, F. Azar, and
J. V. Frangioni,
“The FLARE intraoperative near-infrared fluorescence imaging system: a first-in-human clinical trial in breast cancer sentinel lymph node mapping,”
Ann. Surg. Oncol., 16 2943
–2952
(2009). https://doi.org/10.1245/s10434-009-0594-2 Google Scholar
B. T. Lee, M. Hutteman, S. Gioux, A. Stockdale, S. J. Lin, L. H. Ngo, and
J. V. Frangioni,
“The FLARE intraoperative near-infrared fluorescence imaging system: a first-in-human clinical trial in perforator flap breast reconstruction,”
Plast. Reconstr. Surg., 126 1472
–1481
(2010). https://doi.org/10.1097/PRS.0b013e3181f059c7 Google Scholar
S. Gioux, H. S. Choi, and
J. V. Frangioni,
“Image-guided surgery using invisible near-infrared light: fundamentals of clinical translation,”
Mol. Imaging, 9 237
–255
(2010). https://doi.org/10.1117/1.3368997 Google Scholar
S. Gioux, V. Kianzad, R. Ciocan, S. Gupta, R. Oketokoun, and
J. V. Frangioni,
“High-power, computer-controlled, light-emitting diode-based light sources for fluorescence imaging and image-guided surgery,”
Mol. Imaging, 8 156
–165
(2009). Google Scholar
V. Srinivasan, H. C. Liu, and
M. Halioua,
“Automated phase-measuring profilometry of 3-D diffuse objects,”
Appl. Opt., 23 3105
–3108
(1984). https://doi.org/10.1364/AO.23.003105 Google Scholar
W. Zhou and
X. Su,
“A direct mapping algorithm for phase-measuring profilometry,”
J. Mod. Opt., 41 89
–94
(1994). https://doi.org/10.1080/09500349414550101 Google Scholar
A. Keller,
“Noninvasive tissue oximetry for flap monitoring: an initial study,”
J. Reconstr Microsurg, 23 189
–197
(2007). https://doi.org/10.1055/s-2007-974655 Google Scholar
A. Keller,
“A new diagnostic algorithm for early prediction of vascular compromise in 208 microsurgical flaps using tissue oxygen saturation measurements,”
Ann. Plast. Surg., 62 538
–543
(2009). https://doi.org/10.1097/SAP.0b013e3181a47ce8 Google Scholar
D. Yelin, W. M. White, J. T. Motz, S. H. Yun, B. E. Bouma, and
G. J. Tearney,
“Spectral-domain spectrally-encoded endoscopy,”
Opt. Express, 15 2432
–2444
(2007). https://doi.org/10.1364/OE.15.002432 Google Scholar
M. Westhauser, G. Bischoff, Z. Borocz, J. Kleinheinz, G. von Bally, and
D. Dirksen,
“Optimizing color reproduction of a topometric measurement system for medical applications,”
Med. Eng. Phys., 30 1065
–1070
(2008). https://doi.org/10.1016/j.medengphy.2007.12.014 Google Scholar
R. B. Schulz, J. Ripoll, and
V. Ntziachristos,
“Noncontact optical tomography of turbid media,”
Opt. Lett., 28 1701
–1703
(2003). https://doi.org/10.1364/OL.28.001701 Google Scholar
H. Meyer, A. Garofalakis, G. Zacharakis, S. Psycharakis, C. Mamalaki, D. Kioussis, E. N. Economou, V. Ntziachristos, and
J. Ripoll,
“Noncontact optical imaging in mice with full angular coverage and automatic surface extraction,”
Appl. Opt., 46 3617
–3627
(2007). https://doi.org/10.1364/AO.46.003617 Google Scholar
V. C. Paquit, F. Meriaudeau, J. R. Price, and
K. W. Tobin,
“Simulation of skin reflectance images using 3D tissue modeling and multispectral Monte Carlo light propagation,”
447
–450
(2008). Google Scholar
J. M. Kainerstorfer, F. Amyot, M. Ehler, M. Hassan, S. G. Demos, V. Chernomordik, C. K. Hitzenberger, A. H. Gandjbakhche, and
J. D. Riley,
“Direct curvature correction for noncontact imaging modalities applied to multispectral imaging,”
J. Biomed. Opt., 15 046013
(2010). https://doi.org/10.1117/1.3470094 Google Scholar
J. Salvi, S. Fernandez, T. Pribanic, and
X. Llado,
“A state of the art in structured light patterns for surface profilometry,”
Pattern Recogn., 43 2666
–2680
(2010). https://doi.org/10.1016/j.patcog.2010.03.004 Google Scholar
|