
|
|
1.IntroductionZinc plays important catalytic, structural, and regulatory roles in a wide range of fundamental cellular processes. More than 300 metalloenzymes require zinc as a catalytic cofactor or a structural element.1, 2 Various zinc binding motifs mediate the interactions of proteins with other proteins, nucleic acids, lipids, and small molecules, and these interactions play key roles in diverse biological processes.3, 4 Although zinc is an essential nutrient, excess zinc is cytotoxic, at least partly due to the inhibition of key enzymes and competition with essential copper ions.5 Zinc concentration is controlled within cells by multiple mechanisms, including zinc transporters and binding proteins.6, 7, 8 Total zinc concentrations in cells have been measured at 100 to 500 μM by atomic absorption spectroscopy or inductively coupled plasma mass spectrometry (ICP-MS) in various types of cells.6 The majority of zinc binds to intracellular ligands with affinities ranging from femtomolars to micromolars. “Free zinc,” or “readily exchangeable zinc,” refers to the portion of physiological zinc that is coordinated to very weak ligands, such as water and chloride. The free zinc is buffered by equilibration with a pool of physiological zinc that is coordinated to proteins, nucleic acids, and small molecules [Eq. 1], and/or by transport of extracellular zinc. The free zinc concentration, Eq. 1[TeX:] \documentclass[12pt]{minimal}\begin{document}\begin{equation} K_{{\rm Zn}} = \frac{{[{\rm Zn}^{2 + }]_{{\rm free}} [L_1 + L_2 + L_3 +......]}}{{[{\rm Zn} \cdot L_1 + {\rm Zn} \cdot L_2 + {\rm Zn} \cdot L_3 +......]}}, \end{equation}\end{document}A portfolio of zinc sensors has been developed over the past 20 years, the majority of which are small molecule fluorescent indicators. While these sensors are valuable tools for monitoring changes in free zinc concentrations above the nanomolar range, and have greatly facilitated the understanding of the roles of zinc in neurobiology,16, 17 few of the small molecule sensors are capable of imaging and quantifying the low intracellular free zinc concentration in resting cells, primarily due to low binding affinities and/or a nonratiometric response. Zinc sensors that are based on metalloproteins have also been developed and applied to various mammalian cell lines.13, 18, 19, 20 These sensors bear the advantages of high affinity and selectivity, as well as the versatility for molecular engineering. Genetically encoded sensors have additional advantages that they can be expressed in cells and targeted to subcellular organelles to study zinc compartmentalization. However, several of these protein-based sensors use cysteine as a zinc ligand and have the potential drawback of being sensitive to oxidation. We have been developing zinc sensors to quantify the concentration of readily exchangeable zinc using human carbonic anhydrase II (CAII) as the sensor scaffold.21 Wild type CAII binds zinc with high affinity (K D Zn ∼1 pM at pH 7) and selectivity; zinc binding is not affected by the micromolar concentrations of Fe2+ that are normally present in the cell, or millimolar concentrations of Ca2+ or Mg2+.22 The metal binding affinity and kinetics of various mutants has been extensively studied, generating a series of CAII variants with zinc affinities ranging from femtomolars to micromolars.23 In this sensor, zinc binding is coupled to the binding of fluorescent aryl sulfonamide inhibitors to produce a zinc-dependent fluorescence signal. These inhibitors selectively bind to zinc-bound CAII and exhibit a large increase in quantum yield and a blueshift in the emission spectra, for example, dapoxyl sulfonamide (DPS) undergoes a >100-fold increase in quantum yield upon binding to holo-carbonic anhydrase (CA).24 A Förster resonance energy transfer (FRET)-based ratiometric zinc sensing scheme has previously been developed by covalently labeling CAII with a second fluorophore (AlexaFluor 594) that functions as a FRET acceptor to CA-bound DPS.25 This sensor was delivered into PC-12 cells using a cell permeating peptide tag to measure the intracellular free zinc concentration in this mammalian cell line.12 In this work, we developed genetically encoded ratiometric zinc sensors based on carbonic anhydrase-red fluorescent protein fusions, and applied these sensors to monitoring intracellular readily exchangeable zinc in the prokaryotic model organism E. coli. These measurements are the first experimental tests of the zinc level proposed from in vitro measurements of zinc-sensing transcription factors.9 To this end, we established conditions for carrying out in situ calibrations of the sensor in gram-negative bacteria and demonstrated that the intracellular readily exchangeable zinc concentration is in the range of tens of picomolars when cells are growing in minimal media. Furthermore, dramatic, transient increases in the intracellular concentration are observed in response to alterations in the extracellular zinc concentration (“zinc shock”). These novel sensors are an important new tool for analyzing prokaryotic metal homeostasis and regulation, allowing the study of the response of the intracellular free zinc concentration to environmental conditions, mutations, and antibiotics. This information is particularly important for emerging antimicrobial drug discovery efforts targeting metal metabolism. 2.Results and Discussion2.1.Construction of CA_Red Fluorescent Protein Zinc SensorsTo develop a genetically encoded ratiometric zinc sensor, we fused a fluorescent protein (FP) to the C-terminus of CAII, replacing the chemical fluorophore covalently attached to CAII in the previously described sensor.12 The fluorescent protein serves as both a FRET acceptor and as an intrinsic marker to track the location and concentration of the sensor. The CAII_FP zinc sensor is an excitation ratiometric sensor where fluorescence emission due to FRET between the donor (CAII-bound dapoxyl sulfonamide) and the acceptor (FP) (I FRET) reflects the concentration of zinc-bound carbonic anhydrase, while the fluorescence emission from excitation of the FP (I FP) represents the total concentration of the sensor (Fig. 1). The I FRET/I FP ratio reflects the zinc-bound fraction of carbonic anhydrase. The concentration of readily exchangeable zinc is then determined from a calibration curve of the fluorescence intensity ratio I FRET/I FP at various concentrations of zinc measured under equilibrium conditions, as described in detail later. Fig. 1Schematic illustration of CA-based ratiometric zinc sensor. (a) The active site of human carbonic anhydrase II (PDB ID: 2CBA). (b) An RFP (shown as a barrel) is fused to CA (shown as the semicircle). An aryl sulfonamide inhibitor of carbonic anhydrase, DPS (shown in stick stucture) selectively binds to holo-CA through coordination of the active site zinc (shown as a sphere). CA-bound DPS emits strongly at 530 nm and acts as a FRET donor to RFP in this case. The UV-excited FRET signal is normalized to the emission from the directly excited RFP only (FP channel, not shown). Free zinc concentration is proportional to the ratio of FRET emission to directly excited RFP emission and can be read from a suitable calibration curve (see Fig. 3) under equilibrium conditions. 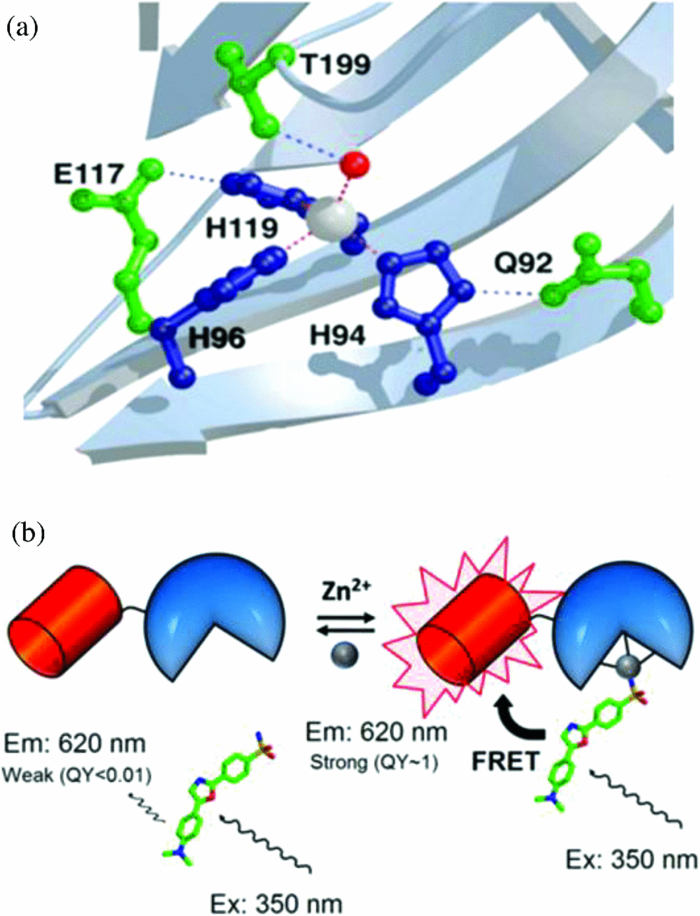 Fig. 3In vitro calibration curves of CA_RFP sensors. 1 μM apo-CA_RFP sensor was pre-equilibrated with NTA-chelated zinc buffers (pH 7.0) and 2 μM DPS, and then the excitation fluorescence intensity ratio was measured with filter sets detailed in Table 2 using 96-well plates on a Nikon TE2000U inverted fluorescence microscope. (a) in vitro calibration curves of CA_DsRed2 (filled circle), CA_mCherry (filled square), and CA_TagRFP (filled diamond). The calibration curve of CA_TagRFP with a Gly3 linker is similar to that of CA_TagRFP with a single Gly linker, but with a slightly higher [TeX:] $K_D^{Zn}$ (Table 1). (b) Examples of in vitro calibration curves of CA_TagRFP sensors with mutations in CA, including T199A (open circle) and H94N (open triangle) CAII. The in vitro [TeX:] $K_{D,{\rm app}}^{Zn}$ values for all of the sensors are listed in Table 1.  Fig. 9Intracellular free zinc concentration changes in response to extracellular free zinc concentration. E coli live cell imaging samples expressing H94N CA_TagRFP were prepared, as described in Sec. 4. At time zero, 5 μl of 50 μM ZnSO4 was added to the imaging medium to a final total zinc concentration of 2.5 μM (squares). 5 μl of MOPS medium was added to the control well (no zinc; diamonds). Live cell images were then acquired at various time points. Parallel samples were imaged to avoid excessive photobleaching. A transient increase in intracellular free zinc concentration up to 40 nm was observed after addition of 2.5 μM ZnSO4.  Table 1Zinc dissociation constants for CAII and CA_RFP sensor variants.
Table 2Comparison of the red fluorescent proteins used in constructing CA-based zinc sensors (Refs. 35 and 39).
The first step in developing a genetically encoded CAII_FP sensor is to determine which fluorescent protein to fuse to CAII. The following criteria were particularly important: 1. good spectral overlap with CA-bound DPS (Em = 530 nm), which limits the choice to orange-red fluorescent proteins (RFPs); 2. a high extinction coefficient and quantum yield to allow for detection at low concentrations; and 3. a fast maturation under the experimental conditions. After testing several red fluorescent proteins fused to the C-terminus of CAII, including DsRed2, mRFP, mOrange, mCherry, and TagRFP,26, 27, 28 we chose TagRFP as the FP with the best balanced set of properties for our experiments. TagRFP is a bright, monomeric protein that matures faster than DsRed2 (Ref. 28) and has better FRET efficiency than mCherry (Fig. 2). As shown in the FRET spectra of CA_DsRed2, CA_TagRFP, and CA_mCherry in the presence of DPS (Fig. 2), all three sensors respond readily to increases in free zinc concentrations with an enhanced FRET signal. Fig. 2FRET emission spectra of CA_RFPs under various zinc concentrations: (a) CA_DsRed2; (b) CA_TagRFP; (c) CA_mCherry. 1 μM of apo-CA_RFP was incubated with NTA-chelated zinc buffers at various free zinc concentrations ([Zn]free from 0.002 pM to 5 nm). 2 μM DPS was added to the solution and emission scans were taken using an excitation wavelength of 350 nm. Emission peaks for CA-bound DPS and the fused DsRed2, TagRFP, and mCherry are 530, 587, 584, and 610 nm, respectively. 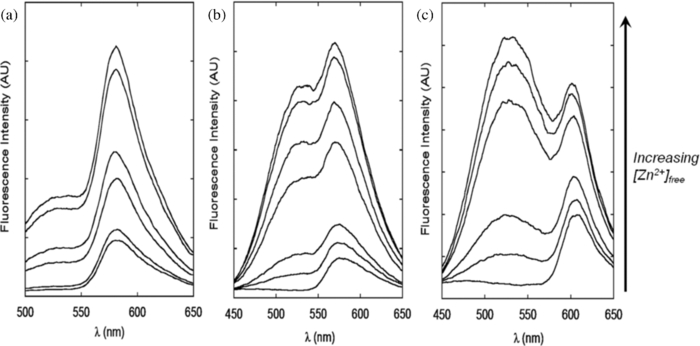 To cover a wider dynamic range of zinc concentrations and select the sensor with the appropriate affinity, a series of four CA_TagRFP variants containing mutations in CAII (E117A, Q92A, T199A, or H94N) that were previously shown to alter the zinc binding affinity and/or kinetics,29, 30 were individually engineered. We also prepared a CA_TagRFP variant where the single glycine residue linking the CAII and TagRFP proteins was replaced with three glycine residues to test whether altering the linker length could tune the apparent affinity and/or spectral properties. 2.2.In Vitro Calibration of CA_RFP SensorsThe apparent zinc affinities of the engineered CA_RFP sensors were measured in vitro by equilibration with nitrilotriacetate (NTA)-buffered zinc solutions to maintain an exchangeable zinc pool with known free zinc concentrations.31 After equilibration of apo-CA_RFP with the zinc buffers, dapoxyl sulfonamide was added and the ratio of the emission intensity measured at 620 nm after excitation at either 530 nm (I FP, FP channel, 575 nm for mCherry) or 350 nm (I FRET, FRET channel) was calculated. The fluorescence intensity ratio (I FRET/I FP) has a hyperbolic dependence on the zinc concentration (Fig. 3) which is well-described by a single binding isotherm [Eq. 2] where R = I FRET/I FP, R min is determined in the absence of zinc, and R max is measured at saturating free zinc concentrations Eq. 2[TeX:] \documentclass[12pt]{minimal}\begin{document}\begin{equation} R = R_{\min } + \frac{{(R_{\max } - R_{\min }) \times [{\rm Zn}]_{{\rm free}} }}{{[{\rm Zn}]_{{\rm free}} + K_{D,{\rm app}}^{\rm Zn} }}.\end{equation}\end{document}The zinc-dependent increase in the I FRET/I FP ratio is 3.5- and 4.5-fold for wt CA_TagRFP and H94N CA_TagRFP, respectively. These responses are significantly larger than the 50% increase observed for the previously described CA_AF594 sensor25 due mainly to a reduction of fluorescence from direct excitation of the acceptor at 350 nm. The magnitude of the signal change observed for the CA_TagRFP sensor is also larger than the eCALWY zinc sensors (twofold change in signal),13 making it the most sensitive genetically-encoded zinc sensor with an affinity in the picomolar range. This improvement in the signal amplitude substantially enhances the sensitivity and accuracy of the measurement of zinc concentrations using CA-based fluorescent sensors. 2.3.Applying CA_RFP Zinc Sensors in E. coliAlthough the level of free zinc in E. coli has been estimated,9 the readily exchangeable zinc concentration has not yet been directly measured in this organism or any other prokaryote. Therefore, we chose to use our expressible sensors to measure zinc levels in E. coli BL21(DE3) using the controllable T7 expression system to optimize the sensor concentration and maturation. Since it is not yet known how the intracellular free zinc concentration varies with environmental factors and nutritional constraints, we used a chemically defined minimal medium to provide stringent control and reproducibility of these parameters.33 The total zinc concentration in this medium is ∼40 nm, measured by inductively coupled plasma emission mass spectroscopy (ICP-MS), and >90% of the zinc is not chelated by components of the medium, calculated using the MINEQL+ program (Environmental Research Software). One obstacle to using fluorescent protein-based sensors to measure analytes in E. coli is that the doubling time is comparable to or shorter than the half-time for maturation of the fluorescent proteins. In rich media, wild-type E. coli cells can divide as rapidly as every 30 min at 37 °C,34 while TagRFP and mCherry require 3 and 1.5 h, respectively, to achieve 90% maturation at 37 °C.27, 28 To tackle this issue, we developed an expression-dilution strategy. After growing BL21(DE3) cells containing a plasmid encoding the CA_FP sensor to mid-log phase in chemically defined medium, the expression of the sensor was induced by addition of isopropyl β-D-1-thiogalactopyranoside (IPTG), and the cells were incubated overnight at 30 °C to allow sufficient time for the red fluorescent protein to mature. The cells were then harvested, washed once with fresh medium, diluted into fresh medium without IPTG, and incubated at 30 °C for several doubling times before imaging. Under these conditions, little additional recombinant CA_FP is synthesized after dilution. However, the bacterial cells retain sufficient CA_FP sensor with mature red fluorescent protein to measure the readily exchangeable zinc concentrations. Allowing sufficient time for maturation of the fluorescent protein is an essential step since sensors containing immature red fluorescent protein have altered optical properties. This procedure also provides time for cells to adjust their zinc concentrations to accommodate the expressed zinc sensors. E. coli cells were imaged using a fluorescence microscope, as described in Sec. 4. We first carried out a number of control experiments to demonstrate that the I FRET/I FP ratio measures zinc-bound CA_FP with bound DPS. First, images of E. coli cells expressing the parent vector only (pET24a) in the presence of DPS exhibit minimal background fluorescence in the FRET channel [Fig. 4c], mainly caused by the long wavelength tail of membrane-bound DPS emission which peaks at 450 nm. This minor background fluorescence was averaged and subtracted from the FRET intensity measured in cells expressing the CA sensor. This background signal correction altered the ratio measurements by less than 5%. Second, we imaged E. coli cells expressing the CA_RFP sensor in the absence of DPS and observed significant fluorescence in the FP channel [Fig. 4e] with a low baseline in the FRET channel [Fig. 4f]. The I FRET/I FP ratio in cells expressing CA_TagRFP is 0.19 ± 0.03, which is comparable to the I FRET/I FP ratio observed in the in vitro calibration at very low zinc concentrations [0.18 ± 0.01; Fig. 2a]. A significant increase in the FRET channel emission was observed when DPS was added to cells expressing CA_TagRFP [Fig. 4i]. To verify that the signal increase was specifically caused by DPS binding to holo-CA, ethoxzolamide, a nonfluorescent inhibitor with a much higher affinity for holo-CA affinity (dissociation constant of 1.6 nm compared to 0.1 μM for DPS24, 35) was added to the DPS-treated cells. Upon addition of ethoxzolamide, the FRET channel emission decreased and the I FRET/I FP ratio returned to the baseline level (0.19 ± 0.03) [Fig. 4l], validating the specificity of the FRET signal to the DPS-bound CA_RFP sensor. To further examine the behavior of the CA_RFP expressible sensor in E. coli, the intracellular free zinc concentration was altered (Fig. 5). First, E. coli cells expressing the sensor were incubated with the transition metal-specific chelator N,N,N ′ ,N ′-tetrakis(2-pyridylmethyl)ethylenediamine (TPEN). The I FRET/I FP ratio decreased to the baseline level (0.19 ± 0.04) within 10 min after addition of 50 μM TPEN, indicating that the sensor rapidly re-equilibrates with the lower intracellular zinc concentration. In contrast, incubation with the membrane impermeable chelator ethylenediamine tetra-acetic acid (EDTA) did not alter the fluorescence ratio (I FRET/I FP ratio = 0.53 ± 0.06 after a 20 min incubation with 1 mM EDTA). Incubation of the E. coli cells expressing the sensor with the membrane permeabilizing compound digitonin14 and 100 μM ZnSO4 increases the I FRET/I FP ratio to ∼0.8, slightly higher than the ratio at the high end of the in vitro calibration curve of wt CA_TagRFP, suggesting that the sensor is saturated with zinc under this condition. The modest discrepancy in the endpoint values between the in vitro and in vivo experiments could be explained by either differential effects of the aqueous solution and intracellular environment on the fluorescent properties and FRET efficiencies, or the presence of a small amount of immature red fluorescent protein, which could lower the FP intensity relative to the FRET intensity, thus increasing the I FRET/I FP ratio. These data demonstrate that in E. coli, the CA_RFP sensor responds readily to changes in the cellular zinc concentration and is therefore suitable for monitoring dynamic processes in these cells. Fig. 4Fluorescence signal of the CA_TagRFP sensor in E. coli. Top row: Bright field images; middle row: FP channel: Ex 530/ Em 620, exposure time 200 ms; bottom row: FRET channel: Ex 350/Em 620, exposure time 500 ms; (a), (b), and (c) E. coli with a void pET24a vector plus DPS; (d), (e), and (f), E. coli expressing CA_TagRFP without added DPS; (g), (h), and (i) E. coli expressing CA_TagRFP with added 2 μM DPS. (f), (k), and (l) E. coli expressing CA_TagRFP plus 2 μM DPS and 30 μM ethoxzolamide, a ligand that competes with DPS for binding to the active site of carbonic anhydrase.  Fig. 5Fluorescence ratio changes with alterations of the intracellular zinc level. E. coli cells were grown in minimal media, as described in Sec. 4, and the cells imaged after a 10 min incubation in either: (a) minimal medium; (b) 50 μM TPEN, or (c) 30 μM Digitonin + 100 μM ZnSO4. The fluorescence in the FP and FRET channels were determined as described in the legend of Fig. 4. The I FRET/I FP ratio images are shown in RGB color and the average values are shown in the bar graph in panel (d).  2.4.In Situ Calibration of CA_RFP SensorsDifferences in the cellular milieu and optical properties could cause discrepancies in the I FRET/I FP ratio between the calibration curve measured in buffers and the measurement of zinc in the cells. Thus, an in situ calibration curve is desirable to determine the response of CA_RFP sensors to alterations in readily exchangeable zinc concentrations in the cell. E. coli is a gram-negative bacterium that has an outer membrane acting as an extra barrier against the perfusion of divalent ions. To equilibrate the zinc buffers across the cell membranes, first the outer membrane is weakened through a brief incubation with EDTA to destabilize the lipopolysaccharide structure36 and facilitate permeabilization by chelating divalent ions bound to lipopolysaccharide. After washing, the cells are incubated with the membrane permeabilizer digitonin14 and zinc buffers. Since the zinc affinity of CAII is pH dependent,37 it is important to carry out the in situ calibrations at a pH close to the physiological pH of the E. coli cytosol. Previous data indicate that in minimal medium with an extracellular pH of 7.4, the intracellular pH in E. coli is ∼7.6 (Ref. 38). The in situ calibrations were carried out using BL21(DE3) cells containing a mature CA_RFP sensor, which were first briefly incubated with EDTA, and then incubated for 20 min with NTA-chelated zinc buffers plus digitonin and DPS to equilibrate. Doubling the incubation time with the zinc buffers had no effect on the fluorescent ratio, indicating that the system readily equilibrates within this time frame. Consistent with this, the measured fluorescent ratio in the in situ calibration cell samples at both low and high concentrations of free zinc are comparable to the values measured for the in vitro calibration. It is worth noting that the response time of the expressed CA_TagRFP sensor to changes in the free zinc concentration under both in vivo and in situ conditions is faster than predicted from the measured in vitro zinc equilibration rate constants (k ex ∼k on[Zn]free + k off) for wild-type CAII; the zinc dissociation rate constant has been estimated as 8×10⁻⁸ s−1.32 However, the CA_FP fusion proteins likely have faster dissociation rates consistent with the higher values of [TeX:] $K_{D,{\rm app}}^{Zn} $ . Zinc exchange in vitro can be enhanced by the addition of small molecule chelators, such as dipicolinate39 and in vivo CAII zinc equilibration may also be catalyzed. In situ calibrations were carried out using buffered solutions at both pH 7.0 and pH 7.6. The cells were imaged to measure the I FRET/I FP ratio at various free zinc concentrations maintained using NTA buffers (Fig. 6) and the values for the in situ [TeX:] $K_{D,{\rm app}}^{Zn} $ were calculated by fitting a binding isotherm to these data, as summarized in Table 1. At pH 7.0, the values determined for in situ [TeX:] $K_{D,{\rm app}}^{Zn} $ are similar for all of the CA_RFP variants (133 to 200 pM) except H94N CA_TagRFP (300 ± 90 nm). In all cases, the value of in situ [TeX:] $K_{D,{\rm app}}^{Zn} $ is larger than the value determined from the in vitro calibrations for reasons that are unclear. At pH 7.6, the value of [TeX:] $K_{D,{\rm app}}^{Zn} $ for wt CA_RFP decreases to 32 pM, consistent with the pH dependence of the zinc affinity of wt CAII.37 Two sensors, containing the Q92A or T199A mutations, have higher apparent zinc affinities ( [TeX:] $K_{D,{\rm app}}^{Zn} $ = 7 and 11 pM, respectively) than wild type at pH 7.6, consistent with the higher zinc-water pK a values for these mutants.40 These variations in the affinity of these sensors allow both measurement of a wider dynamic range of intracellular free zinc concentrations (5 pM to 50 nm) and confirmation of the zinc concentration using sensors with different values of [TeX:] $K_{D,{\rm app}}^{Zn} $ . Fig. 6In situ calibration of CA_RFP zinc sensors at pH 7.0 (a) and pH 7.6 (b) E. coli cells treated with membrane disruptors (EDTA and digitonin, as described in Sec. 4) were incubated with NTA-chelated zinc buffers with various free zinc concentrations at pH 7.0 and pH 7.6. The I FRET/I FP value averaged over all of the cells on the ratio images was determined at various concentrations of [Zn2+]free and the apparent [TeX:] $K_{D,{\rm app}}^{Zn} $ values are listed in Table 1.  2.5.Measurement of Intracellular Free Zinc Concentration in E. coliThe intracellular free zinc concentration of E. coli cultured in the 4-morpholinepropanesulfonic acid (MOPS)-buffered minimal medium at log phase was measured using wt CA_TagRFP based on the in situ calibration at pH 7.6 [Fig. 7a]. The average I FRET/I FP ratio within single E. coli cells was measured to calculate the intracellular free zinc concentration. The standard deviation of the I FRET/I FP ratio from single pixels within a single cell (300 to 500 pixels/cell) was less than 5%, which is well within the normal error range of fluorescence imaging. These data indicate that there is no significant differential distribution of readily exchangeable zinc concentration within a cell. However, some variability in the readily exchangeable zinc concentration was observed among the cell population. An analysis of a sample of ∼500 cells revealed that the majority of the cells (∼80%) had intracellular free zinc concentrations within the 10 to 30 pM range (Fig. 7). Around 10% of the cells exhibited higher intracellular free zinc concentration (40 to 80 pM) and ∼1.5% of the cells had zinc concentrations higher than 100 pM. We speculate that the cells with the significantly higher concentrations may be damaged or dying and therefore unable to regulate their zinc concentration. The median intracellular readily exchangeable zinc concentration among this population of cells was 20 pM. This number was confirmed by measuring the intracellular free zinc concentration using the Q92A and T199A CA_TagRFP expressible sensors. For both mutants, the average I FRET/I FP ratio for the cell population was higher than that observed for wt CA_TagRFP, consistent with the higher zinc affinity of these sensors. The measured average occupancies of the three sensors are placed on the in situ calibration curves in Fig. 7b, demonstrating that all three sensors report an intracellular free zinc concentration in the range of 15 to 40 pM. The comparability of the results using different sensors with altered zinc affinities and zinc equilibration rates also provides evidence that the zinc sensors readily equilibrate with the intracellular zinc concentration. Fig. 7Measurement of E. coli intracellular readily exchangeable zinc concentrations. (a) Distribution of intracellular readily exchangeable zinc concentration among E. coli cells. Average I FRET/I FP ratio within a single cell was measured to calculate the corresponding intracellular free zinc concentration based on the in situ calibration at pH 7.6. ∼500 E. coli cells were imaged and analyzed. The percentage of cells with each intracellular free zinc concentration is shown in (a). The intracellular readily exchangeable zinc concentrations of the majority of the cells (>80%) fall within the 10 to 30 pM range with the median at 20 pM. (b) Average occupancies of CA_TagRFP sensors in E. coli cells and the corresponding average free zinc concentrations calculated from the in situ calibration curves are shown. The average sensor occupancies of wild type, Q92A and T199A CAII are 46±8%, 74±5%, and 64±8%, respectively, corresponding to the free zinc concentration of 15 to 40 pM. The range of the measured free zinc concentration is shaded in gray.  One important assumption of this method is that the binding of zinc to carbonic anhydrase does not change the intracellular readily exchangeable zinc concentration significantly. For measurements in the cells, the sensor concentration is maintained at a low level compared to the capacity of the total zinc pool by inducing expression of the sensor (incubation with 50 μM IPTG), harvesting the cells and then incubating in fresh medium (without IPTG) for several doubling times. We estimated by fluorescence and gel quantification that the sensor concentration is 10 to 20 μM, which is only a small fraction of the total zinc content of 200 μM as measured by ICP-MS. Furthermore, we altered the sensor expression level more than 10-fold by changing the concentration of IPTG used to induce expression (Fig. 8). The I FRET/I FP ratio was independent of the sensor concentration even when the concentration approaches the total zinc content (measured in cells without overexpressed CAII). Here, we hypothesize that in contrast to a closed system, E. coli can actively import zinc from the medium to meet the need of newly synthesized metalloproteins and maintain cellular zinc levels. Fig. 8I FRET/I FP ratio is independent of the sensor concentration; E. coli cells transformed with wild type CA_TagRFP were induced with various concentrations of IPTG overnight, then diluted into fresh medium and grown for 1.5 h at 30 °C. When OD600∼0.6, samples were taken for both imaging and protein analysis. The SDS-PAGE gel shows the varied CA_TagRFP expression levels; the arrow denotes the CA_TagRFP protein band. The I FRET/I FP ratio is constant as the sensor level varies.  A value of 20 pM readily exchangeable zinc concentration in an E. coli cell corresponds to <1 free zinc ion per cell (calculated using a cell volume of 1.0×10⁻¹⁵ liter); the intracellular free zinc concentration has to be at least 1 nm to ensure 1 free zinc ion in each cell.9 However, since the total zinc concentration in these cells is ∼200 μM (measured by ICP-MS), the intracellular zinc measurements are consistent with the existence of an exchangeable zinc pool in the cell chelated by numerous metal ligands, including proteins, nucleic acids and small molecules, that function as a zinc buffer. The expressed CA sensors form a portion of the zinc buffering capacity in the cell and equilibrate with the readily exchangeable zinc pool, as indicated by the lack of dependence of the fluorescence ratio on the sensor concentration. This principle is general for all fluorescent indicators used to measure analyte concentrations in cells. A similar analogy is the measurement of pH; pH indicators equilibrate with various proton-binding species in the solution to reach a steady level of protonation, and to provide a readout of the ensemble proton level in the system. Similarly, we are measuring the pZn level using the expressed CA sensors. Previous in vitro measurements have shown that the transcription factors that regulate the zinc transporter expression in response to changes in zinc concentration, ZntR and Zur, have femtomolar affinity for zinc,9, 41 leading to the proposal that cellular free zinc levels were in the femtomolar range. One possible explanation for the apparently paradoxical higher cellular concentrations reported by the CA sensors (20 pM) is that the zinc occupancy of these transcription factors may not rapidly equilibrate with the readily exchangeable intracellular zinc pool when the concentration is in the picomolar range, consistent with their slow zinc dissociation rates.42 However, high extracellular zinc concentrations that lead to rapid induction of Zn-dependent transcription43 also increase the intracellular zinc concentration to the nanomolar range (see Sec. 2.6). This increase in the readily exchangeable zinc concentration will accelerate the cellular response to zinc stress that is slow at lower zinc concentrations. For example, the dissociation constant of the transcription factor ZntR is 10−15 M (Ref. 41), and reasonable assumptions for the association and dissociation rate constants for Zn2+ are 107 M−1 s−1 and 10−8 s−1. Therefore, zinc equilibration is estimated to have a half-time of ∼1 h at 20 pM zinc and ∼5 s at 20 nm zinc. Many native Zn2+ enzymes typically have K D Zn values of 1 to 10 pM (measured in vitro),41 so they should be saturated at 20 pM zinc. Other metalloproteins have lower affinities for zinc suggesting either that the readily exchangeable cellular zinc concentration can vary depending on cellular demand and growth conditions (as proposed by Eide),6 or that the zinc occupancy of these proteins does not equilibrate readily with the free zinc pool (as proposed by Outten and O’Halloran).9 Recent results also demonstrate that some metalloenzymes alter their native metal cofactor in response to changes in metal availability.44 2.6.Measurement of Intracellular Free Zinc Concentration in E. coli After Zinc ShockTo investigate whether the intracellular exchangeable zinc concentration is sensitive to the extracellular zinc concentration, we used the H94N CA_TagRFP sensor to measure real-time alterations in intracellular zinc concentration after the addition of 2.5 μM total ZnSO4 to the medium (>90% of which is free). Under these conditions, the intracellular readily exchangeable zinc concentration increases to a maximum of 35 to 40 nm within 20 min and then decreases over the next 1.5 h to a final value that is elevated (1000 pM) in comparison to the starting value (see Fig. 9). These data demonstrate that the readily exchangeable zinc concentration in E. coli varies significantly with the extracellular zinc concentration. Similarly, exposure of yeast to high environmental zinc (zinc shock) leads to an increase in the cytosolic free zinc concentration, which then falls back to near base-line level as the cell sequesters the excess cytosolic zinc into the vacuole.45 E. coli may exploit its own unique regulatory machinery to adapt to the high extracellular zinc. Previous genomic and proteomic data43, 46, 47 suggest the involvement of both zinc transporters and intracellular ligands in the cellular response to zinc shock. These data demonstrate that the CA_TagRFP sensor is able to measure the kinetics of changes in the zinc concentration and will be a valuable tool for examining the determinants of zinc homeostasis in bacteria. 3.ConclusionsIn this work, genetically encoded carbonic anhydrase-based zinc sensors were constructed by fusing a red fluorescent protein as a FRET acceptor to the C-terminus of CA-bound dapoxyl sulfonamide. A series of CA_RFP sensors were constructed and characterized both in vitro and in situ to optimize both the optical properties and the dynamic range of the zinc sensor. In the future, the sensor could be further developed by the additional alteration of the metal binding properties and adapted for use in eukaryotic cells targeted to specific organelles. These sensors were used to image the intracellular rapidly exchangeable zinc concentration in the fast growing model organism E. coli at log phase in minimal medium; the median zinc concentration is 20 pM with a range of 10 to 40 pM observed in the majority of the cells. These measurements provide evidence for the availability of a zinc pool in E. coli where the excess total zinc is buffered by ligands and the sensor equilibrates with the low free zinc concentration without significantly disturbing the system. This hypothesis was supported by the following data: 1. alteration of the sensor concentration in vivo has no significant effect on the measured zinc concentration; 2. application of CA sensors with different zinc affinities provides comparable zinc concentrations; and 3. measurement of the intracellular free zinc concentration is independent of equilibration time, indicating that the sensor equilibrates with the intracellular zinc concentration within minutes. Zinc homeostasis in E. coli is proposed to be tightly controlled under normal growth conditions.9 However, variations in the intracellular free zinc concentration among individual E. coli cells were observed under our experimental conditions. The free zinc content of the majority of cells falls within a narrow range; however, a small fraction of cells exhibit significantly increased readily exchangeable intracellular zinc concentration. Furthermore, changes in intracellular free zinc under high environmental zinc conditions were observed. The reasons and biological processes that lead to variability in the readily exchangeable zinc concentration remain to be elucidated. These variations could be related to alterations in the cell cycle, redox state, and/or energy metabolism. Recent advances in expressible zinc sensors and their applications in prokaryotes and mammalian cells will provide powerful tools to decipher the physiological and pathological roles of zinc. 4.Materials and Methods4.1.Construction of CA_RFP SensorsThe human carbonic anhydrase II gene was sub-cloned from the vector pACA.48 DsRed2, TagRFP, and mCherry genes were cloned from the vectors pDsRed2 (Clontech), pTagRFP-N (Evrogen), and pRSET_mCherry (a gift from the Roger Tsien lab), respectively. The genes containing CA fused with a C-terminal red fluorescent protein (CA_RFP) were constructed through overlap PCR with a 1- or 3-glycine linker between CA and RFP. The fusion gene CA_RFP was inserted into the expression vector pET24a (Novagen) between the restriction sites NdeI and XhoI with a C-terminal 6×His Tag for purification. Another plasmid, pACA_DsRed2, was constructed for the expression of CA_DsRed2 by inserting the DsRed2 gene into the vector pACA after the CA gene with a one-glycine linker in between. 4.2.Protein Expression and PurificationE. coli BL21(DE3) cells transformed with each plasmid were grown in 2×YT medium with 50 μg/ml kanamycin to OD600∼0.8 and then the expression of the fusion protein was induced by addition of 250 μM IPTG. After incubation at 30 °C for 3 h, protease inhibitors (7.4 μg/ml phenylmethanesulfonyl fluoride and 0.92 μg/ml tosyl-L-argininyl-methyl ester were added into the cultures. After another 3 h of incubation, the cells were harvested and lysed using a Microfluidizer (Microfluidics). After removal of cell debris by centrifugation, nucleic acids were precipitated using 1% streptomycin sulfate and the lysate was clarified by centrifugation. The supernatants containing CA_mCherry-His6 and CA_TagRFP-His6 were dialyzed against Buffer C (30 mM HEPES, pH 8.0, 2 mM imidazole, and 250 mM NaCl) overnight, loaded onto a Ni-coated Chelating Sepharose column (GE Healthcare), washed with Buffer C and eluted with a 0.05 to 0.5 M imidazole gradient. Purified fractions of all three proteins were dialyzed against 10 mM MOPS, pH 7.0 before use or storage. CA_DsRed2 was purified using an alternate method. A clarified cell lysate containing CA_DsRed2 was dialyzed against Buffer A (10 mM Tris-SO4, pH 8.0, 0.2 mM ZnSO4, 1 mM tris[(2-carboxyethyl)phosphine hydrochloride (TCEP)] overnight and applied to a DEAE Sepharose (GE Healthcare) column equilibrated with this same buffer. The majority of CA_DsRed2 did not bind to the resin and was collected in the flow through. This CA_DsRed2 solution was then dialyzed against buffer B (10 mm MES, pH 7.0, 0.1 mm ZnSO4, and 1 mM TCEP) overnight, loaded onto an SP Sepharose (GE Healthcare) column, and eluted with a 0.05 to 0.5 M (NH4)2SO4 gradient. The CA_DsRed2 protein appeared in the fractions containing 0.1 to 0.25 M (NH4)2SO4 as verified by SDS-PAGE. The purified protein was dialyzed against 10 mM MOPS buffer, pH 7.0 before storage at −80 °C. 4.3.Synthesis of Dapoxyl Sulfonamide10 mg Dapoxyl sulfonyl chloride (Molecular Probes/Invitrogen) was dissolved in 2 ml dry acetonitrile and placed in a 10 ml pre-dried reaction flask. Anhydrous ammonia gas was run through a condenser with a dry ice/acetone bath and liquid ammonia was dripped into the dapoxyl sulfonyl chloride solution over a 30 min period. Upon addition of ammonia, the reaction mixture turned yellow-green. At the end of the reaction, excess ammonia was evaporated slowly by gently blowing N2 gas into the reaction vial. The reaction mixture was dried down using a speed vacuum and the resulting powder was redissolved in 1.5 ml 1:1 methanol/acetonitrile. The product was purified by preparatory C18 reverse-phase HPLC (CH3CN/H2O-0.1% TFA, 5%-100% over 60 min, 5 ml/min, 350 nm detection, and t R = 42 min). Dapoxyl sulfonamide was confirmed by comparison to known samples using thin layer silica chromatography (R f ∼0.8), liquid chromatography-mass spectrometry [LC-MS: m/z (M+H) single peak at 344.0] and fluorescence spectroscopy with an emission peak at 535 nm when excited at 350 nm in the presence of zinc-bound wild type carbonic anhydrase.24 4.4.In Vitro Characterization of CA_RFPsFor the in vitro metal analysis experiments, all solutions were preincubated with Chelex® resin for several hours to remove contaminating metal ions. Metal ions, including the active site zinc ion, were removed from the purified CA_RFP proteins by dialysis in 10 mM MOPS, pH 7.0, and 50 mM dipicolinic acid (DPA) at 25 °C overnight. Excess DPA was then removed by running the protein solution through a PD-10 desalting column (GE Healthcare). The metal content of the protein was <3%, verified by ICP-MS. For spectral characterization and microscope calibration, 1 μM metal-free sensor protein was incubated with NTA-chelated zinc buffers (10 mM MOPS, 2 mM NTA, and various concentrations of ZnSO4 at pH 7.0, as previously described in Ref. 31) at 25 °C overnight, then DPS dissolved in dimethyl sulfoxide (DMSO) was added into the solution to a final concentration of 2 μM; control samples contained an equal concentration of DMSO. The spectra were taken on a Cary Eclipse fluorescence spectrophotometer (Varian Medical Systems). For microscope calibration, the solution was placed into a 96-well plate, and the fluorescence images were taken under the optical settings described in the fluorescence microscopy section. 4.5.Growth Conditions of E. coliE. coli strain BL21(DE3) transformed with a CA_RFP plasmid was cultured in a chemically defined MOPS minimal medium.33 This medium is mainly buffered by 40 mM MOPS; the phosphate concentration is sufficiently low (1.32 mm) to minimize precipitation at high zinc levels. The overnight culture was diluted 1: 100 into 5 ml MOPS medium in a 125 ml flask. Protein expression was induced by addition of 50 μM IPTG at OD600∼0.3, and the culture was incubated at 30 °C overnight to allow maturation of the fluorescent protein. Then 0.5 ml of this culture was harvested, the cells were washed twice with MOPS medium without IPTG, and then resuspended into 5 ml MOPS medium. Cells were incubated at 30 °C for 2 to 3 doubling times to OD600 0.3 to 0.6 before microscopic analysis. 4.6.Microscopy Sample PreparationE. coli cells were placed on a poly-L-lysine coated 96-well glass bottom plate (MatriCal Bioscience), incubated with 2 μM DPS in 100 μl MOPS medium for 20 min, then the excess DPS solution was removed and MOPS medium was added back before imaging. For in situ calibration, the cells in the 96-well plate were first incubated with 100 μl 1 mM EDTA in 10 mm metal-free MOPS buffer, pH 7.5 for 10 min. This solution was removed and the cells washed with 100 μl MOPS buffer. Finally, the cells were incubated for 20 min with 100 μl MOPS-NTA-Zn buffers containing 30 μM digitonin (made fresh from 30 mM stock in DMSO) and 2 μM DPS (made fresh from 200 μM stock in DMSO). Twenty minutes is sufficient to reach equilibrium as experiments conducted under longer incubation (30 and 40 min) generate the same results. The cells were then washed once with MOPS-NTA-Zn buffers without digitonin and DPS and imaged. 4.7.Fluorescence MicroscopySamples of cells or solution were photographed using a Nikon Eclipse TE2000 U inverted epifluorescence microscope through a Nikon Plan Fluor 100×/1.3 NA objective with a Photometrics CoolSNAP HQ cooled CCD camera. Fluorescence images of protein solution and live cells were acquired using the software MetaMorph (Molecular Devices). The filter sets for fluorescence imaging are summarized in Tables 2, 3. All filters and dichroic mirrors were purchased from Chroma Technology Corporation. Table 3Fluorescence imaging filter sets for different CA_RFP sensors.
4.8.Data AnalysisFluorescence images were analyzed using the software ImageJ. Background fluorescence was subtracted from the FRET and FP channel images. The average fluorescence intensity from the FRET images of pET24a cells plus DPS was also measured and subtracted from the FRET images with CA_RFP sensors to correct for the background from membrane bound DPS. A ratio image of IFRET/IFP was then created, and the average intensity in each cell was calculated to correlate with the free zinc concentration based on the in situ calibration curve. AcknowldgmentsWe thank Roger Tsien for the generous gift of mCherry and mOrange plasmids, and Roberto de la Salud Bea for his help with DPS synthesis. We acknowledge the support of the National Institute of Health and National Institute of Biomedical Imaging and Bioengineering for Grant No. RO1 EB003924. ReferencesB. L. Vallee and
K. H. Falchuk,
“The biochemical basis of zinc physiology,”
Physiol. Rev., 73
(1), 79
–118
(1993). Google Scholar
D. S. Auld,
“Zinc coordination sphere in biochemical zinc sites,”
Biometals, 14
(3–4), 271
–313
(2001). https://doi.org/10.1023/A:1012976615056 Google Scholar
J. H. Laity, B. M. Lee, and
P. E. Wright,
“Zinc finger proteins: new insights into structural and functional diversity,”
Curr. Opin. Struct. Biol., 11
(1), 39
–46
(2001). https://doi.org/10.1016/S0959-440X(00)00167-6 Google Scholar
J. M. Matthews and
M. Sunde,
“Zinc fingers–folds for many occasions,”
IUBMB Life, 54
(6), 351
–355
(2002). https://doi.org/10.1080/15216540216035 Google Scholar
K. E. Dineley, T. V. Votyakova, and
I. J. Reynolds,
“Zinc inhibition of cellular energy production: implications for mitochondria and neurodegeneration,”
J. Neurochem., 85
(3), 563
–570
(2003). https://doi.org/10.1046/j.1471-4159.2003.01678.x Google Scholar
D. J. Eide,
“Zinc transporters and the cellular trafficking of zinc,”
Biochim. Biophys. Acta., 1763
(7), 711
–722
(2006). https://doi.org/10.1016/j.bbamcr.2006.03.005 Google Scholar
D. J. Eide,
“Multiple regulatory mechanisms maintain zinc homeostasis in Saccharomyces cerevisiae,”
J. Nutr., 133
(5 Suppl 1), 1532S
–1535S
(2003). Google Scholar
K. Hantke,
“Bacterial zinc transporters and regulators,”
Biometals, 14
(3–4), 239
–249
(2001). https://doi.org/10.1023/A:1012984713391 Google Scholar
C. E. Outten and
T. V. O’Halloran,
“Femtomolar sensitivity of metalloregulatory proteins controlling zinc homeostasis,”
Science, 292
(5526), 2488
–2492
(2001). https://doi.org/10.1126/science.1060331 Google Scholar
T. J. Simons,
“Intracellular free zinc and zinc buffering in human red blood cells,”
J. Membr. Biol., 123
(1), 63
–71
(1991). https://doi.org/10.1007/BF01993964 Google Scholar
A. Krezel and
W. Maret,
“Zinc-buffering capacity of a eukaryotic cell at physiological pZn,”
J. Biol. Inorg. Chem., 11
(8), 1049
–1062
(2006). https://doi.org/10.1007/s00775-006-0150-5 Google Scholar
R. A. Bozym, R. B. Thompson, A. K. Stoddard, and
C. A. Fierke,
“Measuring picomolar intracellular exchangeable zinc in PC-12 cells using a ratiometric fluorescence biosensor,”
Acs. Chem. Biol., 1
(2), 103
–111
(2006). https://doi.org/10.1021/cb500043a Google Scholar
J. L. Vinkenborg, T. J. Nicolson, E. A. Bellomo, M. S. Koay, G. A. Rutter, and
M. Merkx,
“Genetically encoded FRET sensors to monitor intracellular Zn2 +homeostasis,”
Nat. Methods, 6
(10), 737
–740
(2009). https://doi.org/10.1038/nmeth.1368 Google Scholar
P. J. Dittmer, J. G. Miranda, J. A. Gorski, and
A. E. Palmer,
“Genetically encoded sensors to elucidate spatial distribution of cellular zinc,”
J. Biol. Chem., 284
(24), 16289
–16297
(2009). https://doi.org/10.1074/jbc.M900501200 Google Scholar
H. Haase and
D. Beyersmann,
“Intracellular zinc distribution and transport in C6 rat glioma cells,”
Biochem. Biophys. Res. Commun., 296
(4), 923
–928
(2002). https://doi.org/10.1016/S0006-291X(02)02017-X Google Scholar
E. M. Nolan and
S. J. Lippard,
“Small-molecule fluorescent sensors for investigating zinc metalloneurochemistry,”
Acc. Chem. Res., 42
(1), 193
–203
(2009). https://doi.org/10.1021/ar8001409 Google Scholar
R. B. Thompson, D. Peterson, W. Mahoney, M. Cramer, B. P. Maliwal, S. W. Suh, C. Frederickson, C. Fierke, and
P. Herman,
“Fluorescent zinc indicators for neurobiology,”
J. Neurosci. Meth., 118
(1), 63
–75
(2002). https://doi.org/10.1016/S0165-0270(02)00144-9 Google Scholar
T. K. Hurst, D. Wang, R. B. Thompson, and
C. A. Fierke,
“Carbonic anhydrase II-based metal ion sensing: Advances and new perspectives,”
Biochim. Biophys. Acta., 1804
(2), 393
–403 Google Scholar
L. L. Pearce, R. E. Gandley, W. Han, K. Wasserloos, M. Stitt, A. J. Kanai, M. K. McLaughlin, B. R. Pitt, and
E. S. Levitan,
“Role of metallothionein in nitric oxide signaling as revealed by a green fluorescent fusion protein,”
Proc. Natl. Acad. Sci. U. S. A., 97
(1), 477
–482
(2000). https://doi.org/10.1073/pnas.97.1.477 Google Scholar
M. D. Shults, D. A. Pearce, and
B. Imperiali,
“Modular and tunable chemosensor scaffold for divalent zinc,”
J. Am. Chem. Soc., 125
(35), 10591
–10597
(2003). https://doi.org/10.1021/ja0355980 Google Scholar
N. U. Meldrum and
F. J. Roughton,
“Carbonic anhydrase. Its preparation and properties,”
J. Physiol., 80
(2), 113
–142
(1933). https://doi.org/10.1038/131874b0 Google Scholar
J. A. Hunt, M. Ahmed, and
C. A. Fierke,
“Metal binding specificity in carbonic anhydrase is influenced by conserved hydrophobic core residues,”
Biochemistry, 38
(28), 9054
–9062
(1999). https://doi.org/10.1021/bi9900166 Google Scholar
C. A. Fierke and
R. B. Thompson,
“Fluorescence-based biosensing of zinc using carbonic anhydrase,”
Biometals, 14
(3–4), 205
–222
(2001). https://doi.org/10.1023/A:1012980628412 Google Scholar
R. B. Thompson, B. P. Maliwal, and
H. H. Zeng,
“Zinc biosensing with multiphoton excitation using carbonic anhydrase and improved fluorophores,”
J. Biomed. Opt., 5
(1), 17
–22
(2000). https://doi.org/10.1117/1.429963 Google Scholar
R. B. Thompson, M. L. Cramer, R. Bozym, and
C. A. Fierke,
“Excitation ratiometric fluorescent biosensor for zinc ion at picomolar levels,”
J. Biomed. Opt., 7
(4), 555
–560
(2002). https://doi.org/10.1117/1.1501886 Google Scholar
R. E. Campbell, O. Tour, A. E. Palmer, P. A. Steinbach, G. S. Baird, D. A. Zacharias, and
R. Y. Tsien,
“A monomeric red fluorescent protein,”
Proc. Natl. Acad. Sci. U.S.A., 99
(12), 7877
–7882
(2002). https://doi.org/10.1073/pnas.082243699 Google Scholar
N. C. Shaner, R. E. Campbell, P. A. Steinbach, B. N. Giepmans, A. E. Palmer, and
R. Y. Tsien,
“Improved monomeric red, orange, and yellow fluorescent proteins derived from Discosoma sp. red fluorescent protein,”
Nat. Biotechnol., 22
(12), 1567
–1572
(2004). https://doi.org/10.1038/nbt1037 Google Scholar
E. M. Merzlyak, J. Goedhart, D. Shcherbo, M. E. Bulina, A. S. Shcheglov, A. F. Fradkov, A. Gaintzeva, K. A. Lukyanov, S. Lukyanov, T. W. Gadella, and
D. M. Chudakov,
“Bright monomeric red fluorescent protein with an extended fluorescence lifetime,”
Nat. Methods, 4
(7), 555
–557
(2007). https://doi.org/10.1038/nmeth1062 Google Scholar
L. L. Kiefer, S. A. Paterno, and
C. A. Fierke,
“Hydrogen-bond network in the metal-binding site of carbonic-anhydrase enhances zinc affinity and catalytic efficiency,”
J. Am. Chemi. Soc., 117
(26), 6831
–6837
(1995). https://doi.org/10.1021/ja00131a004 Google Scholar
C. A. Lesburg, C. Huang, D. W. Christianson, and
C. A. Fierke,
“Histidine –> carboxamide ligand substitutions in the zinc binding site of carbonic anhydrase II alter metal coordination geometry but retain catalytic activity,”
Biochemistry, 36
(50), 15780
–15791
(1997). https://doi.org/10.1021/bi971296x Google Scholar
R. Bozym, T. K. Hurst, N. Westerberg, A. Stoddard, C. A. Fierke, C. J. Frederickson, and
R. B. Thompson,
“Determination of zinc using carbonic anhydrase-based fluorescence biosensors,”
Method Enzymol., 450 287
–309
(2008). https://doi.org/10.1016/S0076-6879(08)03414-9 Google Scholar
J. A. Hunt and
C. A. Fierke,
“Selection of carbonic anhydrase variants displayed on phage. Aromatic residues in zinc binding site enhance metal affinity and equilibration kinetics,”
J. Biol. Chem., 272
(33), 20364
–20372
(1997). https://doi.org/10.1074/jbc.272.33.20364 Google Scholar
F. C. Neidhardt, P. L. Bloch, and
D. F. Smith,
“Culture medium for enterobacteria,”
J. Bacteriol., 119
(3), 736
–747
(1974). Google Scholar
L. D. Plank and
J. D. Harvey,
“Generation time statistics of Escherichia coli B measured by synchronous culture techniques,”
J. Gen. Microbiol., 115
(1), 69
–77
(1979). https://doi.org/10.1099/00221287-115-1-69 Google Scholar
T. H. Maren,
“Direct measurements of the rate constants of sulfonamides with carbonic anhydrase,”
Mol. Pharmacol., 41
(2), 419
–426
(1992). Google Scholar
H. L. Alakomi, A. Paananen, M. L. Suihko, I. M. Helander, and
M. Saarela,
“Weakening effect of cell permeabilizers on gram-negative bacteria causing biodeterioration,”
Appl. Environ. Microbiol., 72
(7), 4695
–4703
(2006). https://doi.org/10.1128/AEM.00142-06 Google Scholar
S. Lindskog and
B. G. Malmstrom,
“Metal binding and catalytic activity in bovine carbonic anhydrase,”
J. Biol. Chem., 237 1129
–1137
(1962). Google Scholar
J. L. Slonczewski, B. P. Rosen, J. R. Alger, and
R. M. Macnab,
“pH homeostasis in Escherichia coli: measurement by 31P nuclear magnetic resonance of methylphosphonate and phosphate,”
Proc. Natl. Acad. Sci. U.S.A., 78
(10), 6271
–6275
(1981). https://doi.org/10.1073/pnas.78.10.6271 Google Scholar
J. B. Hunt, M. J. Rhee, and
C. B. Storm,
“A rapid and convenient preparation of apocarbonic anhydrase,”
Anal. Biochem., 79
(1–2), 614
–617
(1977). https://doi.org/10.1016/0003-2697(77)90444-4 Google Scholar
J. F. Krebs, J. A. Ippolito, D. W. Christianson, and
C. A. Fierke,
“Structural and functional importance of a conserved hydrogen bond network in human carbonic anhydrase II,”
J. Biol. Chem., 268
(36), 27458
–27466
(1993). Google Scholar
Y. Hitomi, C. E. Outten, and
T. V. O’Halloran,
“Extreme zinc-binding thermodynamics of the metal sensor/regulator protein, ZntR,”
J. Am. Chem. Soc., 123
(35), 8614
–8615
(2001). https://doi.org/10.1021/ja016146v Google Scholar
M. Huang, I. C. Shaw, and
D. H. Petering,
“Interprotein metal exchange between transcription factor IIIa and apo-metallothionein,”
J. Inorg. Biochem., 98
(4), 639
–648
(2004). https://doi.org/10.1016/j.jinorgbio.2004.02.004 Google Scholar
L. J. Lee, J. A. Barrett, and
R. K. Poole,
“Genome-wide transcriptional response of chemostat-cultured Escherichia coli to zinc,”
J. Bacteriol., 187
(3), 1124
–1134
(2005). https://doi.org/10.1128/JB.187.3.1124-1134.2005 Google Scholar
S. G. Gattis, M. Hernick, and
C. A. Fierke,
“Active site metal ion in UDP-3-O-((R)-3-hydroxymyristoyl)-N-acetylglucosamine deacetylase (LpxC) switches between Fe(II) and Zn(II) depending on cellular conditions,”
J. Biol. Chem., 285
(44), 33788
–33796 https://doi.org/10.1074/jbc.M110.147173 Google Scholar
C. W. MacDiarmid, M. A. Milanick, and
D. J. Eide,
“Induction of the ZRC1 metal tolerance gene in zinc-limited yeast confers resistance to zinc shock,”
J. Biol. Chem., 278
(17), 15065
–15072
(2003). https://doi.org/10.1074/jbc.M300568200 Google Scholar
R. J. Cousins, R. K. Blanchard, J. B. Moore, L. Cui, C. L. Green, J. P. Liuzzi, J. Cao, and
J. A. Bobo,
“Regulation of zinc metabolism and genomic outcomes,”
J. Nutr., 133
(5 Suppl 1), 1521S
–1526S
(2003). Google Scholar
T. K. Sigdel, R. Cilliers, P. R. Gursahaney, P. Thompson, J. A. Easton, and
M. W. Crowder,
“Probing the adaptive response of Escherichia coli to extracellular Zn(II),”
Biometals, 19
(5), 461
–471
(2006). https://doi.org/10.1007/s10534-005-4962-5 Google Scholar
S. K. Nair, T. L. Calderone, D. W. Christianson, and
C. A. Fierke,
“Altering the mouth of a hydrophobic pocket. Structure and kinetics of human carbonic anhydrase II mutants at residue Val-121,”
J. Biol. Chem., 266
(26), 17320
–17325
(1991). Google Scholar
|


