
|
|
1.IntroductionOvarian cancer has the lowest survival rate of the gynecologic cancers because it is predominantly diagnosed in Stages III and IV due to the lack of distinctive early symptoms and efficacious screening and diagnostic techniques. Prophylactic oophorectomy could reduce ovarian cancer risk by more than 50% and has become accepted as the standard of care for high risk women.1 However, it has recently been found to increase the mortality of women undergoing oophorectomy prior to the age of 452 or even before the age of 55 to 60.3 These high risk women are not candidates for hormone replacement therapy because of their increased risks of breast cancer.2 As a result, there is an urgent need to develop more sensitive tools to effectively evaluate the ovary during minimally invasive surgery so that a surgeon can determine if an early-stage cancer is present, and thus avoid removal of normal ovaries. Collagen fibers are the main scatterers in the stroma underlying the epithelium, and a study from fluorescence confocal microscopy have shown that collagen content and directivity in stroma may change as precancer or cancer develops.4 Optical coherence tomography (OCT), which measures backscattered light generated from an infrared light source directed to the tissue, could be a potential method for detecting ovarian cancer during minimally invasive surgery.5 In addition to offering high resolution morphological images, OCT is capable of quantitatively estimating total attenuation coefficient (μt) by fitting the A-line measurements.6, 7 μt is the summation of absorption coefficient (μa) and scattering coefficient (μs). As μa is much smaller than μs, μs is almost equal to μt and is a good estimate of the local scattering properties. Therefore, the quantitative μs extracted from OCT A-lines could reflect the local collagen content. This paper, to the best of our knowledge, is the first to report μs and its correlation with the collagen content in ex vivo human ovaries. The results have shown that changes in collagen can be an indicator of malignancy, and quantitative analysis of OCT images has the potential to characterize ovarian tissue and detect ovarian cancer. 2.Methods and Materials2.1.OCT Fitting ModelThe technical details of the OCT system were described in our previous publication.8 Two models are mainly used for the description of the OCT signal: the single scattering model and the multiple scattering model.6, 7 For weakly scattering media (μs < 6 mm−1), the single scattering model with dynamic focusing is valid to extract μs; for highly scattering media, the multiple scattering needs to be considered.7 In our case, it is suitable to use the single scattering model. The calculated numerical aperture 0.05 of the sample arm optics in our fixed focusing OCT system was very low, which ensured the superficial scanning depth within the focal zone. In order to obtain a more accurate fitting, a confocal point spread function (PSF) of fixed focusing geometry was taken into account.7 Therefore, the OCT signal as a function of depth z is described as the compound of confocal PSF and Beer’ law: where i(z) is the amplitude of the interference signal, z cf is the position of a focal plane, z R is the “apparent” Rayleigh length (in our experiment, z cf = 0, z R = 0.75 mm), and the factor 2 accounts for the round trip attenuation.2.2.Ovary and Collagen QuantificationA total of 18 ex vivo ovaries from 10 patients with age ranging from 32 to 79 (mean 56) were investigated. The detailed patient information can be found in a different study.8 The study protocol was approved by the Institutional Review Board of UCHC and signed informed consents were obtained from all patients. Ovaries were imaged immediately after they were excised. The imaged surfaces were positioned at the focal plane of the sample arm optics. The measurements were performed under rotational scanning geometry. To eliminate the effects of scattered photons outside of focal zone and tissue surface curvature, only a 300 μm region corresponding to 100 A-lines centrally around the perpendicular illumination was selected for averaging. μs was estimated by fitting the averaged depth profile to the model described by Eq. 1. The fitting started about 40 μm below the tissue surface to avoid the effect of the surface epithelium, which is typically composed of a single layer of cuboidal to columnar cells (typically 10 to 20-μm thick).9 After OCT imaging, the ovaries were fixed in formalin, cut in 5 mm blocks parallel to the OCT imaging plane, embedded in paraffin, and sectioned to 7-μm thickness. Once the slides that correspond to the imaged planes were identified, they were stained using Sirius Red (SR) which binds specifically to collagen.10 The digital histological images of ovarian tissue covering about 1-mm depth within the fitting range were acquired by a microscope. The amount of collagen was quantitatively analyzed using ImageJ (NIH). Collagen area fraction (CAF) was measured as “stained collagen area /tissue area.” 3.Results and DiscussionFigure 1 shows one set of examples from normal [Figs. 1a, 1b, 1c] and malignant [Figs. 1d, 1e, 1f] ovarian tissue. The μ s extracted from the OCT fitting areas marked as the white dashed squares in Figs. 1a, 1d are 2.86 and 1.29 mm−1, respectively. The inset in Fig. 1a shows the average A-line profile. The stained red area in Figs. 1c, 1f represents the collagen content. Clearly, the collagen amount, structure, and arrangement are quite different between normal and malignant ovarian tissues. The normal ovary exhibits almost exclusively collagen with interspersed stromal cells and the collagen fibril is randomly oriented and wavy interlaced; the collagen fibers in the malignant tissue are unidirectionally organized into thicker bundles. A larger amount of collagen is found in normal tissue (CAF = 58.3%) than in malignant tissue (CAF = 8.4%). Fig. 1One set of examples from normal [(a), (b), and (c)] and malignant [(d), (e), and (f)] ovarian tissue. (a) and (d) OCT images, (b) and (e) H&Es, and (c) and (f) SR stains. Inset: fitting example; blue arrows: collagen bundles. 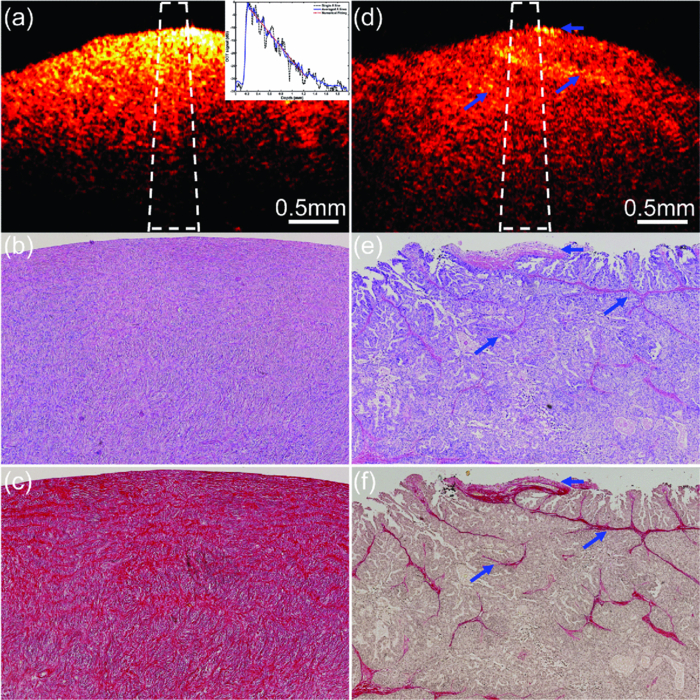 A total of 1097 μs were extracted from 108 sites of 18 ovaries. Based on the pathology results, 833 measurements of 88 sites are from normal ovarian tissue of 15 ovaries including normal ovaries (n = 7), ovaries with large cysts (n = 1), calcifications (n = 2), focal lymphocytes (n = 1), large follicles (n = 2), corpus luteum (n = 1), and a benign dermoid tumor (n = 1). However, fitting was performed at the normal tissue area based on corresponding H&E slides. 264 measurements of 20 sites are from malignant ovarian tissue of 3 malignant ovaries. The normal tissue group shows higher scattering property at a wavelength of 1310 nm ranging from 0.50 to 4.16 mm−1 with a mean value of 2.41 mm−1 (±0.59). The standard deviation per ovary of this group varies from 0.29 to 0.78 mm−1 with the premenopausal ovaries (n = 3) and the benign tumor ovary (n = 1) at the higher end. However, our premenopausal cases are limited to draw a conclusion. The malignant group demonstrates lower values ranging from 0.22 to 2.74 mm−1 with an average of 1.55 mm−1 (±0.46). The standard deviation per ovary of this group varies from 0.23 to 0.38 mm−1. Histograms of μs of normal and malignant ovarian tissue groups are shown in Fig. 2a. The comparison between normal and malignant groups by Student's t-test is statistically significant (p < 0.001) as shown in Fig. 2b. The receiver operating characteristic (ROC) curve which plots the true positive ratio versus false positive ratio is shown in Fig. 2c. The area under the curve (AUC) is 0.877. By selecting different thresholds of μ s located in the overlapping part of the two distributions, the sensitivity and specificity are summarized in the inset in Fig. 2c. Fig. 2(a) Histograms of μs obtained from normal (n = 833) and malignant (n = 264) ovarian tissue groups, Gaussian distribution fits are also shown. (b) Statistics of normal (mean ± std: 2.41 ± 0.59) and malignant groups (mean ± std: 1.55 ± 0.46). (c) ROC curve of μs. Inset table: specificity and sensitivity at different thresholds.  Figure 3a shows the histograms of CAFs obtained from normal (n = 158) and malignant (n = 143) ovarian tissue groups. The average CAF of normal group was 48.4% (±12.3%), while the average CAF of the malignant group was 11.4% (±4.7%). Figure 3b shows statistical significance between these two groups (p < 0.001). To compare with the ROC curve obtained from μs, we also provide the ROC curve obtained from the CAF as shown in Fig. 3c. The sensitivity and specificity based on the percentage of CAF are summarized in the inset in Fig. 3c. The AUC is 0.987 and the ratio of AUC obtained from μs to the AUC obtained from CAF is 0.89. Because SR stain binds specifically to collagen, the different collagen characteristics found in normal and malignant tissue groups could effectively explain the scattering properties estimated from OCT measurements obtained from these two groups. Note that elastin is another protein which may also perform a similar role on reducing optical scattering. However, by examining the SR and H&E stains, no elastic fiber is present in the ovarian stroma which was also reported by other researchers.11 There is probably elastin in the walls of vessels which could not be accounted as the major contributor to the μs obtained from malignant ovarian tissue. Regarding the effect of blood absorption on estimated μs, the ovaries were in saline water for a few minutes before imaging to remove the blood from the surface. For absorption of the ovarian tissue, our earlier study using diffused light showed that the ovarian tissue absorption coefficients were in the range of 0.006 to 0.018 mm−1 which was less than 1% of the average scattering coefficients reported here.12 Thus the fitted μt is a good estimate of μs. Fig. 3(a) Histograms of CAFs obtained from normal (n = 158) and malignant (n = 143) ovarian tissue groups, Gaussian distribution fits are shown. (b) Statistics of normal (mean ± std: 48.8 ± 12.3) and malignant groups (mean ± std: 11.4 ± 4.7). (c) ROC curve of CAF, Inset table: specificity and sensitivity at different thresholds.  4.SummaryIn this paper, optical scattering coefficients from normal and malignant ovarian tissue groups were quantitatively extracted by fitting the OCT signal to a single scattering model. CAFs were measured by analyzing microscopic images stained by SR. These results have shown that the malignant ovarian tissue has lower scattering coefficient and less collagen than that present in normal ovarian tissue. These initial findings suggest that quantitative analysis of ovarian tissue optical properties extracted from OCT images could be a powerful tool to reveal ovarian tissue neoplastic changes and to characterize ovarian cancers. AcknowledgmentsThis research was partially supported by the Connecticut Department of Public Health under contract DPH No. 2008–0121. ReferencesT. R. Rebbeck,
“Prophylactic oophorectomy in carriers of BRCA1 or BRCA2 mutations,”
N. Engl. J. Med., 346 1616
–1622
(2002). https://doi.org/10.1056/NEJMoa012158 Google Scholar
W. A. Rocca, B. R. Grossardt, M. de Andrade,
“Survival patterns after oophorectomy in premenopausal women: a population-based cohort study,”
Lancet. Oncol., 7 821
–828
(2006). https://doi.org/10.1016/S1470-2045(06)70869-5 Google Scholar
J. S. Berek,
“Prophylactic and risk-reducing bilateral salpingo-oophorectomy: recommendations based on risk of ovarian cancer,”
Obstet. Gynecol., 116 733
–743
(2010). https://doi.org/10.1097/AOG.0b013e3181ec5fc1 Google Scholar
D. Arifler, I. Pavlova, A. Gillenwater,
“Light scattering from collagen fiber networks micro-optical properties of normal and neoplastic stroma,”
Biophys. J., 92 3260
–3274
(2007). https://doi.org/10.1529/biophysj.106.089839 Google Scholar
M. A. Brewer,
“Imaging of the ovary,”
Technol. Cancer Res. Treat., 3 617
–627
(2004). Google Scholar
P. Lee, W. Gao, and
X. Zhang,
“Performance of single-scattering model versus multiple-scattering model in the determination of optical properties of biological tissue with optical coherence tomography,”
Appl. Opt., 49 3538
–3544
(2010). https://doi.org/10.1364/AO.49.003538 Google Scholar
D. J. Faber, F. J. van der Meer,
“Quantitative measurement of attenuation coefficients of weekly scattering media using optical coherence tomography,”
Opt. Express, 12 4353
–4365
(2004). https://doi.org/10.1364/OPEX.12.004353 Google Scholar
Y. Yang,
“Potential role of a hybrid intraoperative probe for ovarian cancer detection and characterization,”
Biomed. Opt. Express, 2 1918
–1930
(2011). https://doi.org/10.1364/BOE.2.001918 Google Scholar
P. B. Clement,
“Histology of the ovary,”
Am. J. Surg. Pathol., 11 277
–303
(1987). https://doi.org/10.1097/00000478-198704000-00006 Google Scholar
W. Malkusch, B. Rehn, and
J. Bruch,
“Advantages of Sirius Red staining for quantitative morphometric collagen measurements in lungs,”
Exp. Lung Res., 21 67
–77
(1995). https://doi.org/10.3109/01902149509031745 Google Scholar
E. Gheorghe, V. Tomuţa, T. Mehedinţi, M. Hîncu, and
V. Broască,
“Comparative microscopic study of the ovarian blood vessels,”
Rom. J. Morphol. Embryol., 48 151
–154
(2007). Google Scholar
A. Aguirre, Y. Ardeshirpour, M. Sanders,
“Potential role of co-registered photoacoustic and ultrasound imaging in ovarian cancer detection and characterization,”
Transl. Oncol., 4 29
–37
(2011). https://doi.org/10.1593/tlo.10187 Google Scholar
|


