|
|
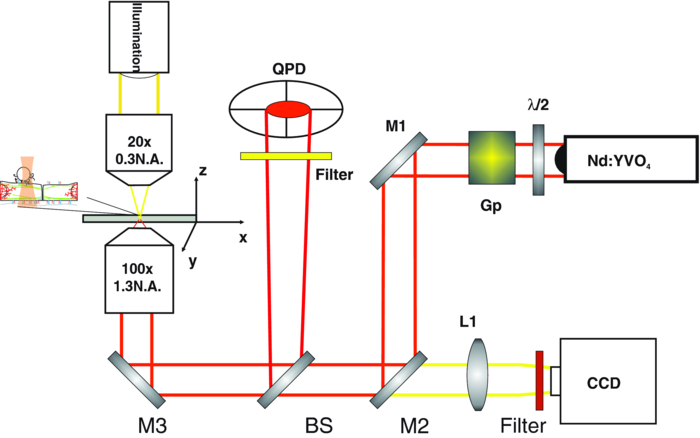
1.IntroductionThe ability of cells to sense and adapt to mechanical stresses is critical for basic cellular activities like migration, growth, differentiation, and cell lineage development.1, 2, 3, 4 Notably, it appears that cell mechanical strength and morphology are largely regulated by the cytoskeleton, a polymer network comprised of actin-microfilaments, microtubules, and intermediate filaments, which are known to fulfill many key cellular functional activities.5 While biochemical approaches are most appropriate for identifying cytoskeletal proteins interacting with membrane protein receptors at the cell surface, assessment of mechanical features of cells requires tools that allow generation of a stress stimulus of a few piconewtons to several nanonewtons at their surface membrane and to follow the cell's response over time. For instance, a dual-beam optical stretcher has been used as a mean to deform single suspended cells by optically induced forces and to assess the relationship between cellular viscoelasticity and cytoskeleton status,6, 7 suggesting in actual fact, that optical deformability can be used as an inherent marker for cell differentiation or transformation status. In another line of work, an optical tweezers has recently been used to trap a concanavalin (lectin)-coated bead and to assess its interaction with cell surface-exposed glycoproteins,8 many of which are receptors. In that work, the laser beam forced an oscillatory motion of the bead to measure in real time the force constant of the global ligand-receptor binding at the cell surface, typically in the few pN/μm range, in the presence or absence of actin-microfilament and microtubule-destabilizing drugs. In adherent cells, mechanical stresses are either transferred to the surface membrane from the extracellular matrix (ECM) or generated within the contractile actin cytoskeleton and exerted on the ECM adhesion.9, 10, 11 In both cases, the mechanical forces converge on integrins, the well characterized glycosylated receptors, which cluster within focal adhesion (FA) complexes at the surface membrane and physically link the ECM and actin cytoskeleton.9, 10, 11 However, little is known about the contribution of the other cytoskeleton networks, i.e., the microtubules and the cell-type dependent intermediate filaments. For instance, keratin intermediate filaments, the hallmark of epithelial cells,12, 13 are of particular interest because of their unique viscoelastic properties.5 Technically, a shearing force tangent to cell surface can be applied via a polystyrene bead coated with an ECM protein anchored to integrins using different stress generators, including a magnetic pulling cytometer and an optical tweezers.14, 15, 16, 17 Moreover, the evidence for a stress transduction to the cytoskeleton is provided by the fact that an optical tweezers-generated stress promotes the recruitment of actin-associated proteins, like vinculum and talin, involved in the linking of actin to integrin, and the stiffening of FAs.18 Considering integrins as mechanical sensors and transducers enables one to address the cell response to a regional cell surface-targeted stress. For instance, the use of a single laser tweezers has allowed measurement of the minimal force required for breaking the connection between the actin cytoskeleton and integrin bound to sub-micron beads coated with a very low density of fibronectin.19 This has suggested that talin forms a molecular slip bond that permits the transfer of a 2-pN per integrin from the actin cytoskeleton to fibronectin, until the number of bonded talin molecules increases or a signal is received to activate a mechanical stress response. In the work reported here, we adapted the optical tweezers configuration to measure the integrated mechanical cellular response to external stress through a fibronectin-coated bead large enough to induce the formation of FAs when it attaches to a cell. Accordingly, we imposed on the bead a shearing force tangent to the surface of H4II-3EC (H4) rat hepatoma cells, and then measured in real time the photonic force acting on the bead at equilibrium with the cell reaction. In contrast to previous reports,14, 15, 16, 17 the results revealed that the fibronectin-coated bead attached to the cell surface and, trapped by the optical tweezers, not only played the role of force transducer for applying the photonic force from outside the cell, but also provided a force probe, with its equilibrium position measured by a quadrant photodetector giving the magnitude of the photonic force in the same order of magnitude of that of the cell mechanical reaction. We also showed that disruption of the different cytoskeletal networks resulted in differential alterations of the force distribution response. 2.Experimental Setup and Methods2.1.System SetupThe experimental set up consists of an optical tweezers in the inverted microscope configuration and a quadrant photodiode (QPD) able to measure the trapped bead position and the corresponding photonic force. As shown in Fig. 1, the trap is made around a linearly polarized 5W ND:YVO4 fiber laser (IPG Photonics) emitting at 1070 nm. The laser beam goes through a half wave plate followed by a polarization beam splitting Gland prism (Gp) in order to control the laser power by rotating the half wave plate orientation. The laser is steered by the gimbals mounted mirror M1 and hot mirror M2 and is coupled by mirror M3 to the back aperture of an Olympus 100× oil immersion objective of numerical aperture (NA) = 1.3. The laser light that is backscattered by a trapped bead is collected by the same objective and is sent by mirror M3 and beam sampler (BS) plate to the QPD (S5981 Hamamatsu) to monitor the bead position. The orientation of the QPD determines the x and y axes in the sample plane as shown in Fig. 1. The backscattering configuration,20 instead of forward scattering,8 has the advantage of having the same microscope lens NA for both detection and trapping. The disadvantage of the backscattering configuration is that the position of the bead cannot be measured when the trapping beam is absent. A fiber illuminator provides the white light that goes through a 20× aspheric lens with NA = 0.3 to illuminate the sample. A single lens L1 images the sample upon a CCD camera (Panasonic). Illumination light is eliminated from the detection path by a cold mirror filter in front of the QPD. The back-scattered laser beam is stopped by a hot-mirror filter in front of the CCD camera. The system is entirely contained in an environmental chamber maintaining a constant temperature of 37°C. Coarse positioning of the sample on the microscope stage is done by remotely controlled step motors (MellesGriot). Fine positioning is achieved with a piezoelectric positioning system (Tritor 102 cap, Jena) with nanometer resolution. 2.2.System CalibrationIn the position signal calibration, a 5 μm diameter bead fixed on a cover glass is scanned by the laser beam along the x and y axes by the piezoelectric positioning system to obtain the QPD signal as a function of the bead position. For instance the signal (v1 + v2) − (v3 + v4)/(v1 + v2 + v3 + v4), where vi is the output of ith quarter photodetector and is proportional to the bead position in y. The QPD signal was found linear to the bead displacement within the range of −1.5 to +1.5 μm from the bead center as shown in Fig. 2a. Fig. 2(a) QPD signal of a bead fixed on a glass cover slip during a scan along the y axis with the piezoelectric positioning system. (b) Bead displacement signal y(t) corresponding to the Brownian motion of the bead captured by the optical tweezers and suspended about 3 μm above the dish bottom in a DMEM of viscosity η = 8.4 × 10⁻⁴ Nsm−2. (c) Bead position histogram built from (b). (d) Measured data fit to harmonic potential E(y).  Stiffness calibration of the optical trap was achieved by thermal noise analysis as proposed by Florin.21 According to this procedure, the Brownian motion along a given axis of a trapped bead is tracked by the QPD to generate a position probability p(y) under Boltzmann statistics Eq. 1[TeX:] \documentclass[12pt]{minimal}\begin{document}\begin{equation} p\left(y \right)dy = C\exp \left[ {{{ - E\left(y \right)}/{k_B T}}} \right] \end{equation}\end{document}Eq. 2[TeX:] \documentclass[12pt]{minimal}\begin{document}\begin{equation} E\left(y \right) = - k_B T\ln p\left(y \right) + k_B T\ln C, \end{equation}\end{document}Eq. 3[TeX:] \documentclass[12pt]{minimal}\begin{document}\begin{equation} E\left(y \right) = {{k_y y^2 } / 2} + cte. \end{equation}\end{document}Experimentally, we trapped a 5-μm fibronectin-coated bead and maintained the bead by the optical trap within a cell culture dish about 3 μm above the dish bottom surface in a Dulbecco's modified eagle medium (DMEM) with viscosity η = 8.4 × 10⁻⁴ Nsm−2. We then measured the Brownian motion of the bead along the y direction to obtain the position in y as a function of time t, y(t), as shown in Fig. 2b. At a sampling rate of 80 kHz and in a 0.5 s recoding time, we obtained 40,000 data of y(t). From these data, we generate the histogram with the bin width of 2 nm, as shown in Fig. 2c, which corresponds to the probability density function p(y). The harmonic potential E(y) is computed by Eq. 2 from the position histogram in Fig. 2c and is fit to Eq. 3 as shown in Fig. 2d to determine the trapping constants k y = 53.8 ± 2.0 pN/μm. The same calibration was performed along the x axis and resulted in k x = 54.1 ± 2.4 pN/μm. The values of k x and k y depend on the orientation of the linear polarization of the trapping beam. A similar calibration was performed along the z axis and resulted in k z = 9 ± 4 pN/μm. As the position of the bead in z is measured by the signal (v1 + v2 + v3 + v4), which is not a differential signal, the signal for the position in z is easier to be biased by the noise. Notably, these trapping constants are comparable to those previously reported.21 The system calibration was performed without the cell in the dish before each set of comparative experiments to measure the forces of either untreated or treated cells in the cell culture dishes. 2.3.Cell Culture and Drug TreatmentH4 rat hepatoma cells were cultured in DMEM supplemented with 10% fetal bovine serum and maintained at 37°C in a humid CO2 (5%)/air (95%) atmosphere. In all experiments, cells were first seeded in a culture dish made of a thin glass bottom and precoated with fibronectin.13 This allowed formation of a full monolayer of the cells of 5 to 8 μm in thickness, as a result of cell interactions via their ventral surfaces with the fibronectin-culture substratum and their contacts with the neighboring cells. In the experiments, cells were untreated or pretreated for 60 min with cytochalasinD or 30 min with nocodazole at concentration in the sample dish of 2 and 30 μM, respectively. All of the drugs were diluted in dimethyl sulfoxide (DMSO), which serves as the delivery vehicle. The concentration of the DMSO used was at 0.1% in all treatments and in each control condition. At such a concentration, the DMSO will not affect the cell mechanics. 2.4.Bead Preparation and Focal Adhesion AssemblyFibronectin-coated beads were prepared in a 60-μl solution with a concentration of 100,000 beads/ml and were then added to the culture dish containing the cell monolayer 15 min prior to analysis. According to a previous report,18 bead size is critical for fibronectin-induced FA assembly on the dorsal cell surface. Fibronectin-coated beads that are smaller than 3 μm in diameter attach to fibroblast cells but do not lead to FA formation without external force. In fact, it appears that contraction of the cytoskeleton on either side of midsized beads (>3 μm) generates a force that causes the assembly of vinculin to form FAs, whereas smaller beads generate insufficient cytoskeleton force.18 On these grounds, our experiments were performed with 5-μm diameter beads. Of note, in a previous work we have shown that albumin-coated beads loosely attached to the cells22 resulting in lower cell's response forces, compared with that obtained in this paper using the fibronectin-coated beads for mechanical coupling on the H4 cells. Accordingly, the recruitment of vinculum and actin at the FAs by the attached beads was monitored by confocal imaging of the H4 cell monolayer. The H4 monolayer was first fixed by successive treatments for 10 min at 37°C with 2% formaldehyde and 5 min at −20°C with methanol (30%)/acetone (70%), and then incubated overnight with a mouse anti-human vinculum monoclonal primary antibody, followed by a one hour incubation with Alexa-647 coupled anti-mouse secondary antibody, and also with Alexa-594-coupled phalloidin to reveal fibrillar actin. Images were captured with an FV-1000 Olympus confocal microscope. Confocal images of the ventral cell surface in Figs. 3a and 3b show the actin and vinculin in FAs of the cells monolayer. The attached bead is visible in the phase-contrast image in Fig. 3c. The confocal images in Figs. 3d and 3e showed both the vinculin and actin fibers clustered underneath the bead and the attached dorsal cell surface. These clusters are representative of the FA assembly. Figure 3f shows a merged picture of Figs. 3d and 3f. The presence of the attached bead on the dorsal cell surface did not appear to perturb the vinculin and actin, which are representative of the cell monolayer, at the actual FA assembly on the ventral cell surface, as shown in Figs. 3a and 3b, where the region underneath the bead and the FAs in the neighboring cells without attached beads showed normal distributions. Fig. 3(a) and (b) Confocal image of the ventral cell surface showing actin and vinculin accumulation at focal adhesion of a cell with a bead and its neighboring cells. (c) Phase contrast image showing the bead position. (d) and (e) Confocal section forming the dorsal portion of the cells where actin and vinculin cluster underside the bead (bead position indicated by the dashed circle). Insets in (d) and (e) show a zoomed image around the position of the bead. (f) Merged image of Figs. 6d and 6e showing actin and vinculin on the dorsal side of the cells.  3.Experimental Results and Discussion3.1.Force MeasurementWe first localized the position of the laser beam focus in the x-y plane on the CCD camera monitor screen. We then selected a second position at a lateral distance of 1.3 ± 0.1 μm from the trap center along the y axis to serve as the initial position of the bead. A FA-attached bead was chosen at random and then set to the initial position by moving the culture dish with the coarse step motor stage followed by a finer adjustment through the piezo actuator. The bead initial position was within the linear region of the optical trap for a corresponding starting gradient force of kyy ≈ 70 pN. To take into account the variations of the cell thickness and the attached bead position in z, before each measurement we adjusted the position of the culture dish in z via the piezo actuator such that the bead was initially at the focal plane of the microscope objective. This adjusting was performed under white light illumination when the laser beam was obscured by the shutter. When we manually opened the shutter, activating the laser trap, the bead was subjected to a gradient force toward the laser beam focus and moved to a position where the optical trap force and the cellular force exerted on the bead were balanced. The bead displacement was monitored by the QPD following the three axes, as shown in Fig. 4. The QPD signal acquisition procedure started about 0.8 ± 0.4 s ahead of the shutter manual opening and continued for 20 s. For each sample dish, 40 independent measurements for 40 individual bead/cell bonds were performed. As previously mentioned, each set of experiments included one test for force calibration and the force measurements for 40 individual bead/cell bonds in three to four separated sample dishes of treated or untreated H4 cells. We did three such sets of experiments in different days and with different cultured cell samples. The results of the three sets of experiments showed similar cell behaviors, as next discussed. Fig. 4Bead attached on the cell through the integrin receptors transfers the photonic force to the cytoskeleton by way of FAs, which are composed of many proteins such as vinculin and talin.  In all of the tests, the beads remained in the region where the force was linearly proportional to its displacement. The 40 force traces obtained for the first set of H4 cells in one culture dish are depicted in Fig. 5. Before opening the shutter, there was no backscattered light and the QPD signal was at an arbitrary level. After opening the shutter, the bead was immediately captured by the laser beam and moved to an equilibrium position in z, where F z = 0, as clearly seen in each panel in Fig. 5. The jump of the bead in the z direction indicates the beginning of capturing of the bead and the beginning of all of the measurements. Six among 40 beads had F z slightly different from zero, due to the cell resistance to the laser beam diffusing force applied along the optical axis. In addition, we cannot exclude a nonplanar topography of the cell monolayer. The contribution of the nonzero F z to the total force was very small, as shown in Fig. 5, compared with the contributions from F x and F y, which are tangent to the cell surface. Fig. 5Force expression of 40 different probed cells over the course of 20 s. The total force is in light blue, the force component along the y axis is in green, along the x axis in dark blue, and along the z axis in red. Some samples exhibit discernable initial cellular response (*) and/or a time dependent modulation of the force (†).  Although the initial gradient force and the displacement of the bead were along the y axis, displacements of the bead in x and the corresponding force F x were different from zero for 35 of the 40 beads. Contribution of F x was important in 11 measurements and had a significant influence on the total force [TeX:] $F_{tot} = [ {F_x^2 + F_y^2 + F_z^2 }]^{{1 / 2}} $ . As a result, eight beads had a total force above 70 pN, as shown in the panels marked by “#” in Fig. 5. However, only two of those beads had a signal for F y greater than the starting gradient force of 70 pN. In this way, it appears that the measured total force results from a complex interaction involving the cytoskeleton networks with integrin-containing FAs. The integrated response is therefore related to the three-dimensional architecture of the cell structural elements, such as cytoskeleton networks and FAs. As shown in the panels marked by “*” in Fig. 5, a gradual displacement response was observed in half of the beads. The bead initially underwent a fast displacement toward the trap center and then its speed gradually slowed down until it reached an equilibrium state. On average, the beads took less than 3 s after opening the shutter to reach the equilibrium position. This type of response is similar to the viscoelastic-creep behavior observed by Bausch on fibronectin-coated beads attached to endothelial cells, subjected to a constant magnetic pulling force.23, 24 The other half of the measured beads did not present this kind of viscoelastic-creep response, the beads almost instantly reached an equilibrium state. While this is quite intriguing, there is no definitive explanation for the lack of such responses. We also observed a time-dependent evolution of the equilibrium force in the 21 panels in Fig. 5 marked by “†” out of 40. The modification of the equilibrium state reached in the initial cellular response starts about 5 s after the shutter opening. Matthews have observed a similar time-dependent change in the bead translocation attached to activated integrin on endothelial cells; in fact, they observed a similar proportion of repositioning mostly between 10 and 20 s after the application of a 130 pN force by magnetic needle.17 These authors associated this behavior with a cell response to a prolonged force application. Notably, in the data reported here, H4 cells started relocating earlier, perhaps because the photonics force in the order of 70 pN is lower than 130 pN, so that the cells can more easily move against the photonics force. Additionally, in some measurements the noise level is quit high, as can be seen in six panels out of 40 in Fig. 5, but whether this reflects variations in intracellular activities remains as an open question. 3.2.Distributions of the Force in Treated Cells versus Nontreated CellsAs the cell response to external force showed dynamic behavior, we selected the force expression in a timeframe of 4.5 to 5.5 s as the initial cellular mechanical response. This time window was primarily chosen to be between the initial cellular response observed before 3 s and the cell adaptation response, which modulated the equilibrium state after 5 s. The distribution of the initial cellular response over the 40 independent measurements is a function of the cellular conditions. In the untreated H4 cells, the mean value of the force is of 54.4 ± 22.9 pN, as shown in Fig. 6a, where we assumed that the measured force distribution over the samples is a Gaussian distribution. Table 1 provides the mean values and standard deviations of the force for the 4.5 to 5.5 s timeframe obtained in the three different sets of measurements for untreated H4 cells and the H4 cells treated with cytochalasinD, Nocodazole and shK8, respectively. The three different sets of sample dishes were separately prepared on different days. Fig. 6Force distribution obtained of 40 probed cells in the 4.5 to 5.5 s timeframe for (a) untreated cells; (e) cytochalasin D-treated cell; (f) nocodazole-treated cells; (g) keratin-lacking cells. (b), (c), and (d) The corresponding force traces over 20 s for the treated cells.  Table 1Mean forces obtained for each data set in the 4.5 to 5.5 s timeframe.
We then assessed the contributions of three cytoskeletal networks to the initial cellular response to external mechanical stress. This was accomplished by disrupting the cytoskeleton networks of the H4 cells. Actin-microfilaments in H4 cells were treated by a 60-min incubation with 2 μM cytochalasin D so that the fiber-like structures under the bead were no longer present. In the same way, a 30-min nocodazole treatment at 33 μM was used to destabilize the microtubule network. For the keratin intermediate filaments, a keratin-lacking H4 cell clone was used.13 The fibronectin precoated beads were added 15 min before the end of the treatment to the cells. The optical tweezers experimental procedure used with the untreated H4 cells was then applied. The cellular response was monitored during 20 s for 40 independent measurements in each case and we still selected the 4.5 to 5.5 s timeframe for the initial cellular responses as that for the untreated cells. According to our observation, the treated cells showed a fast initial response before 3 s. The cells H4+CytoD and H4+Noco showed no translocation after the initial equilibrium state, while active translocation could be observed in cells H4+shK8, as shown in Figs. 6b, 6c, 6d. Disruption of the actin-microfilaments resulted in a loss of cell force expression evaluated by the initial equilibrium state. Quantitatively, the mean force during the 4.5 to 5.5 s timeframe dropped by more than two-fold, i.e., at 24.6 ± 12.6 pN (see Table 1 for additional data set values), as shown in Fig. 6e. This result is in line with previous reports suggesting that actin-microfilaments directly interact, via vinculin and talin, with FAs and constitute a key mediator of mechanical load in the cell.18, 19 The destabilization of the microtubule network reduced the mean force to 38.7 ± 17.2 pN (see Table 1 for additional data set values), as shown in Fig. 6f, implying that microtubules contribute less than actin-microfilaments to the cellular response. Work by others has shown that the spatial organization of the actin cytoskeleton networks is significantly different in adherent cells that are forced to remain in suspension,25 which is in line with our previous data using H4 cells maintained in suspension versus seeded on the fibronectin substratum.13 Remarkably, the loss of the keratin intermediate filaments led to an opposite modulation of the contribution. Indeed, the mean value was 67.1 ± 19.1 pN as shown in Fig. 6g (see Table 1 for additional values). In many cell types, the loss of intermediate filaments resulted in small augmentation of cell malleability as predicted by mechanical models.5 From the present data, it appears that the loss of keratin intermediate filaments result in decreased FA malleability at the surface membrane. In this context, the keratin intermediate filaments contribution to the pulling tension generated at FAs is not necessarily linked to their viscoelasticity per se, but rather to their ability to mediate overall key cytoplasmic sensing and transmission of the mechanical signal initiated at FAs. This highlights the potential importance of intermediate filaments in the integrated cell response to mechanical stress. In addition, the forces were also evaluated for the timeframe in 14.5 to 15.5 s. Table 2 provides the mean values and standard deviations of the forces for the data sets at 14.5 to 15.5 s timeframe. The mean value of the force in the latter time frame shows a slight decrease over time for the untreated H4 cells, 46.7 pN at 14.5 to 15.5 s versus 52.3 pN at 4.5 to 5.5 s. This decrease is representative of the creep response described in the literature.23, 24 The small force variation over time in both H4+CytoD and H4+Noco cells was also observed, as shown in Table 2. The mean values of the force at 14.5 to 15.5 s are relatively close to that at 4.5 to 5.5 s timeframe. In these cases, the decreasing optical force toward the center of the trap will limit the viscous deformation of the treated cells over time. In addition, both the actin-microfilament and the microtubule network are known to be actively involved in the cell active response to mechanical cues.1, 3, 17, 26 In H4+shK8 cells, the force evaluated for the timeframe between 14.5 to 15.5 s yielded a value of 60.2 pN showing a decrease from that measured in the earlier timeframe and a creep effect similar to what is observed in untreated H4 cells. Table 2Mean forces obtained for each data set in the 14.5 to 15.5 s timeframe.
Of note, there is a distinct possibility that the presence of the cells can perturb the laser wavefront, thus affecting the accuracy of the measured values of the force based on the calibration. However, the present work is based on the comparative measurements of four types of untreated and treated cells within the same controlled optical tweezers conditions. This comparison is independently established of the absolute values of the measured forces. 4.ConclusionA customized optical tweezers were used to assess the force response of the 40 individual cell-bead bonds. This experimental configuration allowed us to view a time-dependent modulation of the force equilibrium in H4 cells, a typical mammalian epithelial cell type, and to perform direct measurements of the cell response to mechanical stress applied at FAs. The initial cell response was measured in the 4.5 to 5.5 s timeframe, and of note, the mean of the resulting force distribution was 54.4 pN for a specific initial optical gradient force of 70 pN over a cell monolayer. A disruption of actin-microfilaments and microtubules led to 50 and 30% reductions in the initial cellular response forces, respectively, whereas a loss of keratin intermediate filaments yielded a 25% increase. In this way, we were able to resolve the differential contributions of actin-microfilaments, microtubules, and keratin intermediate filaments at FAs. Eventually, one will be able to measure the impact of key cytoskeleton-dependent cellular activities on the integrated mechanical cell response. AcknowledgmentsThis work was supported by Natural Sciences and Engineering Research Council (NSERC) of Canada. We thank Luc Galarneau for the generation of the keratin-lacking H4 cell clone and Anne Loranger for experimental advice and stimulating discussion. ReferencesD. E. Ingber,
“Cellular mechanotransduction: putting all the pieces together again,”
FASEB J., 20 811
–827
(2006). https://doi.org/10.1096/fj.05-5424rev Google Scholar
D. E. Ingber and
J. Folkman,
“Mechanochemical switching between growth and differentiation during fibroblast growth factor-stimulated angiogenesis in vitro: role of extracellular matrix,”
J. Cell. Biol., 109 317
–330
(1989). https://doi.org/10.1083/jcb.109.1.317 Google Scholar
K. A. Moore, T. Polte, S. Huang, B. Shi, E. Alsberg, M. E. Sunday, and
D. E. Ingber,
“Control of basement membrane remodeling and epithelial branching morphogenesis in embryonic lung by Rho and cytoskeletal tension,”
Dev. Dyn., 232 268
–281
(2005). https://doi.org/10.1002/dvdy.20237 Google Scholar
K. K. Parker, A. L. Brock, C. Brangwynne, R. J. Mannix, N. Wang, E. Ostuni, N. A. Geisse, J. C. Adams, G. M. Whitesides, and
D. E. Ingber,
“Directional control of lamellipodia extension by constraining cell shape and orienting cell tractional forces,”
FASEB J., 16 1195
–1204
(2002). https://doi.org/10.1096/fj.02-0038com Google Scholar
L. Kreplak, and
D. Fudge,
“Biomechanical properties of intermediate filaments: from tissues to single filaments and back,”
BioEssays, 29 26
–35
(2007). https://doi.org/10.1002/bies.20514 Google Scholar
P. B. Bareil, Y. Sheng, Y. Q. Chen, and
A. Chiou,
“Calculation of spherical red blood cell deformation in a dual-beam optical stretcher,”
Opt. Express, 15 16029
–16034
(2007). https://doi.org/10.1364/OE.15.016029 Google Scholar
J. Guck, R. Ananthakrishnan, H. Mahmood, T. J. Moon, C. C. Cunningham, and
J. Kas,
“The optical stretcher: a novel laser tool to micromanipulate cells,”
Biophys. J., 81 767
–784
(2001). https://doi.org/10.1016/S0006-3495(01)75740-2 Google Scholar
S. L. Liu, A. Karmenyan, M. T. Wei, C. C. Huang, C. H. Lin, and
A. Chiou,
“Optical forced oscillation for the study of lectin-glycoprotein interaction at the cellular membrane of a Chinese hamster ovary cell,”
Opt. Express, 15 2713
–2723
(2007). https://doi.org/10.1364/OE.15.002713 Google Scholar
E. Zamir and
B. Geiger,
“Molecular complexity and dynamics of cell-matrix adhesions,”
J. Cell. Sci., 114 3583
–3590
(2001). Google Scholar
D. E. Ingber,
“Tensegrity: the architectural basis of cellular mechanotransduction,”
Annu. Rev. Physiol., 59 575
–599
(1997). https://doi.org/10.1146/annurev.physiol.59.1.575 Google Scholar
D. Choquet, D. P. Felsenfeld, and
M. P. Sheetz,
“Extracellular matrix rigidity causes strengthening of integrin-cytoskeleton linkages,”
Cell, 88 39
–48
(1997). https://doi.org/10.1016/S0092-8674(00)81856-5 Google Scholar
P. A. Coulombe and
M. B. Omary,
“‘Hard’ and ‘soft’ principles defining the structure, function and regulation of keratin intermediate filaments,”
Curr. Opin. Cell Biol., 14 110
–122
(2002). https://doi.org/10.1016/S0955-0674(01)00301-5 Google Scholar
L. Galarneau, A. Loranger, S. Gilbert, and
N. Marceau,
“Keratins modulate hepatic cell adhesion, size and G1/S transition,”
Exp. Cell Res., 313 179
–194
(2007). https://doi.org/10.1016/j.yexcr.2006.10.007 Google Scholar
A. Rohrbach, H. Kress, and
E. H. Stelzer,
“Three-dimensional tracking of small spheres in focused laser beams: influence of the detection angular aperture,”
Opt. Lett., 28 411
–413
(2003). https://doi.org/10.1364/OL.28.000411 Google Scholar
Y. Wang, E. L. Botvinick, Y. Zhao, M. W. Berns, S. Usami, R. Y. Tsien, and
S. Chien,
“Visualizing the mechanical activation of Src,”
Nature, 434 1040
–1045
(2005). https://doi.org/10.1038/nature03469 Google Scholar
Z. Sun, L. A. Martinez-Lemus, A. Trache, J. P. Trzeciakowski, G. E. Davis, U. Pohl, and
G. A. Meininger,
“Mechanical properties of the interaction between fibronectin and alpha5beta1-integrin on vascular smooth muscle cells studied using atomic force microscopy,”
Am. J. Physiol. Heart Circ. Physiol., 289 H2526
–H2535
(2005). https://doi.org/10.1152/ajpheart.00658.2004 Google Scholar
B. D. Matthews, D. R. Overby, R. Mannix, and
D. E. Ingber,
“Cellular adaptation to mechanical stress: role of integrins, Rho, cytoskeletal tension and mechanosensitive ion channels,”
J. Cell Sci., 119 508
–518
(2006). https://doi.org/10.1242/jcs.02760 Google Scholar
C. G. Galbraith, K. M. Yamada, and
M. P. Sheetz,
“The relationship between force and focal complex development,”
J. Cell Biol., 159 695
–705
(2002). https://doi.org/10.1083/jcb.200204153 Google Scholar
G. Jiang, G. Giannone, D. R. Critchley, E. Fukumoto, and
M. P. Sheetz,
“Two-piconewton slip bond between fibronectin and the cytoskeleton depends on talin,”
Nature, 424 334
–337
(2003). https://doi.org/10.1038/nature01805 Google Scholar
J. H. G. Huisstede, K. O. van der Werf, M. L. Bennink, and
V. Subramaniam,
“Force detection in optical tweezers using backscattered light,”
Opt. Express, 13 1113
–1123
(2005). https://doi.org/10.1364/OPEX.13.001113 Google Scholar
A. Pralle, E.-L. Florin, E. H. K. Stelzer, and
J. K. H. Hörber,
“Photonic force microscope calibration by thermal noise analysis,”
Appl. Phys. A: Mater. Sci. Process., 66 S75
–S78
(1998). https://doi.org/10.1007/s003390051103 Google Scholar
F. Bordeleau, J. Bessard, Y. Sheng, and
N. Marceau,
“Photonic force microscopy of local tension at cell surface focal adhesions,”
Proc. SPIE, 6343 63430A
(2006). https://doi.org/10.1117/12.706573 Google Scholar
A. R. Bausch, W. Moller, and
E. Sackmann,
“Measurement of local viscoelasticity and forces in living cells by magnetic tweezers,”
Biophys. J., 76 573
–579
(1999). https://doi.org/10.1016/S0006-3495(99)77225-5 Google Scholar
A. R. Bausch, U. Hellerer, M. Essler, M. Aepfelbacher, and
E. Sackmann,
“Rapid stiffening of integrin receptor-actin linkages in endothelial cells stimulated with thrombin: a magnetic bead microrheology study,”
Biophys. J., 80 2649
–2657
(2001). https://doi.org/10.1016/S0006-3495(01)76234-0 Google Scholar
J. Guck, S. Schinkinger, B. Lincoln, F. Wottawah, S. Ebert, M. Romeyke, D. Lenz, H. M. Erickson, R. Ananthakrishnan, D. Mitchell, J. Kas, S. Ulvick, and
C. Bilby,
“Optical deformability as an inherent cell marker for testing malignant transformation and metastatic competence,”
Biophys. J., 88 3689
–3698
(2005). https://doi.org/10.1529/biophysj.104.045476 Google Scholar
A. A. Birukova, K. Smurova, K. G. Birukov, P. Usatyuk, F. Liu, K. Kaibuchi, A. Ricks-Cord, V. Natarajan, I. Alieva, J. G. Garcia, and
A. D. Verin,
“Microtubule disassembly induces cytoskeletal remodeling and lung vascular barrier dysfunction: role of Rho-dependent mechanisms,”
J. Cell. Physiol., 201 55
–70
(2004). https://doi.org/10.1002/jcp.20055 Google Scholar
|
||||||||||||||||||||||||||||||||||||||||||||||||||||||||||||||||||||||||||||||||||||||||||||||||