
|
|
1.IntroductionIn vivo analysis of cardiac physiology and noninvasive imaging of the beating early embryonic heart remain a challenge in cardiovascular development research. Due to its imaging qualities with approximately 5 μm resolution and a maximum penetration depth of around 2 mm in soft tissue,1 optical coherence tomography (OCT) has gained remarkable importance in this field. OCT systems have been used for real-time two-dimensional (2D) video recording of the beating embryonic heart.2, 3, 4, 5 For acquisition of three-dimensional (3D) data sets over time [referred to as four-dimensonal (4D)], it is essential to use gating technologies to minimize motion artifacts. It has been shown that in vivo gating is possible in avian embryonic hearts by using a laser Doppler velocimetry signal.6 More recently, retrospective gating technologies were deployed.7, 8, 9, 10 In these studies, a time series of 2D images at several positions along the heart volume was used to produce a time sequence of 3D volumes of the beating heart. Rearrangement and validation of the asynchronously acquired input data were based on image similarity of adjacent pictures and a perpendicularly recorded B-scan or a repetitive low-resolution 3D volume scan. These techniques allow detection of artifacts due to movements of the embryo or the yolk only after completion of image acquisition, as the described experimental setup did not aim for recognition of movements during recordings. In our study, we introduce a novel technique that uses a rotational scan mode of a swept-source OCT system for imaging the beating embryonic chick heart (Fig. 1). The central A-scan is identical with the rotational axis. Thus, the heart phase can be synchronized in every rotated image plane using the phase information of the central A-scan. A rotation of the image plane of 180° allows the creation of a complete 4D dataset of the beating embryonic heart. Additionally, continuous monitoring of the M-mode of the central A-scan and comparison to a reference M-mode recorded at the beginning of the scan provides immediate information about translational movements of the embryo. 2.Experimental Methods2.1.Embryo PreparationFertilized chicken eggs (Lohmann Tierzucht GmbH, Cuxhaven, Germany) were incubated at 38.0 °C in a still air incubator (Siepmann, Herdecke, Germany). After designated time periods of incubation, intact chick egg contents were transferred to hexagonal polystyrene weighing boats and checked for correct staging according to Hamburger and Hamilton (HH).11 Chick embryos at HH-stage 16 were removed from the egg with vitelline vessels and membranes in an ex ovo culture to a weighing boat with a bottom of black wax covered with Locke solution. Temperature stability was provided by a closed loop temperature control using a heating plate with a sensor below the weighing boat. The embryo in ex ovo culture was fixed to the wax with needles without harming the embryo. Egg remnants, chorion membrane, and pericardium were removed. To reduce desiccation and loss of temperature, the temperature-controlled workstation was covered with a lid with a small hole above the heart (7-mm diameter) for imaging with the OCT system [see Fig. 2a]. Fig. 2(a) Set-up of the OCT probe with the temperature-controlled workstation. The embryo is kept at approximately 37 °C. Desiccation is minimized by a lid with a small hole through which OCT image acquisition is performed. (b) Screenshot of the program used for OCT image acquisition. The live M-mode is displayed in the top left corner, with the reference M-mode displayed directly next to it in the top right corner. The controls window is located in the bottom right corner, and a live video monitor (active during set-up) is displayed in the bottom left corner. 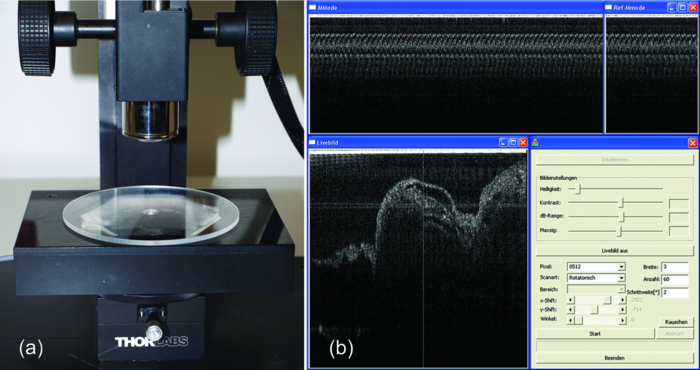 2.2.Image AcquisitionFor the acquisition of 4D data sets, a Thorlabs OCS1300SS Swept Source OCT system with 1325 nm center wavelength and a maximum speed of 25 cross-sectional images (B-scans)/s (512 px width; 512 px depth) was employed. The axial resolution was 9 μm (in tissue), and the transverse resolution was 25 μm. The Thorlabs software development kit for the OCT system offers direct access to the deflection mirrors and enables one to record B-scans with a frame rate of 21 images/s. We developed an OCT imaging recording software in C++, enabling the rotation of the recording plane around a central common A-scan [screenshot is shown in Fig. 2b]. The number of frames to be recorded at each angle and the step between two angles can be chosen in the software. A video sequence of B-scans covering several heartbeats (50 B-scans) was recorded for every angle. The central A-scan was continuously recorded and displayed as M-mode to be visually compared by the user to a reference M-mode recorded at the beginning of the experiment. We verified the ability of this approach to detect translational motion as small as 15 μm by shifting the embryo with a piezoelectric actor in which a clearly recognizable change in the recorded M-mode was visible. 2.3.Image AnalysisThe recorded B-scan video sequences are used for retrospective gating. Therefore, three image analysis steps are carried out, which include estimation of the cardiac cycle period and normalization, assignment of phases, and calculation and visualization of 3D and 4D datasets. 2.3.1.Estimation of the cardiac cycle period and normalizationTo estimate the cardiac cycle period from the sequentially recorded series of B-scans per angle, a period estimation technique derived from string length minimization (SLM) by Stellingwerf12 and Dworetsky13 was applied. For the presented example, a total of 50 B-scans in 2.4 s were acquired per angle. With a given heart rate of approximately 135 beats/min, this leads to a total of around 5.4 recorded heartbeats with 9.3 images/heartbeat. These small numbers of data points will lead to poor results if fast Fourier transformation or autocorrelation techniques are used, whereas the SLM algorithm has proven to deliver satisfactory results with respect to the accuracy of period determination.10 Figure 3 illustrates the method for heart rate estimation using the SLM algorithm. The acquired data over time is split into pieces presumably representing one heartbeat. If the correct period is found, the spread or string length of the sample data will feature a minimum. A one-dimensional example of a periodic signal over time, which is equivalent to a time series of B-scans, is shown in Fig. 3a. This signal is split into pieces with time length T ′ [Fig. 3b], and combined in one single period using the floor operator ⌊ ⌋, only the phase information τ n remains according to τn = t n − ⌊t n/T′⌋T′, where t n are the n timestamps in a video sequence. The closer this candidate period T ′ resembles the true period T representing one heartbeat, the shorter is the string length and the smoother the curve gets. This is shown in Fig. 3c, where the candidate period is not reflecting the true period of a heartbeat, and in Fig. 3d, where the string length is approaching the global minimum, respectively. SLM is suitable for nonconstant sampled data, and achievable accuracy is not restricted to sampling rate such as in autocorrelation techniques. Fig. 3Illustration of the cardiac cycle period estimation process. Video frames from an image sequence are split into pieces with time length T ′. The similarity of the sequential images is comparable to the distance measure in SLM, which is used to evaluate the heart rate using an optimization approach (details given in the text). 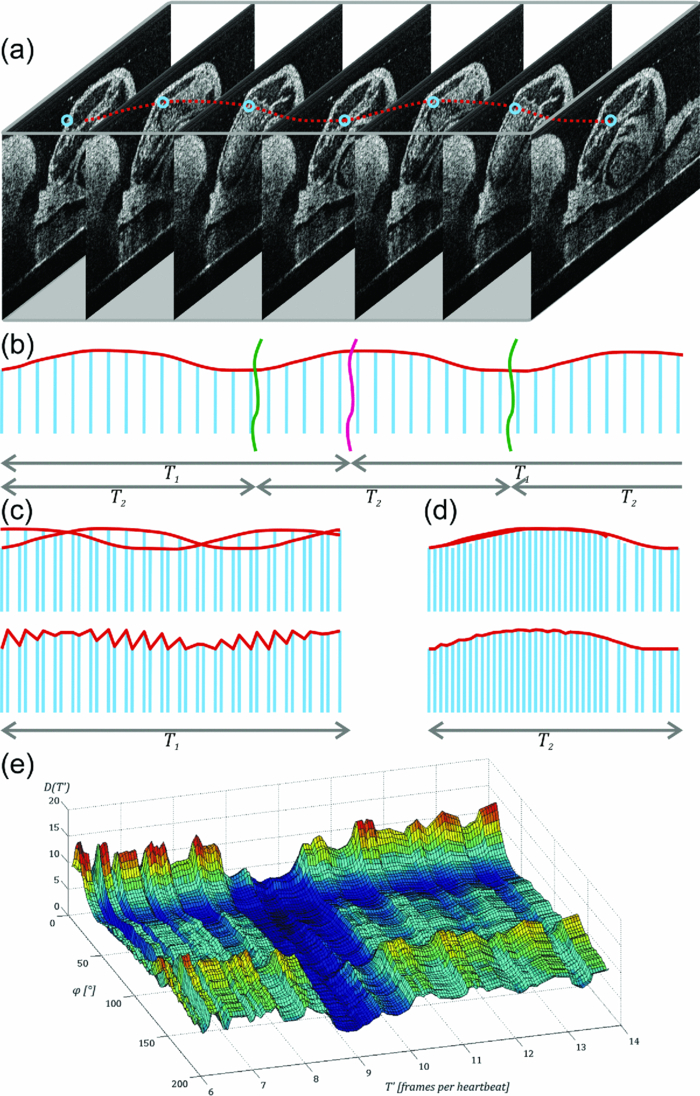 Whereas SLM essentially was used with curves where string length is clearly defined, in a periodic image sequence, a correspondence to string length has to be found describing the similarity of sequential images. One way is to derive a single parameter from the image such as image moments to get a periodic one-dimensional signal to allow the use of SLM in the original way.14 To omit the need for a derived parameter, we use a similarity measure describing the match of two sequential frames weighted with the time lag of the frames. In our datasets, the correlation between two time neighbors was identified to deliver a more significant minimum in string length compared to the commonly used sum of squared intensity differences (data not shown). The string length of a period T ′ equals the sum of the similarity measure over all frames, denominated as D, and given by
[TeX:]
\documentclass[12pt]{minimal}\begin{document}\begin{equation*}
D = \sum\limits_{n = 2}^N {\sqrt {\left\{ {1 - R[B(\tau _n),B(\tau _{n - 1})]} \right\}^2 + k(\tau _n - \tau _{n - 1})^2 } }.
\end{equation*}\end{document}
The image B(τ) reflects the two-dimensional distribution gray scale values within a B-scan. R denominates a two-dimensional correlation coefficient calculated with corr2 function in MATLAB
®, k is a scaling factor to weight proximity of time and image similarity. D is evaluated over all N frames of a video sequence of the same angle that are assembled with respect to the candidate T
′ in one period.SLM proceeds in the following steps: First, a candidate length T′ ∈ [T min , T max ] is selected. T ′ prescribes the splitting intervals for the image sequence resulting in new timestamps or phase information τ n within the interval [0,T ′]. Then, the images are sorted in ascending order with respect to τ n, and the string length parameter D(T ′) is evaluated over the N samples. D(T′) is calculated for every period length T ′, and the true period length T is then given by min[D(T ′)]. Figure 3e shows the optimization criteria of SLM for heart rate estimation plotted with respect to angle φ, and between T min and T max. The minima representing the true number of recorded frames/heartbeats are clearly visible (dark blue groove). The minimum for each angle φ is evaluated using a brute force discretization optimization approach. For every angle φ, a slightly varying T is calculated due to small variations of the heart rate. Therefore, a normalization of T is performed. T is assumed to be constant during one angle φ. For every angle φ, the period T is converted to a common reference length by linear expansion or reduction of the timestamps. Output of this part of the analysis is a normalized time-sorted sequence of B-scans, in which the subsequent sampling intervals are diverse and strongly related to the ratio of recording speed and actual heart rate. 2.3.2.Assignment of phasesThe stepwise change of the rotation angle φ leads to an unknown phasing in each recorded sequence conditioned by the time needed to realign the mirrors of the OCT scanner. In contrast to common cross correlation techniques where the B-scans must be interpolated to achieve an evenly spaced sampling rate, we again use the method of SLM. By use of the SLM algorithm, we avoid any additional errors caused by interpolation. Whereas in cardiac cycle period estimation, the similarity of the B-scan was used as a measure for SLM, hence, the similarity of the common central A-scan is used to compare a reference and the various sequences shifted in time by a candidate phase s ′. The parameter s ′ that shifts the sequence sufficiently to find the maximum similarity to the reference is found by the optimization algorithm to correct the sequences′ timestamps [TeX:] $\tau^{\prime}_{n} = \tau _n - s^{\prime} $ . Figure 4a depicts a part of the reference central A-scan that is being compared with a phase-shifted candidate shown in Fig. 4b. The analogy to a corresponding string is represented in Figs. 4e, 4f, respectively. Every A-scan in the reference, as well as in the candidate sequence, has T samples with individual timestamps. The assembly of both sequences takes place by sorting the timestamps in ascending order, thereby the resulting sequence of A-scans consists of 2N samples covering one cardiac cycle. Fig. 4Illustration of the phase assignment process. The phase is determined by the SLM optimization approach comparing the sequence of A-scans shifted by a candidate phase s ′ with a reference A-scan (details given in the text).  With a poor chosen time shift, the sequences will not fit well as displayed in Fig. 4c, and the corresponding analogy to the string model is shown in Fig. 4g. Every A-scan from the reference sequence is followed by an A-scan from the candidate sequence. Within the length of 2N samples in each step, a difference of the consecutive A-scan results. The sum of these differences is characterized by the given correlation:
[TeX:]
\documentclass[12pt]{minimal}\begin{document}\begin{equation*}
D = \sum\limits_{n = 2}^{2N} {\sqrt {\left\{ {1 - R[A(\tau _n),A(\tau _{n - 1})]} \right\}^2 + k(\tau _n - \tau _{n - 1})^2 } }.
\end{equation*}\end{document}
Here, A(τ) represents a central A-scan as a line of gray scale values, either from the reference or candidate sequence, which are intermixed with respect to s
′. By phase shifting the candidate by s
′, a global minimum for phase matching can be found, resulting in a well fitted sequence of A-scans [displayed in Fig. 4d; analogy to the string model is shown in Fig. 4h].The main difference in the heart rate estimation process is that only one vertical line representing the common A-scan is used instead of the whole B-scan. Therefore, the correlation coefficient R(·) is nearly mathematically identical to heart rate evaluation, but instead of calculating the correlation measure two-dimensionally using horizontal image coordinate u and vertical image coordinate z terms are summed up only in the z direction at the image center u = 256. Finding the phase shift that provides a minimal string length of the common data gives the best phase fit of the candidate. 2.3.3.Calculation and visualization of 3D and 4D datasetsAs a result of the presented frequency and phase alignment, a set of 90 video sequences with the same number of frames (20/video) covering one heartbeat each at different angle positions is calculated. Pixel coordinates u and z in each frame of angle φ correspond to r, z, and φ in cylindrical coordinates. The radius r is calculated as the distance from the rotation center to the coordinate u in the recoded video. To convert the cylindrical coordinates r, φ, and z in a Cartesian representation, the intensity at the target voxel x, y, and z is calculated using a linear interpolation scheme. In this way, for every time step of the cardiac cycle, a volume dataset consisting of 512 horizontal images is calculated and stored in DICOM file format. The dataset containing the 4D information is visualized using OsiriX ( http://www.osirix-viewer.com/). Adding transparency by adjusting the color-look up-tables before volume rendering enables the visualization of different aspects of the beating heart. All video files were edited in Final Cut Pro (Apple Inc.). 2.3.4.ValidationFor validation purposes, we recorded B-scan sequences at four positions different from any of the recording planes used during the 4D scan before and after the rotational scan was recorded. Figure 5a shows the recording positions of the additional B-scan sequences. B-mode series are extracted at equivalent positions from the resulting reconstructed 4D dataset and subsequently compared to the original B-scans. Heart rate and phase of the original B-scan recordings are adapted by the techniques described in Secs. 2.3.1, 2.3.2. The resulting sequences are compared using a 2D correlation measure averaged over all frames. Aside from errors during time and phase normalization of the additional B-scans, the resulting similarity measure reflects the accuracy of the reconstructed 4D data set. A mean correlation coefficient of 83% to 89% of the 8 control scans indicates that the 4D reconstruction reflects the true spatial-temporal data very well (average ± standard deviation: 86.7 ± 1.95). Figures 5b, 5c show the comparison of two B-scan sequences (see also 1 and 2). 10.1117/1.3622491.110.1117/1.3622491.23.ResultsWe visualized an HH-stage 16 embryonic chick heart with a heart rate of 135/min in 4D by a rotationally acquired OCT dataset. The result is shown as a “flythrough” video in the multimedia files (Fig. 6 and 3). To achieve a temporal resolution of approximately 22 ms, we chose to calculate 20 time steps for a cardiac cycle. For each of the 20 time steps, a 3D data set was calculated that contains 90 phase assigned images. During the recording procedure, no translational motion artifacts of the sample were recognized. A comparison of original B-scans with calculated B-scans derived from the final 4D data set shows a reasonable concordance, confirmed by a 2D correlation measure (Fig. 5). Fig. 5Validation of resulting 4D data set. (a) Of the 4D volume dataset, different B-scan sequences are extracted from positions not crossing the rotation center. These are compared to separately recorded B-scan sequences from before and after the rotational recording process (positions marked by the red lines; dashed lines indicate that corresponding images are not shown). (b) A still image of the 4D reconstruction compared to a still image of the sequence recorded at position b after the 4D scan was completed (see also 1, QuickTime, 4.89 MB).  Fig. 6Still image of a “flythrough” video through a rotationally acquired 4D OCT dataset of the beating heart of a HH-stage 16 chick embryo (see also 3, QuickTime, 15.5 MB). 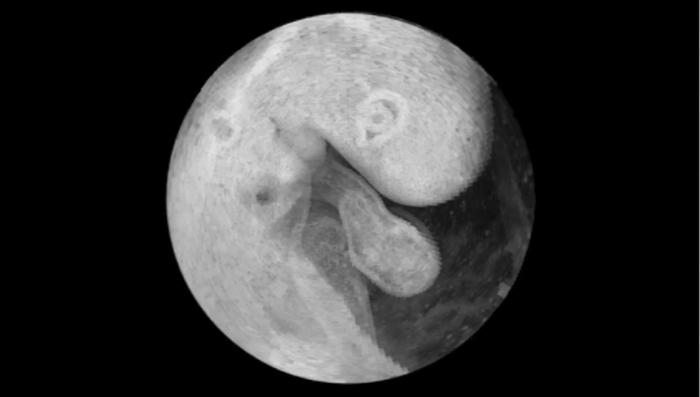 (c) The respective still images from position c (see also 2, QuickTime, 4.95 MB). Due to the rotational scan mode, the spatial resolution decreases from the middle to the outer boundary of the recording area. The spatial voxel size in the Cartesian target volume to be calculated from a pixel in cylindrical coordinate representation achieves 6 μm × 6 μm × 6 μm at a distance of 0.34 mm from the rotation axis, and increases to a voxel size of 15.7 μm × 6 μm × 6 μm at a distance of approximately 0.9 mm from the rotation axis (boundary of the heart). 4.DiscussionIn the recent past, different working groups aimed for 4D OCT studies of the beating embryonic avian heart.6, 7, 8, 10 In all of these studies, a translational scanning mode was used, meaning that a time series of 2D images at several positions along the heart volume was used to produce a time sequence of 3D volumes. Whenever retrospective gating is used, the phase information of every image has to be determined by comparison to a perpendicular B-scan6, 7, 8 or to overlapping adjacent B-scans.10 Thus, translational movements of the embryo during recording can hardly be recognized. Here, we present an alternative method for the generation of 4D OCT data of the beating embryonic chick heart by the rotational acquisition of the images. Because the rotational axis is identical with the central A-scan in all images, the phase information of any image can be directly determined. Additionally, comparison of a reference M-mode from the central A-scan, recorded before the actual 4D-scan starts, to the actual M-mode allows visual recognition of translational movements of the embryo during data acquisition. During the image analysis process, we use a string length minimization method for assignment of phases. After the period determination step, the subsequent sampling intervals of the consecutive B-scans are diverse. To apply a cross-correlation technique for the comparison of two A-scans series, other groups resampled the data to a fixed step size using a linear10 or a cubic7 spline interpolation, respectively. Any interpolation discards parts of the information embedded in the data sets. Thus, the accuracy of the subsequent analysis is coupled to the step size of the interpolation. Using the string length minimization on a combined set of A-scans (as done in Sec. 2.3.2) omits the need for interpolation. We are aware that the rotational scan mode results in the smallest voxel size being at the rotational axis, and that it increases towards the outer border. The achievable voxel size at the outer part of the embryonic chick heart is in our case 15.7 μm × 6 μm × 6 μm, which still lies within the optical resolution of the OCT system, and compares well to other groups (9 μm spacing between translational scans;7 12.5 μm spacing between translational scans).10 5.OutlookMaintaining physiological conditions for the embryo during OCT scanning is essential for exact measurements of cardiodynamics and reproducible results. Previous studies acknowledge this by using different warming devices but fail to prevent a drop in heart rate.7, 10 We have studied our HH-stage 16 embryos at heart rates of around 135/min outside of an incubator by using a specifically designed temperature-controlled workstation, which was covered with a lid having a small hole above the heart. However, this is still not an optimal experimental set-up for such functional studies. We are aware of this fact and propose for studies of cardiodynamics to stabilize temperature and humidity by using an examination incubator, where the OCT probe is integrated into an incubator. We realized that a decrease in heart rate is changing the proportions of the different phases during the cardiac cycle (data not shown). This might lead to errors during normalization of the heart rate during data analysis. By use of an examination incubator, those errors will be minimized. AcknowledgmentsThe authors acknowledge support by research grants from German Research Foundation (DFG; YE 42/3-1) and German Foundation for Cardiac Research (DSHF; F/19/07) to Professor Dr. Med. T. M. Yelbuz, and from the German Research Foundation (DFG; HE 2445/22-1) to Professor Dr.-Ing. B. Heimann, internal funding from the Department of Pediatric Cardiology and Intensive Care Medicine at Hannover Medical School, and internal funding from the Institute of Mechatronic Systems, imes at the Leibniz University of Hannover. ReferencesW. Drexler and
J. Fujimoto,
“Optical coherence tomography,”
(2008) Google Scholar
S. A. Boppart, G. J. Tearney, B. E. Bouma, J. F. Southern, M. E. Brezinski, and
J. G. Fujimoto,
“Noninvasive assessment of the developing Xenopus cardiovascular system using optical coherence tomo-graphy,”
Proc. Natl. Acad. Sci. U. S. A., 94
(9), 4256
–4261
(1997). https://doi.org/10.1073/pnas.94.9.4256 Google Scholar
J. Männer, L. Thrane, K. Norozi, and
T. M. Yelbuz,
“High-resolution in vivo imaging of the cross-sectional deformations of contracting embryonic heart loops using optical coherence tomography,”
Dev. Dyn., 237
(4), 953
–961
(2008). https://doi.org/10.1002/dvdy.21483 Google Scholar
J. Männer, L. Thrane, K. Norozi, and
T. M. Yelbuz,
“In vivo imaging of the cyclic changes in cross-sectional shape of the ventricular segment of pulsating embryonic chick hearts at stages 14 to 17: a contribution to the understanding of the ontogenesis of cardiac pumping function,”
Dev. Dyn., 238
(12), 3273
–3284
(2009). https://doi.org/10.1002/dvdy.22159 Google Scholar
T. M. Yelbuz, M. A. Choma, L. Thrane, M. L. Kirby, and
J. A. Izatt,
“Optical coherence tomography: a new high-resolution imaging technology to study cardiac development in chick embryos,”
Circulation, 106
(22), 2771
–2774
(2002). https://doi.org/10.1161/01.CIR.0000042672.51054.7B Google Scholar
M. W. Jenkins, O. Q. Chughtai, A. N. Basavanhally, M. Watanabe, and
A. M. Rollins,
“In vivo gated 4D imaging of the embryonic heart using optical coherence tomography,”
J. Biomed. Opt., 12
(3), 030505
(2007). https://doi.org/10.1117/1.2747208 Google Scholar
M. Gargesha, M. W. Jenkins, D. L. Wilson, and
A. M. Rollins,
“High temporal resolution OCT using image-based retrospective gating,”
Opt. Express, 17
(13), 10786
–10799
(2009). https://doi.org/10.1364/OE.17.010786 Google Scholar
M. W. Jenkins, D. C. Adler, M. Gargesha, R. Huber, F. Rothenberg, J. Belding, M. Watanabe, D. L. Wilson, J. G. Fujimoto, and
A. M. Rollins,
“Ultrahigh-speed optical coherence tomography imaging and visualization of the embryonic avian heart using a buffered Fourier Domain Mode Locked laser,”
Opt. Express, 15
(10), 6251
–6267
(2007). https://doi.org/10.1364/OE.15.006251 Google Scholar
M. W. Jenkins, P. Patel, H. Deng, M. M. Montano, M. Watanabe, and
A. M. Rollins,
“Phenotyping transgenic embryonic murine hearts using optical coherence tomography,”
Appl. Opt., 46
(10), 1776
–1781
(2007). https://doi.org/10.1364/AO.46.001776 Google Scholar
A. Liu, R. Wang, K. L. Thornburg, and
S. Rugonyi,
“Efficient postacquisition synchronization of 4-D nongated cardiac images obtained from optical coherence tomography: application to 4-D reconstruction of the chick embryonic heart,”
J. Biomed. Opt., 14
(4), 044020
(2009). https://doi.org/10.1117/1.3184462 Google Scholar
V. Hamburger and
H. L. Hamilton,
“A series of normal stages in the development of the chick embryo,”
J. Morphol., 88
(1), 49
–92
(1951). https://doi.org/10.1002/jmor.1050880104 Google Scholar
R. F. Stellingwerf,
“Period determination using phase dispersion minimization,”
Astrophys. J., 224 953
–960
(1978). https://doi.org/10.1086/156444 Google Scholar
M. M. Dworetsky,
“A period-finding method for sparse randomly spaced observations of ‘How long is a piece of string?’ (for variable stars),”
R. Astron. Soc., 203 917
–924
(1983). Google Scholar
M. K. Hu,
“Visual pattern recognition by moment invariants,”
IRE Trans. Inf. Theory,
(1962) Google Scholar
NotesThis paper is dedicated to our beloved chief, mentor, friend, colleague, and collaborator for many years, Professor Armin Wessel, MD/PhD (Director, Division of Pediatric Cardiology and Intensive Care Medicine, Hannover Medical School), who died unexpectedly July 16, 2011 at the age of 65 years, only 10 weeks before his retirement. |


