|
|
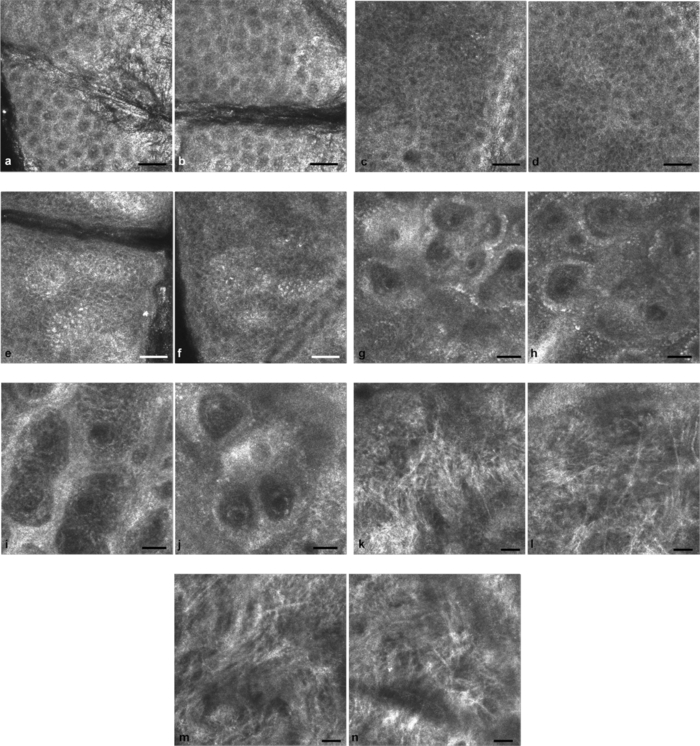
1.IntroductionIn vivo confocal microscopy is being widely established as a useful investigative tool in skin research.1, 2 The aims of in vivo skin imaging are to study physiological as well as pathological processes and to monitor the same body site noninvasively over a specific time interval along with treatment.3, 4 At present, two different methods exist: the reflectance and fluorescence modes. Reflectance confocal microscopy (RCM) has been proven to provide images with a microscopic resolution high enough to view cellular and sub-cellular detail.5, 6 The operating principle of this technique is based on exhibiting differences in reflectivity of various constituents of the skin (e.g., melanin, keratin, lipid, water, collagen) that produce contrast at specific illumination wavelengths.7 Fluorescence confocal microscopy (FCM), however, relies on the different distribution of exogenous fluorescent molecules (fluorophores) that are applied to the tissue to generate a contrast.8 Laser light at an appropriate wavelength is used to selectively excite the applied agent and the emitted fluorescence signal is detected at the same time.9 Whereas RCM is already used in a routine setting in some specialized facilities to assist in the diagnosis of skin tumors and to distinguish benign from malignant skin lesions, only a few reports on FCM in humans exist.10, 11 This can be explained by the fact that Food and Drug Administration (FDA)-approved fluorescent dyes for the application in humans and also the commercial availability of FCM devices are both limited. The new VivaScope® 1500 Multilaser (Lucid Inc, Rochester, New York) has been developed to combine reflectance with fluorescence confocal laser scanning microscopy. Three different lasers with wavelengths of 488 nm (blue), 658 nm (red), and 785 nm (near-infrared) are the integral part of this device. In general, shorter wavelengths have limited penetration depth but provide a better resolution in higher cellular layers, whereas longer wavelengths penetrate deeper into the skin but yield a lower resolution.10 The main scope of our work was to explore the fluorescence properties of the fluorophore indocyanine green (ICG) and to directly compare reflectance versus fluorescence images after its application to human skin. ICG is a water-soluble tricarbocyanine dye with a peak spectral absorption at 780 nm and its intravenous application is FDA-approved since 1959 for determination of cardiac output, liver function diagnostics, and ophthalmic angiography.12, 13, 14 The safe use and the fact that the near infrared absorption spectrum of ICG requires the use of a long wavelength, which permits deep penetration into the tissue, encouraged us to apply that dye to human skin in vivo. Our data presented in this work, for the first time, show ICG induced fluorescence images of human skin after intradermal application and their direct comparison with the reflectance mode. In healthy and diseased skin, we demonstrate the advantages of FCM after administration of ICG, which opens up new perspectives and possibilities in dermatological research. 2.Methods2.1.Participants2.1.1.Healthy subjectsTen healthy volunteers, five men and five women aged between 23 and 43 years, were recruited. All individuals were Caucasian, with skin types ranging from II to IV. Clinically healthy, nonsun-damaged skin on the volar forearm was imaged with the confocal microscope. 2.1.2.PatientsThe patient group consisted of 10 patients, six men, and four women aged between 25 and 71 years. Three basal cell carcinomas, three actinic keratoses, three seborrhoeic keratoses, and four psoriatic lesions were included in the analysis. The diagnosis of all basal cell carcinomas and actinic keratoses was histopathologically confirmed after examination with the VivaScope. The diagnosis of seborrhoeic keratoses and psoriasis was clinically established and via dermatoscopic evaluation. The study was conducted in Vienna (Department of Dermatology, Medical University of Vienna, Austria) after approval of the local ethics committee of the Medical University of Vienna and the Austrian health authority (Bundesministerium für Gesundheit, Vienna, Austria). The study was conducted according to the principles embodied in the Declaration of Helsinki. All subjects provided written informed consent before participating. 2.2.In Vivo Fluorescence/Reflectance Confocal MicroscopyReflectance and fluorescence images were obtained using a commercially available confocal laser scanning microscope [VivaScope 1500 Multilaser (Lucid Inc., Rochester, New York)]. A comprehensive review of the optical principles of the reflectance-only VivaScope has been published elsewhere.15 The multilaser system differs in that it is equipped with three lasers with wavelengths of 488 nm (blue), 658 nm (red), and 785 nm (near-infrared) and three corresponding filter sets. Each filter set is mounted in a bar. The user inserts the filter bar into the side of the confocal module. After application of a specific fluorescent dye, the compatible laser is used to illuminate the tissue, thereby exciting the appropriate fluorophore within the specimen. Spectral filtering can be selected while imaging the same portion of the skin without stopping the scanning session. The position of the filter bar enables imaging in the different modes. Each filter bar has three positions that allow, respectively, all returning light, only reflectance or only fluorescence, to reach the detector. In one position, reflected or backscattered laser light is eliminated by a fluorescence band-pass filter, whereas in another position, fluorescence is eliminated by a reflectance band-pass filter. In the third position, no filter is present, allowing both reflectance and fluorescence signal to return to the detector. In all filtering configurations, a pinhole attenuates the light from out-of-focus planes. The scanned field of view is 500 μm × 500 μm, producing images of 1000×1000 pixels. Image magnification is dependent on screen size. When displayed on the standard 19-inch monitor, magnification is approximately 600×. Axial resolution (section thickness) is <5μm. By moving the objective lens in the z (vertical) plane with respect to the skin surface, it is possible to image at different horizontal directions (x and y axis) within the tissue. By zeroing the imaging depth at the level of the most superficial layer before going vertically into the tissue, depth measurements can be obtained. A sequence of montage images (“VivaBlock”) can be acquired at constant depth. Each montage corresponds to a horizontal section at the user-selected depth with up to 8×8 mm total mapped field of view and axial resolution (section thickness) of <5 μm. A 0.5% solution of indocyanine green (ICG-Pulsion, Pulsion Medical Systems, Munich, Germany) was used as a fluorescent dye for the labeling of human skin structures. Approximately 20 μl of the solution were intradermally injected under standardized conditions using a 0.3 ml insulin syringe fitted with a 30-gauge needle. The syringe was placed at an angle of 5 to 10 deg with respect to the skin surface. Minimal pain is associated with administration of the dye. Imaging was performed about 60 min after introduction of the fluorescent contrast agent. This time frame was chosen after observations in a pilot study evincing a homogeneous distribution from that time onward. To study the kinetics of ICG in healthy human skin, images were also taken 24 and 48 h after injection. Between the imaging sessions, the injection site was light-protected using a band-aid (Curapor®, 7 × 5 cm). The standard procedure for in vivo scanning with the VivaScope has been previously described.16 ICG has a maximum absorption rate at a wavelength around 780 nm and the fluorescence emission is peaking at about 805 nm. The tissue was illuminated with near-infrared laser light (785 nm). Automatic image control was active, which allows the VivaScope to automatically optimize the laser power so that the image is displayed with the proper illumination. In reflectance mode (RM), the automatically adjusted laser power ranged between 0.4 and 1.2 milliwatts (mW). In fluorescence mode (FM), the laser power ranged between 12.2 and 14.4 mW. Representative images at different layers of epidermis and dermis were acquired by varying the imaging depth. By changing the corresponding filter position, reflectance and fluorescence images were consecutively obtained from the same area and level within the tissue. We evaluated the depicted representations from both in vivo confocal imaging modes. The color image in Fig. 9 was processed with the public domain software ImageJ (National Institute of Health, Bethesda, Maryland). Green and red color was used to highlight reflectance and fluorescence modes, respectively. There was no processing of any other images with any software before analysis and reproduction for this paper. Fig. 9Dermal papilla of a pigmented seborrhoeic keratosis is presented at 50 μm below the skin surface. (a) RM image exhibits a bright rim of highly refractive melanin-containing cells surrounding the dermal area. (b) In FM, the fluorescence signal delineates epidermal keratinocytes and illuminates the relatively acellular dermis. (c) Reflectance (green color) and the fluorescence signal (red color) of (a) and (b) are merged (scale bar, 50 μm).  For quantification of ICG fluorescence in different layers of the skin, stacks of VivaScope images with a step increment of 4.5 μm were analyzed using ImageJ. Measurement areas with homogeneous fluorescence in-between skin grooves were defined and the mean intensity of fluorescence was determined. Data were exported to MS-Excel™ and GraphPad Prism 5.01™ for high resolution graphs. 3.ResultsIn vivo confocal microscopy offers real-time scan sequences with gray-scaled images obtained in horizontal (en face) view to the skin surface. The technique provides confocal images at progressive depths starting from the stratum corneum down to deep dermal layers. Immediately after superficial intradermal injection of ICG, the dye slowly starts to distribute into epidermis and dermis. After 30 to 60 min, the distribution, which is strictly extracellular, provides stable and high image quality. 3.1.Healthy Human SkinIn the epidermis, a marked outline of keratinocyte cell borders is seen giving a clear impression of the overall morphology (cell architecture, cell size, and shape). At no time after injection of ICG, was a clearly visible fluorescence signal detectable in the cornified layer (data not shown). The applied fluorescent dye remained in the viable epidermis and did not diffuse upward through the barrier of the stratum granulosum-stratum corneum interface. Images were taken 60 min after injection. The results show an RM image and the corresponding fluorescence mode (FM) image from the same skin site and a level of 5 μm below the skin surface [Figs. 1a and 1b]. In both modes, cells of the stratum granulosum measuring 25 to 35 μm in size can be identified. Whereas, in RM, dark oval nuclei and a bright grainy cytoplasm can be observed, in FM the perceptibility has shifted in favor of a better outline of the cell border. Keratinocytes in the underlying layer, the stratum spinosum, are appreciably smaller (15 to 25 μm) and arranged in a tight honeycomb pattern. The cell borders can only partially be detected in RM [Fig. 1c]. In FM, the images clearly and lucidly show every single and polygonal keratinocyte [Fig. 1d]. The extracellular localization of the fluorescent dye encircles the cells with a bright shining contour. As imaging depth is increased toward the basal layer, the RM indicates oval areas containing strongly refractive cells [Fig. 1e]. They correspond to the top of the dermal papillae comprised of melanocytes and melanin-rich keratinocytes. In FM, those “hilltops” of the papillary dermis can be revealed as well, but in that case showing a rather confluent and homogeneous bright signal [Fig. 1f]. In RM, the lucid signal is caused by reflection of melanin in single cells. In FM, however, the signal occurs due to an enriched ICG distribution in the relatively acellular dermis. Therefore, the dermal papillae appear as bright round structures interposed among the deeper epidermal layers. Moving the focal plane a few microns deeper, the dermal papillae are truncated in the horizontal RM image and display a demarcated rim of refractive cells [Fig. 2a], still corresponding to melanin-rich basal cells and melanocytes. Comparing these circumferentially arranged basal cells in the FM, their cytoplasm appears dark, whereas the contrast agent occupies the extracellular space [Fig. 2b]. The reason being that backscattered light from refractive structures in RM is blocked in FM by the fluorescence band-pass filter through which only the fluorescent signal gets passed. The bright contrast within the papillae already corresponds to dermal structures, whereas capillary vessels appear dark. The duct of an eccrine sweat gland is demonstrated. In RM, it is visible as a diffuse whitish structure but in FM the outline of every single cell within the duct can be appreciated [Figs. 2a and 2b]. The RM image of the dermal-epidermal junction at 65 μm shows dermal and epidermal structures [Fig. 2c]. Connective tissue fibers, capillary loops, and interstitial keratinocytes can only be anticipated as opposed to the FM. Therein, fibrous structures that we assume to be collagen fibers and blood vessels are clearly contoured and the morphology of basal cells is still strongly evident [Fig. 2d]. The RM indicates the collagen-rich papillary dermis at 80 μm below the skin surface [Fig. 3a]. In the corresponding FM, these assumingly collagen fibers are sharply demarcated and for the first time, bright roundish structures of variable size are visible that cannot be identified in RM [Fig. 3b]. At present, it is not clear whether these could be fibroblasts and/or mast cells that are surrounded by the dye and/or whether these may be macrophages enclosed by ICG or having absorbed the dye. This finding is of significant interest and the scope of an ongoing investigation. At an imaging depth of 105 μm, the RM image is considerably degraded, whereas in the FM the fibrous structures are, even though less bright, still sharply circumscribed [Figs. 3c and 3d]. Figure 4 demonstrates an intensity profile of ICG one hour after injection showing maximum fluorescence at about 30 μm depth and a detectable signal down to at least 120 μm. Fig. 1(a) RM image of the stratum granulosum 5 μm below the skin surface. (b) In FM extracellular spaces are filled with ICG. Remnants of corneocytes (asterisk) appear brighter in the RM. (c) RM opposed to (d) FM of the upper stratum spinosum at a depth of 15 μm. (e) RM of the lower stratum spinosum at 25 μm demonstrates areas of bright melanin-containing cells (arrows). (f) In FM the strong luminosity at the same location (arrows) occurs because of the ICG enriched underlying dermis (scale bar, 50 μm).  Fig. 2(a) RM versus (b) FM of the dermal-epidermal junction at 40 μm [(bright rim of melanin-rich basal cells and melanocytes (arrows), eccrine sweat gland (asterisk)]. At a depth of 65 μm (c) RM is compared with (d) FM; dermal fibrous structures (asterisk), capillary loops (arrows) (scale bar, 50 μm).  Fig. 3In the dermis at 80 μm, (a) RM is opposed to (b) FM. In FM, fibers are sharply outlined; bright roundish structures of variable size are only present in the FM. (c) RM versus (d) FM at 105 μm (scale bar, 50 μm).  Fig. 4Intensity profile of ICG within epidermis and dermis down to 200 μm depth. Image stacks of ICG fluorescence were acquired one hour after injection of the dye with 4.5 μm increments and quantified with ImageJ (n = 9, error bars represent SEM).  The distribution of ICG in the epidermis remained stable for at least 8 h in all of the investigated participants. From then on, the contrast agent slowly started to redistribute from the extracellular space into the cytoplasm of the keratinocytes. This gradual redistribution is substantiated by the fact that areas with distinct intracellular ICG, as well as areas with still only extracellular dye shaped cells, can be identified after 24 h [Fig. 5b]. In comparison to the RM image, the FM still shows the outline of each single cell and, moreover, a clear differentiation between the cell border, the cytoplasm, and the nucleus can be revealed in some areas [Figs. 5a and 5b]. The fluorescence intensity in epidermis and dermis was still comparable with the intensity observed after 60 min (data not shown). Fig. 5(a) RM and (b) FM 24 h after ICG application; eccrine gland (asterisk). FM shows a redistribution of the fluorescent dye. (c) RM compared to (d) FM 48 h later. Different representation of an eccrine sweat gland (asterisk) in both modes. All images display the stratum spinosum at 20 μm (scale bar, 50 μm).  Although the fluorescent signal was visibly decreased after 48 h, it was still powerful enough to provide a superior contrast compared to reflectance. To illustrate the difference, we opposed an eccrine duct in both modes [Figs. 5c and 5d]. In RM, it is displayed as a roundish, grainy, and partly whitish structure, whereas in FM the sweat gland is well demarcated and even the inner part of the acrosyringium is sharply contoured and still strongly fluorescent. Imaging of any layer 72 h after introduction of the dye yielded no significant signal anymore (data not shown). The results were reproducible and consistent for all 10 subjects. The application of ICG was safe and well tolerated and no adverse event occurred in any of the participants. A slight green discoloration remained visible at the injection site but completely disappeared a few days after intradermal administration. To show that introduction of ICG did not change the reflectance properties of the skin, we opposed RM images of the injected tissue site to RM images of noninjected untreated skin (Fig. 6). Images of untreated skin were taken during the same scanning session from ICG-free areas surrounding the injected site. 3.2.Skin PathologyIn order to demonstrate the clinical applicability of this technique, we also applied ICG to lesional human skin and subsequently performed RM and FM images. Figure 7 shows a mapped field of the left margin of a nodular basal cell carcinoma at 50 μm below the skin surface in RM and FM in Figs. 7a and 7b, respectively. Already in the overview, typical tumor nests can be identified, which are characterized by polarization of epithelial cells at the periphery of the islands. But not all of these tumor islands can be recognized with the same accuracy in both confocal modes. A detailed section of the left lower part of the lesion demonstrates a lateral tumor branch with palisading tumor cells that can be detected with more precision in FM [Fig. 7d] than in RM [Fig. 7c]. Fig. 7(a) RM and (b) FM image of the left margin area of a basal cell carcinoma 50 μm below the skin surface (scale bar, 250 μm). The red frame depicts one section with greater magnification in (c) and (d). (c) In RM, several tumor islands on the right image border can be observed. On the left image border, a whitish structure with no clear cell demarcation is displayed (asterisk). (d) In FM, this structure can be clearly identified as lateral tumor branch cohering to the other tumor nests. Moreover, every single tumor cell and especially the polarization of these cells at the periphery of the islands can be appreciated (scale bar, 100 μm). Control images of healthy human skin at 50 μm in [(e),(g)] RM and [(f),(h)] FM are presented. 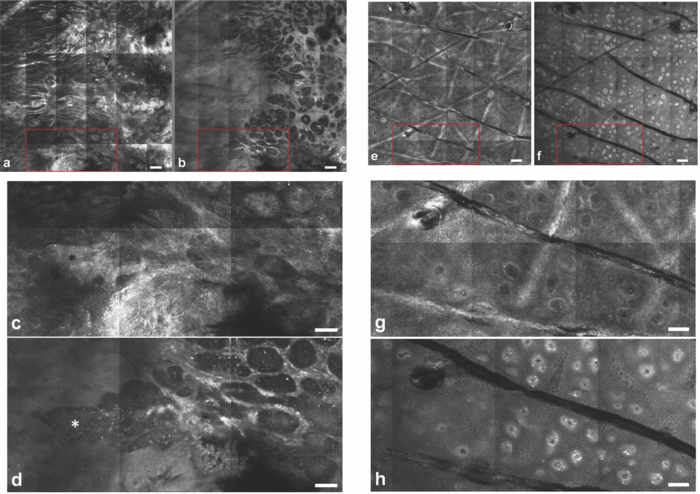 Key RCM features of actinic keratosis include severe disruption of the epidermal architecture, keratinocyte pleomorphism, and parakeratosis. The extracellular distribution of the fluorescent dye allows visualization of architectural disarray as well as of atypical keratinocytes varying in size and orientation with greater accuracy in FM [Fig. 8b] than in RM [Fig. 8a]. Parakeratosis is a sign of abnormal keratinization marked by the retention of nuclei in the stratum corneum. Highly refractive parakeratotic nuclei can be identified in RM [Fig. 8e], whereas in FM [Fig. 8f] they are barely visible. As mentioned above, the fluorescent dye is hardly able to pass the barrier of the stratum granulosum-stratum corneum interface after intradermal injection, which does not permit cell demarcation or significant uptake of ICG in the cornified layer. The low signal that can be detected in FM at some parakeratotic areas may be more likely caused by autofluorescence or by strong reflecting light that manages to defeat the filter rather than by fluorescence due to dye diffusion. We then used a pigmented seborrhoeic keratosis to exemplify the synergistic effect of RCM and FCM, especially in pigmented skin lesions: Fig. 9 shows a dermal papilla with melanin-rich circumferentially arranged basal keratinocytes and melanocytes. These cells appear bright in RM [Fig. 9a] and dark in FM [Fig. 9b] as backscattered light from refractive structures in RM is blocked in FM by the fluorescence band-pass filter. In Fig. 9c, RM and FM images are merged with two different colors (RM-green, FM-red) and the information of both techniques is combined. This representation now enables a clear distinction between the backscattering signal of melanin-containing cells and fluorescence in dermal and intercellular areas within one image. A further application of confocal microscopy is the evaluation of dermal vessels. Among other characteristics, psoriasis, a chronic inflammatory disease, is marked by uncontrolled angiogenesis and therefore served as a model to assess vascular changes. Figure 10 shows a psoriatic lesion at 65 μm below the skin surface at the dermal-epidermal junction. In RM [Fig. 10a], the capillaries within the papillae can only be identified to some extent, whereas in FM [Fig. 10b], an increase in vascularity can be observed with more precision. Every single capillary can be appreciated and counted, the thickness can be measured, and the course of the vessel can be tracked. Additionally, a concentric formation of keratinocytes encasing the enlarged papillae can be observed in detail. Fig. 8(a) RM and (b) FM of an actinic keratosis at 20 μm below the skin surface are displayed. The extracellular uptake of ICG outlines pleomorphic atypic keratinocytes with greater accuracy in FM than in RM. Control images of healthy human skin at 20 μm in (c) RM and (d) FM (scale bar, 50 μm). In the stratum corneum only the (e) RM enables to highlight the backscattering signal of parakeratotic nuclei (arrows). Note that demarcated cells in the right lower area of the corresponding (f) FM image already belong to the stratum granulosum. Control images of healthy human skin in (g) RM and (h) FM (scale bar, 20 μm).  Fig. 10(a) RM and (b) FM images of a psoriatic lesion at 65 μm below the skin surface are presented. In FM capillary vessels of variable size can be clearly identified and their course can be followed within the papillae. Concentrically arranged keratinocytes are contoured by the extracellular distributed fluorescent dye. Control images of healthy human skin at 65 μm in (c) RM and (d) FM showing single capillary loops (arrows) (scale bar, 50 μm).  4.DiscussionThe advancement of noninvasive or minimal-invasive in vivo skin imaging techniques is one of the main goals in clinical dermatology. Assessment and follow-up of exactly the same skin site can be performed as no tissue is removed.17 Several such tools based on optical imaging have emerged in the recent past. High-frequency ultrasound, for example, uses ultrasound frequencies between 3 and 100 MHz to evaluate skin morphology and enables a high penetration depth.18 Among other evaluations, this method is established for the preoperative measurement of melanoma thickness, but its weakness is the deficit in providing cellular resolution.19 Optical coherence tomography works analogous to ultrasound imaging except that it uses light rather than sound waves. The data resembles an ultrasound image with a slightly better resolution, but is still too low for visualizing cell morphology.20, 21 RCM was the first in vivo tool that offered the possibility to study the skin at a microscopic resolution approaching histological detail.22 This technique utilizes the distribution of naturally occurring refractive index variations within the skin to provide a source of contrast. Especially pigmented disorders are the focus of RCM as they give a strongly backscattered signal of melanin-containing cells.23 More recently, also multiphoton microscopes and laser tomographs have received attention in the field of in vivo skin imaging. Similar to RCM, multiphoton laser scanning tomography (MPT) is a near-infrared scanning microscopy technique. But instead of recording the backscattered light, MPT is based on excitation and autofluorescence detection of endogenous fluorophores such as NAD(P)H, flavoproteins, keratin, lipofuscin, elastin, collagen, melanin, and porphyrines.24, 25 Preliminary investigations of MPT on healthy human skin promise a valuable contribution to dermatological diagnostics in the future.26 However, the use of MPT appears limited because of high costs that arise from the need of strong pulsed lasers and expensive technical equipment. In our study, we report the use of an exogenous fluorescent dye in combination with FCM to enhance cellular resolution. To date, only a few explorations on the use of exogenous contrast agents in human skin in vivo have been attempted. To the best of our knowledge, sodium fluorescein was the first fluorescent dye that has been applied to living human tissue in combination with confocal microscopy.27 Excited with a short wavelength of 488 nm the illumination of this fluorophore can be measured, obtaining images of the epidermis quite comparable to those that we gained after application of ICG. Sodium fluorescein, however, exhibits an unstable image quality that only lasts for some minutes, along with an immediate uncontrolled redistribution within the tissue. The fluorescent signal has disappeared after 25 to 40 mins.11 And finally, the short wavelength that is required to excite this fluorophore does not possess the capacity to deliver focused images that exceed the border of the dermal-epidermal junction. The long-wave, near-infrared 785 nm laser diode integrated into the recently developed VivaScope Multilaser in combination with an appropriate filter setting now offered several novel opportunities. As already established in the reflectance-only device, the long wavelength enables imaging down to the superficial reticular dermis.15 In addition, a suitable fluorescent molecule can be activated and fluorescence emission can be measured to achieve an imaging contrast. Thus, reflectance and fluorescence confocal microscopy are incorporated and applicable in one single device. This is of particular interest as both modes offer different information that can be combined in order to improve diagnostic evidence. In our study, we, for the first time, report the intradermal application of the fluorophore ICG in combination with the 785 nm laser and compare RM with FM images of exactly the same skin site. ICG is one of very few FDA-approved fluorescent dyes for human use that has been safely applied for decades as a contrast agent for retinal angiography and liver function diagnostics with a much higher intravenous dose.12, 28 More recently, ICG fluorescence has been shown to be a safe and highly sensitive method for sentinel lymph node detection in breast cancer patients after periareolar intracutaneous administration.29, 30 We demonstrated that after intradermal injection into healthy human skin, ICG shows a very stable extracellular distribution accompanied with a constantly strong fluorescent signal detectable up to 48 h. In every epidermal layer, cell-to-cell demarcation was clearly distinguishable with FCM and yielded superior contrast compared with RCM. Backscattering of melanin-rich cells provided additional information when evaluating the images in RM. The true advantage of our approach was observable when comparing images of dermal layers. In contrast to the RM, the FM showed thin fibrous structures that were sharply contoured and lucidly visible. We suppose that these are collagen and/or elastic fibers. Of particular note was the presence of as yet unidentified strongly fluorescent variable-sized roundish structures. At the moment it can only be assumed that these are cells (fibroblasts, mast cells, histiocytes) that are interspersed within the dermis. Labeling of these structures is currently under investigation by our group. Furthermore, we selected a small subset of skin diseases to emphasize the diagnostic potential of intracutaneously applied ICG in combination with near-infrared FCM. In a basal cell carcinoma, we demonstrated that tumor nests and peripheral tumor branches can be outlined with greater accuracy. In addition, we showed that pleomorphic keratinocytes can be delineated and recognized as such in actinic keratosis and that also vascular formations in psoriatic lesions can be assessed with much more detail in FM. In a pigmented skin lesion, we demonstrated that RCM and FCM linked together provide synergistic information. Whereas, FCM clearly outlines the cell border in the epidermis and illuminates dermal areas, melanin-containing cells can distinctly be presented with RCM. Therefore, FCM alone or in combination with RCM offers numerous potential applications in dermatological research and clinical routine by evaluating the status of normal skin, dynamic skin processes, and the management of skin disease. In epidermal layers, it provides a salient assessment of skin architecture and even dermal structures can be identified with superior contrast. The ability to outline collagen fibers at deep dermal layers using ICG offers the possibility, for example, to study sclerotic diseases in vivo and, moreover, to examine the effect of different therapies in connective tissues diseases. Additionally, our data indicate that dermal vessels can be outlined with marked contrast, providing the opportunity, for instance, to measure their thickness and count capillary formations along with psoriatic treatment. It can also be expected that tumor margins and the invasiveness of skin neoplasms can be better assessed before surgical removal. This could be a big advantage especially at cosmetically important localizations like the face. Moreover, subtotal tumor removal could be avoided preventing further surgical interventions and thus providing an economic benefit. However, the necessity and introduction of a fluorescent dye represents the major limitation for this method that, strictly speaking, can no longer be regarded as a noninvasive approach. Therefore, it remains to be seen whether staining with ICG has the potential to enter clinical dermatology, or will be restricted to medical research. For the moment, in vivo FCM of human skin offers fluorescence emission that is restricted to “random” accumulation of the dye within the tissue. But the ability to target sub-cellular molecules with specific fluorescent-labeled antibodies would significantly expand the role of FCM in a clinical setting. In a mouse model, fluorescein-labeled antibodies have already been shown to successfully detect melanoma cells in vivo.31 And recently, a topical formulation of ICG has also been prepared by Ra to evaluate its penetration properties into living human and mouse skin.32 Using a handheld dual-axis confocal microscope, this group demonstrated that their ICG cream formulation readily penetrated the stratum corneum. Although the distribution was described as uneven, the signal was, however, visible in the viable epidermis. As the VivaScope technology differs from the dual-axis confocal technology, it will be of particular interest to elucidate the fluorescent power of topically applied ICG in combination with this device in the near future. But it still seems questionable whether a fluorescent dye can penetrate and illuminate dermal layers after topical administration. In conclusion, in vivo FCM in association with different and newly developed contrast dyes, their various kinds of application, and the technical linkage with RCM in one device delivering additional and amplified information, provides a promising outlook for the investigative future in dermatology. AcknowledgmentsThe authors want to thank Dan Koon (Lucid Inc, Rochester, New York) and Yvonne Franke (Mavig GmbH, Munich, Germany) for technical help. The study was supported by Pulsion Medical Systems. ReferencesG. Pellacani, A. M. Cesinaro, and
S. Seidenari,
“Reflectance-mode confocal microscopy of pigmented skin lesions–improvement in melanoma diagnostic specificity,”
J. Am. Acad. Dermatol., 53
(6), 979
–985
(2005). https://doi.org/10.1016/j.jaad.2005.08.022 Google Scholar
H. Y. Kang, P. Bahadoran, and
J. P. Ortonne,
“Reflectance confocal microscopy for pigmentary disorders,”
Exp. Dermatol., 19
(3), 233
–239
(2010). https://doi.org/10.1111/j.1600-0625.2009.00983.x Google Scholar
V. Ahlgrimm-Siess, M. Horn, S. Koller, R. Ludwig, A. Gerger, and
R. Hofmann-Wellenhof,
“Monitoring efficacy of cryotherapy for superficial basal cell carcinomas with in vivo reflectance confocal microscopy: a preliminary study,”
J. Dermatol. Sci., 53
(1), 60
–64
(2009). https://doi.org/10.1016/j.jdermsci.2008.08.005 Google Scholar
S. Gonzalez and
Y. Gilaberte-Calzada,
“In vivo reflectance-mode confocal microscopy in clinical dermatology and cosmetology,”
Int. J. Cosmet. Sci., 30
(1), 1
–17
(2008). https://doi.org/10.1111/j.1468-2494.2008.00406.x Google Scholar
A. Scope, U. Mahmood, D. S. Gareau, M. Kenkre, J. A. Lieb, K. S. Nehal, and
M. Rajadhyaksha,
“In vivo reflectance confocal microscopy of shave biopsy wounds: feasibility of intraoperative mapping of cancer margins,”
Br. J. Dermatol., 163
(6), 1218
–1228
(2010). https://doi.org/10.1111/j.1365-2133.2010.10063.x Google Scholar
M. Rajadhyaksha, S. Gonzalez, J. M. Zavislan, R. R. Anderson, and
R. H. Webb,
“In vivo confocal scanning laser microscopy of human skin II: advances in instrumentation and comparison with histology,”
J. Invest. Dermatol., 113
(3), 293
–303
(1999). https://doi.org/10.1046/j.1523-1747.1999.00690.x Google Scholar
A. A. Marghoob, L. D. Swindle, C. Z. Moricz, F. A. Sanchez Negron, B. Slue, A. C. Halpern, and
A. W. Kopf,
“Instruments and new technologies for the in vivo diagnosis of melanoma,”
J. Am. Acad. Dermatol., 49
(5), 777
–797
(2003). https://doi.org/10.1016/S0190-9622(03)02471-X Google Scholar
D. T. Leeson, C. Lynn Meyers, and
K. Subramanyan,
“In vivo confocal fluorescence imaging of skin surface cellular morphology: a pilot study of its potential as a clinical tool in skin research,”
Int. J. Cosmet. Sci., 28
(1), 9
–20
(2006). https://doi.org/10.1111/j.1467-2494.2006.00292.x Google Scholar
L. D. Swindle, S. G. Thomas, M. Freeman, and
P. M. Delaney,
“View of normal human skin in vivo as observed using fluorescent fiber-optic confocal microscopic imaging,”
J. Invest. Dermatol., 121
(4), 706
–712
(2003). https://doi.org/10.1046/j.1523-1747.2003.12477.x Google Scholar
S. Astner, S. Dietterle, N. Otberg, H. J. Rowert-Huber, E. Stockfleth, and
J. Lademann,
“Clinical applicability of in vivo fluorescence confocal microscopy for noninvasive diagnosis and therapeutic monitoring of nonmelanoma skin cancer,”
J. Biomed. Opt., 13
(1), 014003
(2008). https://doi.org/10.1117/1.2837411 Google Scholar
L. E. Meyer, N. Otberg, W. Sterry, and
J. Lademann,
“In vivo confocal scanning laser microscopy: comparison of the reflectance and fluorescence mode by imaging human skin,”
J. Biomed. Opt., 11
(4), 044012
(2006). https://doi.org/10.1117/1.2337294 Google Scholar
T. Desmettre, J. M. Devoisselle, and
S. Mordon,
“Fluorescence properties and metabolic features of indocyanine green (ICG) as related to angiography,”
Surv. Ophthalmol., 45
(1), 15
–27
(2000). https://doi.org/10.1016/S0039-6257(00)00123-5 Google Scholar
R. Alford, H. M. Simpson, J. Duberman, G. C. Hill, M. Ogawa, C. Regino, H. Kobayashi, and
P. L. Choyke,
“Toxicity of organic fluorophores used in molecular imaging: literature review,”
Mol. Imaging, 8
(6), 341
–354
(2009). Google Scholar
M. Haller, C. Akbulut, H. Brechtelsbauer, W. Fett, J. Briegel, U. Finsterer, and
K. Peter,
“Determination of plasma volume with indocyanine green in man,”
Life Sci., 53
(21), 1597
–1604
(1993). https://doi.org/10.1016/0024-3205(93)90183-4 Google Scholar
P. Calzavara-Pinton, C. Longo, M. Venturini, R. Sala, and
G. Pellacani,
“Reflectance confocal microscopy for in vivo skin imaging,”
Photochem. Photobiol., 84
(6), 1421
–1430
(2008). https://doi.org/10.1111/j.1751-1097.2008.00443.x Google Scholar
S. Gonzalez,
“Confocal reflectance microscopy in dermatology: promise and reality of non-invasive diagnosis and monitoring,”
Actas Dermosifiliogr., 100
(2), 59
–69
(2009). https://doi.org/10.1016/S0001-7310(09)73380-0 Google Scholar
M. Ulrich, D. Krueger-Corcoran, J. Roewert-Huber, W. Sterry, E. Stockfleth, and
S. Astner,
“Reflectance confocal microscopy for noninvasive monitoring of therapy and detection of subclinical actinic keratoses,”
Dermatology, 220
(1), 15
–24
(2010). https://doi.org/10.1159/000254893 Google Scholar
L. Smith and
S. Macneil,
“State of the art in non-invasive imaging of cutaneous melanoma,”
Skin Res. Technol.,
(2011) https://doi.org/10.1111/j.1600-0846.2011.00503.x Google Scholar
D. Jasaitiene, S. Valiukeviciene, G. Linkeviciute, R. Raisutis, E. Jasiuniene, and
R. Kazys,
“Principles of high-frequency ultrasonography for investigation of skin pathology,”
J. Eur. Acad. Dermatol.Venereol., 25
(4), 375
–382
(2011). https://doi.org/10.1111/j.1468-3083.2010.03837.x Google Scholar
K. Cal, J. Stefanowska, and
D. Zakowiecki,
“Current tools for skin imaging and analysis,”
Int. J. Dermatol., 48
(12), 1283
–1289
(2009). https://doi.org/10.1111/j.1365-4632.2009.04198.x Google Scholar
M. Mogensen, B. M. Nurnberg, J. L. Forman, J. B. Thomsen, L. Thrane, and
G. B. Jemec,
“In vivo thickness measurement of basal cell carcinoma and actinic keratosis with optical coherence tomography and 20-mhz ultrasound,”
Br. J. Dermatol., 160
(5), 1026
–1033
(2009). https://doi.org/10.1111/j.1365-2133.2008.09003.x Google Scholar
M. Rajadhyaksha, M. Grossman, D. Esterowitz, R. H. Webb, and
R. R. Anderson,
“In vivo confocal scanning laser microscopy of human skin: melanin provides strong contrast,”
J. Invest. Dermatol., 104
(6), 946
–952
(1995). https://doi.org/10.1111/1523-1747.ep12606215 Google Scholar
R. G. Langley, M. Rajadhyaksha, P. J. Dwyer, A. J. Sober, T. J. Flotte and
R. R. Anderson,
“Confocal scanning laser microscopy of benign and malignant melanocytic skin lesions in vivo,”
J. Am. Acad. Dermatol., 45
(3), 365
–376
(2001). https://doi.org/10.1067/mjd.2001.117395 Google Scholar
H. G. Breunig, H. Studier, and
K. Konig,
“Multiphoton excitation characteristics of cellular fluorophores of human skin in vivo,”
Opt. Express, 18
(8), 7857
–7871
(2010). https://doi.org/10.1364/OE.18.007857 Google Scholar
J. Paoli, M. Smedh, and
M. B. Ericson,
“Multiphoton laser scanning microscopy–a novel diagnostic method for superficial skin cancers,”
Semin. Cutan Med. Surg., 28
(3), 190
–195
(2009). https://doi.org/10.1016/j.sder.2009.06.007 Google Scholar
M. J. Koehler, S. Zimmermann, S. Springer, P. Elsner, K. Konig, and
M. Kaatz,
“Keratinocyte morphology of human skin evaluated by in vivo multiphoton laser tomography,”
Skin Res. Technol.,
(2011) https://doi.org/10.1111/j.1600-0846.2011.00522.x Google Scholar
C. Suihko, L. D. Swindle, S. G. Thomas, and
J. Serup,
“Fluorescence fibre-optic confocal microscopy of skin in vivo: microscope and fluorophores,”
Skin Res. Technol., 11
(4), 254
–267
(2005). https://doi.org/10.1111/j.0909-725X.2005.00152.x Google Scholar
S. L. Owens,
“Indocyanine green angiography,”
Br. J. Ophthalmol., 80
(3), 263
–266
(1996). https://doi.org/10.1136/bjo.80.3.263 Google Scholar
D. Murawa, C. Hirche, S. Dresel, and
M. Hunerbein,
“Sentinel lymph node biopsy in breast cancer guided by indocyanine green fluorescence,”
Br. J. Surg., 96
(11), 1289
–1294
(2009). https://doi.org/10.1002/bjs.6721 Google Scholar
T. Hojo, T. Nagao, M. Kikuyama, S. Akashi, and
T. Kinoshita,
“Evaluation of sentinel node biopsy by combined fluorescent and dye method and lymph flow for breast cancer,”
The Breast, 19
(3), 210
–213
(2010). https://doi.org/10.1016/j.breast.2010.01.014 Google Scholar
P. Anikijenko, L. T. Vo, E. R. Murr, J. Carrasco, W. J. Mclaren, Q. Chen, S. G. Thomas, P. M. Delaney, and R. G. King,
“In vivo detection of small subsurface melanomas in athymic mice using noninvasive fiber optic confocal imaging,”
J. Invest. Dermatol., 117
(6), 1442
–1448
(2001). https://doi.org/10.1046/j.0022-202x.2001.01592.x Google Scholar
H. Ra, W. Piyawattanametha, E. Gonzalez-Gonzalez, M. J. Mandella, G. S. Kino, O. Solgaard, D. Leake, R. L. Kaspar, A. Oro, and
C. H. Contag,
“In vivo imaging of human and mouse skin with a handheld dual-axis confocal fluorescence microscope,”
J. Invest. Dermatol., 131
(5), 1061
–1066
(2010). https://doi.org/10.1038/jid.2010.401 Google Scholar
|