

|
|
1.IntroductionThe detection of brain activity and diagnostic of brain dysfunctions have been facilitated by the emergence of technologies such as functional magnetic resonance imaging (fMRI) and positron emission tomography. While highly efficient in some applications and giving coverage over the entire brain, these modalities suffer from high cost and the requirement for acquisitions to be performed in a tightly controlled environment. In clinical applications where continuous acquisitions are necessary, such as epilepsy monitoring, cardiac surgery, and brain computer interface, these imaging modalities are cumbersome as they are not portable, a limitation that calls for alternatives. Electroencephalography (EEG) and near-infrared spectroscopy (NIRS) are such alternatives, since they can both be made portable and used for long periods of time, even with difficult populations such as children and neurologically impaired subjects. While EEG has been well established in the clinical practice, NIRS is a relatively new functional imaging modality1, 2, 3 using near-infrared light propagation (650 to 900 nm) in biological tissues. Since hemoglobin is the main absorber in this range, NIRS has enabled researchers to image hemodynamics, which represent the variations of concentration of different blood chromophores; in this case, in vivo through centimeters of biological tissues using nonionizing, low dose radiation. By acquiring data at two or more wavelengths, it can distinguish and record simultaneous changes in deoxyhemoglobin (HbR) and oxyhemoglobin (HbO2). NIRS has seen growing interest in neuroscience due to the recent widespread availability of commercial instruments and their low cost when compared to alternatives. A nonexhaustive list of applications include functional brain imaging,4, 5 stroke,6, 7 epilepsy,8, 9, 10, 11 and neuropsychology12, 13, 14 studies. The impetus for this work originated from a clinical need to investigate concurrent EEG-NIRS signal in the context of epilepsy. While benefiting from a vast documentation and being the gold standard for epilepsy diagnostic, EEG has poor spatial resolution when it comes to applications such as epileptogenic foci localization15 performed prior to surgery. Recent evidence in epilepsy has shown potential benefits in measuring hemodynamics, as in some cases it may occur prior to ictal events16, 17 or be used as a predictor of the spatial location of epileptic foci when using EEG triggered interictal hemodynamic data.18 While blood oxygen level-dependent fMRI can be used in combination with EEG to measure hemodynamics, continuous monitoring is difficult as patients will not always have (inter)-ictal events in the scanner, and the imaging sequence generates artifacts that even when removed, yields EEG data that is difficult to interpret. Furthermore, movement artifacts recorded in fMRI are hard to remove. Here, NIRS has an advantage as it does not interact with EEG and it may be possible to measure optical data continuously with reduced movement artifact sensibility compared to fMRI. It has recently been demonstrated that the combination of EEG and NIRS is valuable19, 20 but available systems still suffer from several shortcomings. To be well suited for clinical use, a combined EEG-NIRS system has to be capable of continuous monitoring. As epilepsy patients are usually monitored over days, the system should generate minimal discomfort to the patient, communicate wirelessly, be battery-operated, cover the whole head with a large number of detection channels, and be sensitive enough to get good quality optical and electrical signals despite the presence of scalp hair. Commercial EEG products with acceptable performances are readily available, but existing NIRS systems all lack at least one of the criteria mentioned above.21, 22, 23 Furthermore, the only combined EEG-NIRS systems developed either come from the use of commercial EEG and nonportable NIRS as separate products or research prototypes with few channels,19, 24, 25 for which demonstration was only performed on the forehead as they had low sensitivity for acquisitions over hair-covered scalp. In short, none of these systems answered the clinical needs described above. In this paper, we describe a new portable EEG-NIRS system composed of up to 32 EEG channels, 32 light sources, and 32 light detectors that has the potential to cover the whole head for an adult. These light sources and detectors allow to acquire data from up to 128 optical input channels, that is if every detector is coupled to 4 light sources. The prototype realized and validated is a reduced channel count that supports 8 EEG channels, 8 light sources, and 8 light detectors. This version of the system is battery powered, transmits results in real-time to a computer via a USB cable, has high sensitivity, and to the best of our knowledge, is the first system combining all these features. This contribution was made possible by a combination of integration and system simplification techniques that will be described in Sec. 2. Characterization of various NIRS parameters was first conducted with phantoms. In vivo measures were then acquired using a visual pattern reversal protocol to detect oxygen level changes and visually evoked potentials (VEPs). Results demonstrated that the system is capable of reliably detecting local blood oxygenation variations as well as EEG evoked potentials when stimuli are presented. The results were then compared to the literature to test the reproducibility of the protocols with our prototype. The implications of the presented system and its validation are then given and followed by a final conclusion including the next steps of our research. 2.Portable EEG-NIRS Prototype2.1.RequirementsClinical use of EEG and NIRS on adults requires a system design respecting several restrictions. We review in Sec. 2.2 the critical elements that have to be addressed for both EEG and NIRS modalities. EEG signals emerge from synchronized neuronal activation and are picked up by electrodes attached to the scalp. Since signal amplitude ranges approximately from less than 20 to 150 μV, these oscillations have to be amplified with a gain between 1000 and 100,000, in order to obtain a signal strength that exceeds the noise floor of the recording device. A bandpass filter is used to keep only the frequencies of interest, typically from 0.25 to 70 Hz. Analog to digital conversion is performed at a rate between 200 and 1000 samples per second (SPS), depending on the application (research systems may use even higher rates). The contact electrical impedance between the skin and the electrodes can reach several thousand ohms; thus the input impedance of the first amplifier stage has to be over 100 MΩ. Other design considerations regarding EEG requirements can be found in Ref. 26. In the case of NIRS, the quality of light detection is critical for the ability to record functional changes in the brain. Optical signals detected have a power that is 7 to 9 orders of magnitude smaller than the light injected for a typical adult head and optodes separation distance of 4 cm.4 The illumination intensity that reaches the detector depends primarily on the illumination source power and on the distance between the source and the detector. It is also affected by the quality of optical coupling and the color and thickness of hair. Two types of detectors are well suited for portable continuous wave (cw) NIRS: silicon photodiodes (SiPDs) and avalanche photodiodes (APDs). SiPDs generate a small current when excited by photons and have the advantage of being inexpensive and widely available. However, their sensitivity is limited and their use limits NIRS applications to infants and adult frontal cortex as attenuation is reduced in these cases. APDs are similar to SiPDs but induce an internal gain when biased with a high voltage, usually over 100 V. This internal gain, called avalanche gain, allows detecting weaker signals because the generated current is amplified before it can pick up noise from the surroundings on its way to the amplifier. APD disadvantages include high cost and temperature sensitivity. Since the transport of signals via optical fiber is not practical for portable systems, detectors have to be placed directly on the scalp and special care has to be taken to insure that the high voltage is safely brought to the head in the case of APDs. Source-detector distance has a major impact on the strength of a signal but is also directly related to the depth from which intensity changes originate. A larger source-detector distance reduces the raw signal, but enables to reach greater depths, thus showing stronger signal during activation.27 Low channel numbers is typical in current portable NIRS systems and limits the coverage of the brain, rendering their use ineffective for applications such as epileptogenic foci localization.22 Other available systems have a high channel count but low sensitivity due to the use of silicon photodiodes limiting their application to the frontal cortex.28 Covering the whole head with sufficient sensitivity is thus required to broaden the potential applications of such systems. For the EEG, common practice will use the international 10-20 system for positioning, requiring 22 electrodes from which 19 are used to record signals, 1 sets a voltage reference, and the last 2 optional electrodes can be used in a right-leg drive-type feedback circuit to reduce common mode interference. For NIRS, no international standard exists yet a compromise between optode density on the head, depth of penetration, and signal strength is necessary. Following these considerations, the objectives for the proposed device were set to 32 EEG channels with an acquisition rate of 320 and 20 SPS for each combination of the 32 light sources with the 32 NIRS detectors. The additional EEG electrodes compared to the 10-20 standard can be used to increase resolution in a specific area in the case of source localization.29 For NIRS, the high number of optodes would allow coverage of the whole head. A much higher number of sources and detectors than proposed here would become problematic as installation of the sensing elements would take significantly longer and the high probe density would be harder to manage, in part because of increased cross-talk between channels. Portable system design requirements as mentioned above include small size, light weight, wireless communication, and low power consumption, enabling long term acquisition using battery power. Our goal is to design a system that can operate for 24 h on a single battery charge without interruption. Any medical device to be tested on humans has to be designed following strict regulations to ensure subject safety. The IEC601.1 standard sets specific guidelines to follow for this prototype. As electrodes are connected directly to the subject for EEG measurements but not directly to the heart, this instrument falls into the Class II BF category. Protection circuits thus have to be designed accordingly and will be discussed in Sec. 2.2.5. 2.2.System DesignFigure 1 shows the prototype of a reduced channel count (8 sources, 8 detectors, 8 EEG channels) of the proposed system used for in vivo tests. Some key strategies and techniques used to reach the design objectives include the use of high sensitivity APDs driven by a common high voltage source and directly coupled to the scalp, the absence of temperature-controlled feedback for avalanche gain control, a modular design approach including custom-made casings, and the use of a time-multiplexing strategy to drive the light sources efficiently. Fig. 1(a) Photograph of the control module and detection helmet, (b) 3D view of NIRS detector and source, EEG electrode on detector not shown, and (c) 3D view of control module.  The architecture of the system is presented in Fig. 2a. We present in Secs. 2.2.1, 2.2.2 both the EEG and the NIRS acquisition chains. Different architecture and safety aspects will then be analyzed briefly. Fig. 2(a) System block diagram, (b) EEG amplification chain for one channel and reference circuit, and (c) NIRS illumination and amplification chain for one channel. 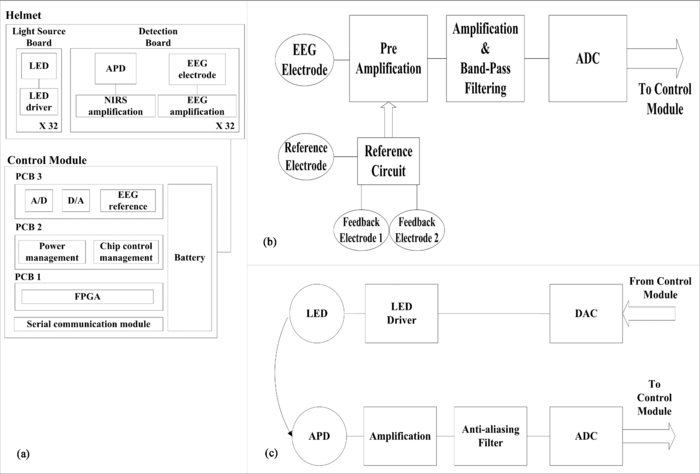 2.2.1.EEG signal chainThe amplification chain for an EEG channel, shown in Fig. 2b, was inspired by a circuit found in Ref. 30 to which we added an amplification stage close to the electrode so that the recorded signal is less sensitive to background electrical noise. A circuit dedicated to setting a reference potential on the subject head and located in the control module uses three dedicated electrodes distinct from the signal electrodes. Two feedback electrodes, typically placed on the left and right mastoids, are used to minimize the common mode interference and the reference electrode, typically installed on the forehead, sets the head to a potential of 2.5 V, the mid-point of the amplifier dynamic range. Each signal electrode is connected to an instrumentation amplifier followed by 2 more amplification stages including second order bandpass filters between 0.1 and 100 Hz. The original signal is amplified with a gain of 10,000 before being digitized at 320 SPS by a 16-bit analog to digital converter (ADC), which is located in the control module. The data is transferred to a field programmable gate array (FPGA) over 3 lines following the Serial Peripheral Interface (SPI) protocol. 2.2.2.NIRS signal chainThe selection of the light source and detector has a major influence on the performance that can be achieved by NIRS systems. In this design, the illumination sources were light-emitting diodes (LEDs) emitting at 735 and 850 nm fitted in a single TO-18 package (Epitex, L2×735/2×850-40B32). This choice was motivated by the small dimensions of the package and safety considerations when compared to laser diodes. Reference 31 elaborates on the pros and cons of light source types for NIRS. For detection, APDs (Hamamatsu, S2384) were used for their high sensitivity. The temperature-controlled feedback circuits generally used to compensate the avalanche gain temperature sensitivity were not used in this system. This design decision was made in order to keep the smallest possible detector board footprint and was made possible by two main factors. First, temperature variations at the detector typically happen slowly in a clinical context and the digital high-pass filters used to process the raw data can get rid of these drifts. Second, should transient temperature variations pass through the previously mentioned filters, they would be eliminated by the principal component filtering used further in the data processing chain. This type of filter eliminates the elements of signal that are highly correlated between channels, as would be the case with temperature variations, which will likely affect more than one detector at the time. The high voltage needed to bias the photodiode is generated by a single dc-dc converter (EMCO, CA02-5N) located on the control module. One such supply is sufficient for the 8 detectors and according to the product data sheet, the performance should not change significantly for 32 channels. This last aspect has yet to be validated. The illumination and amplification chain for a NIRS channel is shown in Fig. 2c. First, a digital-to-analog converter (DAC) generates the drive signal for the light source. This drive signal is then passed on to a voltage-controlled current source that feeds the LEDs. Next, light that has propagated through the brain toward the detector is converted to a small current. This current is amplified by a transimpedance amplifier with a gain of 10 MV/A. An antialiasing filter is then applied prior to digitization of the signal at 20 SPS by a 16-bit ADC. The size of each illumination printed circuit board (PCB) is 20.1 ×11.0 mm. The detection PCB is 23.0 ×11.0 mm. 2.2.3.System architectureThe high channel count required the adoption of specific strategies to make it portable. This system was separated in three parts: a graphical user interface (GUI) housed in a laptop computer, a control module that is worn by the patient, and a detection helmet. The control module and detection helmet were optimized toward low power consumption and small physical footprint. The GUI is written in MATLAB (MathWorks, Inc.), allows user control of the acquisition parameters, and records the data in real time via a USB cable or a wireless transfer module. It generates the timing sequences required by the hardware and also has an installation mode that helps clinicians validate signal quality when installing the system on patients. The helmet is made of flexible neoprene and holds the light sources and the NIRS and EEG detectors. In order to fit 32 elements of each type on the head, NIRS and EEG detection and amplification are integrated on the same PCB. A three-dimensional (3D) model of the illumination and detection optodes is shown in Fig. 1b. The control module has three different PCBs. The first PCB is an arrow low power reference platform, a commercial prototyping platform made for battery powered applications using an Altera Cyclone III field FPGA. Its role is to synchronize the acquisition process and communicate the data in real time with the computer. The second PCB manages the power supply and the communication with the different chips of the system. Three different voltages are required: 5 V for the analog part, 3.3 V for the digital part, and −150 V for APD biasing. Communication with all the chips on the third PCB is made via an SPI bus. In order to decrease the number of FPGA pins necessary for communication, a decoder is used to address the signals. The third PCB has all the ADCs and DACs that connect to the elements on the helmet and allows the use of 8 EEG channels, 8 light sources, and 8 NIRS detection channels. In order to support up to 32 EEG channels, 32 light sources, and 32 NIRS detection channels, 3 other copies of the third PCB can be added. These additional boards are stacked on top of PCB #3 with stack-through connectors. The rest of the hardware is designed to support this upgrade. Several performance validations were made in hardware and software in order to assure sufficient hardware speed, data management capability, and communication bandwidth. Using this type of architecture saves space and allows for a reduced channel count version. The results presented in this paper were obtained with the 8-channel version of the system. A 3D model of the control module, measuring 16 × 13 × 8.2 cm3, is shown in Fig. 1c. As a single communication bus is used for all the ADCs and DACs, a specific acquisition sequence is generated by the GUI is order to synchronize data retrieval. This sequence ensures correct NIRS and EEG sampling rates and allows setting the minimum light power needed for sufficient signal quality. Furthermore, because light source switching causes a current surge from the power supply and hence a spike on the EEG signal, it is important to let the power rails come back to steady state before acquiring the next EEG sample when the lighting is changed. The timings of EEG sampling have been optimized in order to reduce this problem to an insignificant level. 2.2.4.Power considerationsLight generation is one of the main power consumption parts of the proposed system. Turning on every LED on the helmet at the same time would require a large transient current and amount to a considerable energy waste. A time multiplexing strategy was thus used. Additionally, every time a light source is turned on, every detector coupled to it records a sample, reducing the illumination time and saving energy. With wireless communication being power hungry, the data rates transferred were minimized by using data averaging on the NIRS data, but not on EEG data, before sending it to the computer. This strategy reduced the number of NIRS samples sent by a factor of 8 without a significant complexity increase. 2.2.5.Safety considerationsIsolation from the power supplies was achieved by powering the system with a battery. When communicating with a USB cable, an optical isolation circuit protects the patient against computer malfunction. In wireless mode, optical isolation is not necessary. The trigger signal used for EEG experiments was also electrically isolated from the computer by optical means. The use of high voltage to bias the APDs on the head needed special care to ensure safe operation of the device. First, each detection board, containing an APD, was encapsulated in a custom-made nonconductive mold providing an electrical barrier and preventing any physical contact with the APD case and pins or high voltage traces. This electrical isolation also has a functional use for the system because as the APD body is grounded, applying it directly to the head would force a 0 V potential at the same time as the 2.5 V reference supplied by the EEG electrode, thus unbalancing the dc potential mapping and generating unwanted currents from the reference to the photodiode case. Furthermore, additional protection in case of high voltage wire rupture was provided with the use of current-limiting resistors placed directly at the output of the high voltage regulator. Finally, a high-voltage regulation capacitor was used with the APD. In case of sudden system failure, accumulated charge could possibly hurt the subject. The allowed accumulated energy by the IEC601.1 standard is 2 mJ and the capacitor was chosen accordingly. The EEG electrodes which are attached on the head with conductive paste create a low impedance contact to the device. Current-limiting resistors were added to comply with the IEC601.1 regulation regarding leakage currents from parts in contact with the patient. While existing systems were used to guide component values, the leakage current was measured to be 15 μA, which is slightly over the IEC601.1 recommendation. This element will be addressed in the next version of the system. Even if LEDs do not represent a direct danger for the eye as lasers do, tissue damage can happen when high illumination power is used. Semiconductor heating seems to be the predominant hazard in this application and is discussed in Refs. 31 and 32. Time multiplexing the LEDs helps to maintain tissue heating at a safe level. As the LEDs used in our system are from the same company and product series as in Ref. 32, we used these results to evaluate the heating effects of this prototype. Since the mean irradiance generated with maximum illumination power was 14.8 mW/cm2 for our system and Ref. 32 evaluates the heating effect between 12 and 25 mW/cm2, we expect an absolute maximum temperature increase of less than 4 °C in vivo. 3.Methods3.1.EEG PhantomThe EEG amplification chain was tested using a resistive phantom similar to those described in Ref. 33. Square pulses with amplitude of 40 μV peak-to-peak and frequency ranging from 1 to 8 Hz were injected to validate proper signal representation. The input referred noise was also measured. The EEG over NIRS intermodality crosstalk, which is the influence of the EEG signals on the NIRS recorded signal, was also measured. The method described in the last paragraph was repeated while the NIRS signal was also recorded. During that test, the NIRS detector was kept in the dark in order to obtain only the NIRS noise floor to which the crosstalk signal was added. Several patterns and stimulation frequencies were used to validate that the signal observed was not coming from other parasitic sources. The result was computed using the ratio of measured voltage for NIRS, post-amplification, overmeasured voltage for EEG, and post-amplification. 3.2.NIRS PhantomThe NIRS signal chain was tested with an optical phantom made of polyester resin, to which India ink was added as an attenuation agent and TiO2 as a diffusive agent. The phantom's absorption coefficient at 758 nm was measured to be 0.017 mm−1 and its diffusion coefficient 0.7 mm−1, similar to results published in Ref. 34 for the human forehead. A single detector was coupled to a single light source, separated by a distance of 4 cm. First, different light intensities and avalanche gains were applied to study the influence of these factors on baseline value and noise amplitude to dc level ratio (NDCR). The NDCR is meaningful because the signals of interest for this application typically have peak-to-peak amplitude of 1% of the dc value. To ensure good data quality, the NDCR should be well under 1%. Then a 1 Hz sinusoidal light signal similar to in vivo signals was injected in the phantom to compute the signal-to-noise ratio (SNR) with various avalanche gains. Additionally, baseline signals were acquired in vivo on the frontal and visual cortices of two adult subjects with the same source-detector separation distance and light intensity with different avalanche gains to compare to the previous findings with phantoms. The NIRS over EEG intermodality crosstalk was measured with the same optical phantom. The light source was supplied with an external power supply and source generator to validate that the crosstalk was coming from the detection stage and not from the current spikes described in Sec. 2.2.3. Light sources connected to the prototype during that test were not emitting. Several signal shapes and frequencies were used to validate that the signal observed was not coming from other parasitic sources. The result was computed using the ratio of measured voltage for EEG, post-amplification, overmeasured voltage for NIRS, and post-amplification. 3.3.Combined EEG-NIRS Visual TaskValidation of the whole system was made using an 8-channel version of the prototype with 5 healthy adult subjects and the protocol was approved by the Ecole Polytechnique de Montreal Ethics Committee. An informed consent form explaining the various aspects of the protocol was signed by every subject and all questions and concerns were answered by the main author of this paper. In vivo signals were recorded on the primary visual cortex using 4 EEG electrodes, 7 NIRS detectors, and 8 light sources, for a total of 20 NIRS channels. Electrodes were positioned on standard 10-20 and 10-10 locations: O1, O2, Oz, and POz. NIRS optodes were placed as illustrated in Fig. 3a with an average source-detector distance of 3.1 cm. This shorter distance compared to phantom tests was used in order to get good amplitude signal even with dark or long haired subjects. The 8th detection channel was used to record the trigger signal to synchronize the EEG evoked potentials with the visual stimuli. Fig. 3In vivo measurements: (a) Placement of electrodes and optodes on the subject, where electrodes are placed at standard positions O1, O2, Oz, and POz; (b) procedure for pattern reversal task. Subjects were asked to gaze at a screen in front on them. Each stimulation period of 30 s was followed by a rest period of 15 s. Pattern reversals occurred at a rate of 8 Hz for a total of approximately 240 pattern reversals per stimulation period. Each recording time consisted of 10 stimulation and 10 rest periods.  A visual pattern reversal task was performed by subjects 3 to 5 to generate EEG and NIRS activations simultaneously (subjects 1 and 2 did not perform that task). The subjects were sitting in front of a computer screen, at a distance of 55 cm, in a dimly lit room, and a baseline was recorded during 30 s. A black and white checkerboard, with every square spanning 3 deg to 4 deg in the field of view, was then displayed with pattern reversal happening at a frequency of 8 Hz for 30 s. A rest period of 15 s followed, and this pattern reversal-rest routine was repeated 10 times to allow averaging. VEPs for EEG were obtained by averaging all the moments where pattern reversal happened, which is approximately 480 times per stimulation period. Considering the first checkerboard used a contrast of 100%, as defined in Ref. 25, another acquisition was made using pattern reversal at 8 Hz and a contrast of 10%. In order to verify if contrast variation effects could be detected at other stimulation frequencies, subject 4 was stimulated at a 4 Hz reversal frequency. A second protocol was used on the 5 subjects using a windmill pattern, as described in Refs. 25 and 35, spanning 70 deg on the screen. Pattern reversal at 4 Hz was applied with the same timing parameters as the first protocol. This protocol was repeated 4 times by rotating the pattern by 90 deg so the 4 quadrants of the screen were covered (lower left, lower right, upper left, upper right). These parameters were used in order to verify the repeatability of experimental protocols used in the literature25, 35, 36 with this portable system. The correlation between the VEP amplitude and NIRS response amplitude was also computed.37 The power consumption of the system was measured during acquisition at minimum and maximum illumination power. Communication of data in real time was done using a USB cable. Power consumption for each subsystem was measured and estimations for the 32 channel version of the prototype were computed. 4.Results4.1.EEG PhantomThe curves obtained for the square pulses, as shown in Fig. 4a, injected in the resistive phantom show an amplitude of approximately 40 μV peak-to-peak and the correct expected shape. Strong digital finite impulse response filtering at 35 Hz had to be applied because a high amplitude 60 Hz component and other harmonics were present. The input referred noise was measured to be 0.36 μVrms once the 35 Hz filter was applied. Fig. 4(a) Typical results for resistive phantom measurements, referred to as the input. Low-pass filtering was applied at 35 Hz in order to remove the strong 60 Hz artifact. Typical results for NIRS phantom measurements for sinusoidal physiology-like stimulation (b) with no avalanche gain. The signal is distorted and has an SNR of 4.6 dB. (c) An avalanche gain of 19. The signal has a SNR of 18.9 dB. 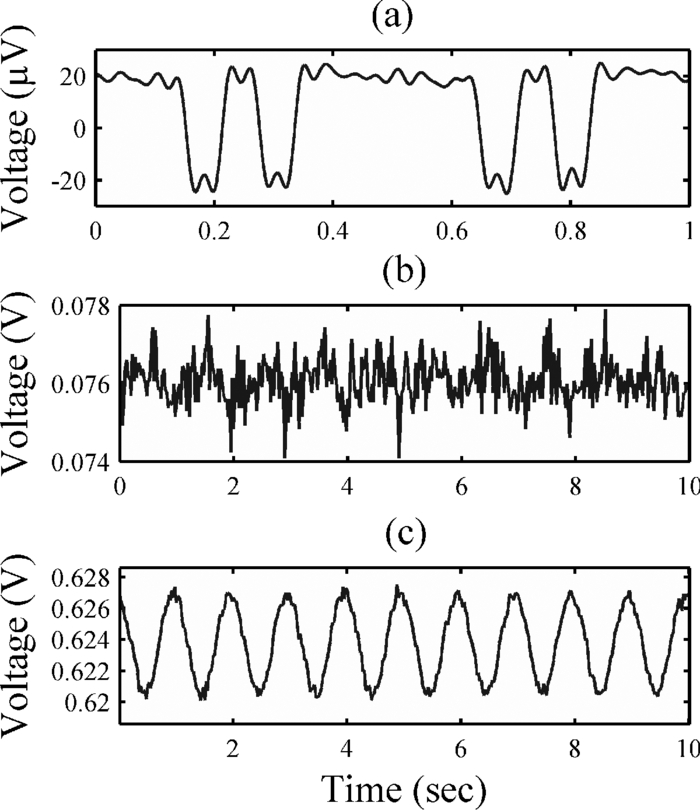 The EEG to NIRS intermodality crosstalk was measured to be always less than 70 dB. EEG stimulation of at least 100 μVpp had to be used in order to obtain a measurable crosstalk signal. 4.2.NIRS PhantomTable 1 shows results for the NIRS phantom used with the standard illumination strategy at different intensities and avalanche gain. The dc voltage and noise values at the ADC are followed by the NDCR ratio. For a fixed avalanche gain, higher illumination power yields a stronger dc output and better NDCR ratio. For constant light intensity, higher avalanche gain results in a stronger dc level. The absolute noise level and NDCR ratio in function of avalanche gain seem to respond in a nonlinear fashion and optimal results are found with an avalanche gain of 19 and a lighting power of 45 mW. It should be mentioned that the values mentioned for the avalanche gain are estimations based on the bias voltage applied to the APD. As the room temperature was controlled during the acquisitions and the experimental setup was stable for all measurements, this estimation is considered to be reasonably accurate. Also, the dc levels of 5000 mV indicate that there was amplifier saturation because of too much light reaching the detector. Fig. 8NIRS topographic reconstruction of HbO2 for subjects 1 to 5 for the lower right visual field stimulation. The x and o elements in the HbO2 and HbR columns represent the position of NIRS light sources and detectors, respectively.  Table 1NIRS phantom results with pulsed light.
Table 2 shows the phantom results obtained with physiology-like light injection (1 Hz sine wave, amplitude at 1% of the dc level) and different avalanche gains. This stimulation was used because it is very similar to the heart beat which is the predominant feature of the NIRS signal. The dc level of the signal increases with avalanche gain as shown in Table 1. SNR was computed by isolating the 1 Hz sine wave with a digital filter and considering the remaining oscillations as noise. The use of avalanche gain significantly increases the SNR. Figures 4b, 4c show typical curves obtained in linear and avalanche mode, respectively. The effect of the averaging function of the system is measured to increase SNR by 4.7 dB by taking 4 NIRS samples per channel and averaging them every time a light source is activated instead of one. Figure 5a shows how the averaging function works. Fig. 5(a) Schematic illustration of time multiplexed illumination and detection for one NIRS channel. When averaging is activated, samples x 1 to x 4 are averaged by the FPGA and only one sample is sent to the computer. When averaging is turned off, only sample x 4 is used. Samples x 5 to x 8 are used to further reduce the contribution of ambient light to the signal. This was not used for the results presented in this paper. (b) dc level of phantom results compared to in vivo baseline levels at the same illumination power and source-detector distance. (c) SADC ratio for phantom and in vivo results. 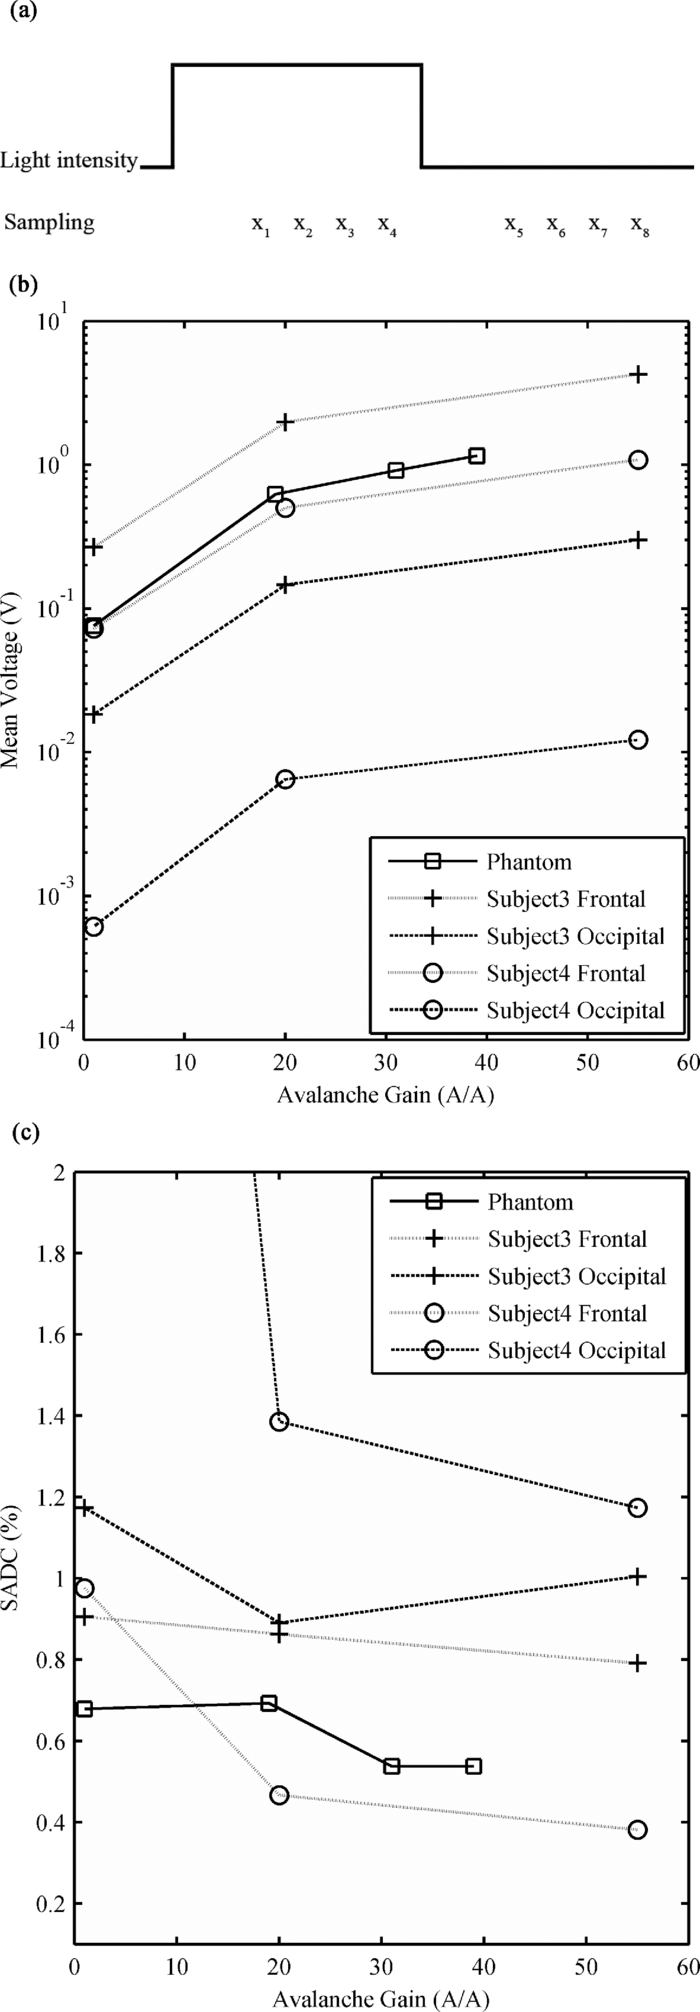 Table 2NIRS phantom results with physiology-like stimulation.
Figures 5b, 5c compare phantom results with in vivo measures on the frontal and occipital cortex for a shaved subject (subject 3) and for a subject with short but dense red hair (subject 4). These subjects were chosen to show the high intersubject variability of signal attenuation depending on the hair factor. Figure 5b shows the dc levels for phantom and in vivo data, which informs on light absorption of the medium crossed by light. Intrasubject variations of up to 2 orders of magnitude were found between the frontal and occipital cortices. Intersubject variations were found to be over 1 order of magnitude. The phantom had similar optical properties to the in vivo frontal cortex. Figure 5c uses the signal of interest's amplitude over dc level (SADC) ratio, which gives an indication of the validity of the protocol used to find the SNR of the system when comparing phantom to in vivo curves. For the phantom, the amplitude of the signal of interest was found by applying a 1 Hz notch filter and then computing the amplitude. For in vivo results, that value was found by applying a 0.8 Hz high-pass filter in order to keep only the heart-beat signal and the high frequency noise. The amplitude was then computed. SADC ratios found are close to 1%, as stated in literature38 for the adult human brain. The NIRS to EEG intermodality crosstalk was measured to be 20 dB. 4.3.Combined EEG-NIRS Visual TaskThe raw data for EEG was treated with EEGLAB,39 an open source toolbox for MATLAB. Every channel was bandpass filtered between 1 and 40 Hz and all events were averaged for each subject. Figure 6 shows averaged VEPs for all the acquisitions (subjects 3 to 5), using the flashing checkerboard protocol reversing at 8 Hz for subjects 3 and 5 and 4 Hz for subject 4 for contrasts of 10% and 100% at electrode POz. Error bars are not shown but the standard deviation found between trials is similar for all subjects, ranging from 9.3 to 10.6 μV. The standard error being greater than the signal of interest explains why so many trials are necessary to obtain good results. Fig. 6Effect of contrast on neuronal response measured by NIRS and EEG with contrasts of 10% and 100% for subjects 3 to 5 [(a)–(c), respectively]. In NIRS figures, bold lines represent HbO2 and dashed lines represent HbR. Error bars show the standard deviation for the variations throughout the 10 averaged stimulation blocks. In EEG figures, timing was adjusted to show the main peak of the VEP, between 90 and 120 ms.  The raw data for NIRS was processed with HOMER,40 an open source toolbox for MATLAB. Every channel was bandpass filtered between 0.005 and 0.1 Hz and with a principal component analysis filter, removing the first eigenvector component, helping to reduce the effect of motion artifacts, temperature variations, and other interchannel covariant data. A differential pathlength factor correction was also applied to generate concentration values. Averaging was applied to each stimulation block. Figure 6 shows the averaged hemodynamic response for HbO2 and HbR for subjects 3 to 5 for the low and high contrast checkerboard protocol. The values of VEPs and NIRS averaged responses were computed for subjects 3 to 5 and are shown in Table 3. For VEPs, the rms value for the curve shown in Fig. 6 was used, and for NIRS the mean concentration variation for the 0 to 45 s period was used. Table 3Value of VEPs and NIRS response to contrast variations.
To confirm spatial localization of the activations, topographic reconstruction using a back-projection algorithm provided in HOMER was done for HbO2 and HbR for all 5 subjects. Figure 7 shows results from subject 3 for the checkerboard high contrast protocol compared with lower visual field protocols. Activation in both hemispheres was observed for the checkerboard protocol as well as lateralized activations for the lower field protocol. Lateralized activations respectively correspond spatially with those generated by the checkerboard stimuli. Upper visual field results are not shown as significant activation was difficult to reproduce between subjects. Figure 8 shows the HbO2 topographic reconstruction for the lower left visual field stimulations for subjects 1 to 5 to illustrate reproducibility. Fig. 7NIRS topographic reconstruction for subject 3 showing block averaged HbO2 and HbR concentration variations (units in meters). The x and o elements in the HbO2 and HbR columns represent the position of NIRS light sources and detectors, respectively. (a) Checkerboard protocol with 100% contrast. (b) Windmill pattern protocol for lower left visual field. (c) Windmill pattern protocol for lower right visual field. 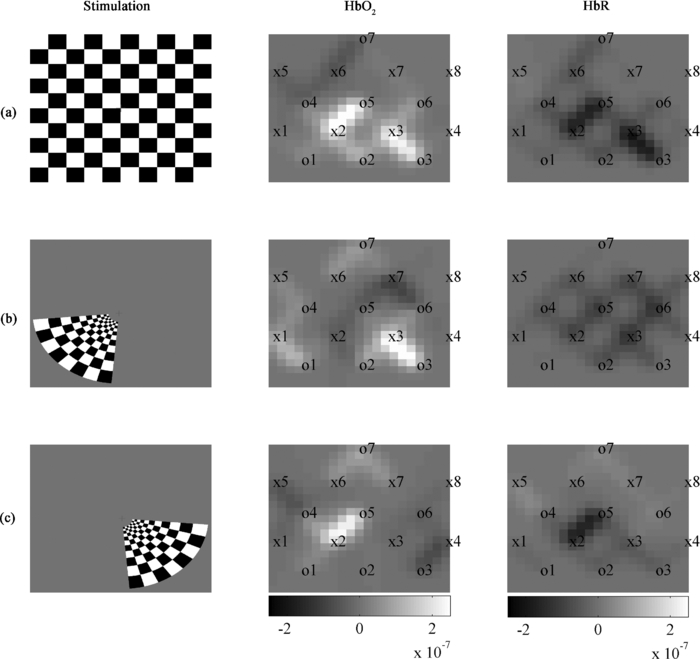 Table 4 shows the results of measured power consumption for the various parts of the prototype and the estimations for the future 32-channel system. The prototype autonomy with the actual battery, at the time of publication, has been validated for over 30 h of continuous acquisition at maximum illumination power and is expected to reach 40 h (complete battery discharge test still has to be done). With the actual configuration and architecture, the 32-channel system is expected to reach 15 h of autonomy. The battery used for testing was a 7.4V Li-Ion technology with a 10 Ah capacity. It weighed 404 g with dimensions of 7.6 × 8.0 × 4.0 cm3. Table 4Power consumption measurements and estimations.
5.Discussion5.1.EEG PhantomThe results for the EEG amplification chain corresponded well to what was expected from the device. However, the high level of electromagnetic noise in the measurement environment introduced wide amplitude 60 Hz oscillations that had to be filtered digitally. As was seen in ulterior testing (in vivo data for subject 1), acquiring data was a lot easier when a Faraday cage setup was available. It should be kept in mind that clinical settings do not always allow optimal measuring conditions possible and thus, optimization of the power supply rejection ratio and cable shielding should be evaluated in order to get better performance. The input referred noise is sufficiently low to provide good quality measurements when an EEG bandwidth up to 35 Hz is sufficient, which is the case in most clinical situations. As stated above, the 60 Hz interferences, with harmonics at 120 Hz, strongly affect the quality of measurements in noisy environments. The influence of EEG signals on NIRS was minimal and is not expected to affect the quality of data. 5.2.NIRS PhantomData found in Table 1 suggests that an increase in illumination power or avalanche gain produces a better NDCR, leading to better SNR. As illumination accounts for nearly half of the power consumption of the system in this context and a higher avalanche gain produces marginal consumption increase, using high avalanche gain and the lowest possible light power was best suited for this application. Table 2 shows significant SNR improvement when using an avalanche gain instead of using the APD in linear mode. However, the SNR only slightly changed when going from an avalanche gain of 19 to 40. This is a known effect and is explained by the increase of dark current noise when increasing bias voltage. Comparison of phantom results with in vivo baseline dc signals suggests that the phantom used provides a reasonably good model for NIRS applied to adult subjects in the frontal area. However, it represents an optimistic solution when the device should be sensitive enough for hair-covered areas as the visual cortex. A higher absorption coefficient might help to reflect that factor. The high intrasubject and intersubject variability found in dc levels also confirms the need for a wide dynamic range and calls for flexibility in terms of illumination power and avalanche gain. Concerning the SADC ratio, results found for the phantom are similar to the frontal in vivo data. This suggests that injecting a sinusoidal signal of 1% the dc level in the phantom reflects reasonably well in vivo results and can be used as a simple tool to evaluate the sensitivity of the detectors and amplification chain in cw NIRS systems. It should be noted that it does not take into account the effects of light source multiplexing as the illumination signal used is continuous. For the phantom and both subjects, the SADC ratio had a tendency to decrease as avalanche gain was increased, probably because SNR increases, minimizing the contribution of noise to the ratio. That tendency was most noticeable with the red-haired subject, where signals had a higher noise level, mostly when no avalanche gain was used, due to higher light absorption and lower detected intensity. The crosstalk of NIRS signal over EEG was significant and that aspect will be studied in detail for the next version of the system. However, as the NIRS signals are typically strongly attenuated by the brain tissues and the detected light power is small, the impact on in vivo signal quality for EEG was acceptable considering that digital filtering was applied. 5.3.Combined EEG-NIRS Visual TaskThe checkerboard pattern reversal protocol was used to evaluate the effect of contrast on the strength of response in EEG and NIRS. In the case of VEPs, the higher peak amplitudes found for higher contrast in all three subjects is in agreement with Refs. 25 and 41. Results found for subjects 3 and 5 are similar in timing and the amplitude difference might be caused by intersubject variability and electrode placement bias. For these subjects, the N75, P100, and N145 peaks, as described in Ref. 42, can be observed in Fig. 6. VEPs for subject 4 showed similar response intensity and shape, but the timing is slightly different and that could be caused by the different reversal frequency used for this subject. Timing and amplitude variation between subjects and compared to other results found in literature could be caused by experimental protocol variations such as check size,42 stimulation frequency,43 and intensity,44 but also by attention level variability.45 NIRS results also show concordance with published studies. Increasing contrast generated an increase in HbO2 and decrease in HbR, as expected in Refs. 25 and 41. It should be noted that no partial volume correction was applied to data and according to Ref. 46, this fact might explain an underestimation of more than 50% of the concentration variations reported here. Subject 4 showed high variability and poor HbR response in his results that could have been caused by lower reversal frequency or variations in the experimental setup, which included a higher level of ambient light and more sources of distraction in the surroundings. On the other hand, subjects 3 and 5 show similar responses in timing and intensity for both HbO2 and HbR and are in agreement with the results of Ref. 25. Topographic reconstructions for localization of activated areas showed good correlation between the activation of the whole visual field and the lower left or right fields. The lower left and right visual field stimulation results corresponded well with Ref. 35, with respect to the localization of activation for 4 out of 5 subjects. Subject 4 showed poor result quality for the same reasons mentioned above. Upper visual field activations were less reproducible between subjects. The possible cause might be that the activation zone is smaller in that case, generating a smaller signal that might not be strong enough to measure, considering the relatively small number of stimulation blocks used. Furthermore, considering the low detector density in this experiment, the lack of reproducibility might also be caused by not adequately covering the activated area in some subjects. As can be observed in Fig. 8, activation location varies from one subject to the other. For subjects 2, 3, and 5, the activated zone is clearly located between source 2 and detector 5. For subject 1, the imaging zone was probably shifted to the left. This hypothesis is supported by the fact that activation for the lower left visual field generated activation between source 7 and detector 6. As stated before, the hemodynamic response quality for subject 4 is considered poor. The repeatability of VEPs and NIRS activations between subjects varied depending on the protocol. VEPs obtained for the contrast study showed good correlation with literature in shape and timing. Occipital cortex activation was observed in EEG and NIRS for all subjects, but the amplitude of response varied significantly, mostly in NIRS. That variability seems to be frequent with this modality and can be partly explained in this case by a relatively low SNR, intersubject physiological variability, and spatial variations in optode locations, as stated in Ref. 36. NIRS topography could be repeated with success on 80% of our subjects, even if subjects 1 and 2 were stimulated with different reversal frequencies (respectively, 1 and 2 Hz). A quiet and dimly lit experimental environment with a low level of electromagnetic interference was not always available and will be used for further experiments in order to increase the significance of our results. With a 10 Ah high density Li-ion battery supplying 7.4 V, the autonomy of the prototype that was measured to be more than 30 h, which is enough for clinical applications. Early estimations for a 32-channel version of this system indicate that power consumption optimizations will be necessary to reach the 24 h autonomy objective. Considering the energy needs of the different subsystems involved, the efforts will have to concentrate mostly on the light sources and on the FPGA PCB. Minimizing the illumination power needed by increasing the detection sensitivity and minimizing the light pulsing duration are the first steps toward reaching those objectives. 6.ConclusionIn order to meet the requirements of a portable functional brain imaging system capable of simultaneous EEG and NIRS measurements, a system designed to eventually acquire up to 32 EEG electrodes, 32 light sources, and 32 detectors for NIRS was proposed. We confirmed that this novel portable device was capable of high sensibility, complete head coverage, and sufficient autonomy for clinical applications. The results obtained on a reduced channel count prototype show good concordance with existing literature and suggest performance levels that are reasonable for clinical applications. Following some minor adjustments, the actual prototype will be used for preliminary testing in epilepsy and stroke applications. Future efforts will concentrate on improving the performances of the device for the clinical environment. First, EEG and NIRS sensibility and crosstalk will be optimized with a focus on electronics but also by designing a new helmet which will enable better electrical and optical coupling. Various techniques will then be applied to reduce the power consumption of the system and PCB physical footprint. AcknowledgmentsThe authors acknowledge support from the Fonds Quebecois de Recherche sur la Nature et les Technologies (FQRNT), the Canadian Institutes of Health Research (CIHR), the Institute of Circulatory and Respiratory Health (ICRH), and the Heart and Stroke Foundation of Canada (HSFC). ReferencesF. F. Jöbsis,
“Noninvasive, infrared monitoring of cerebral and myocardial oxygen sufficiency and circulatory parameters,”
Sciences (New York), 198
(4323), 1264
–1267
(1977). https://doi.org/10.1126/science.929199 Google Scholar
A. Yodh and
B. Chance,
“Spectroscopy and imaging with diffusing light,”
Phys. Today, 48
(3), 34
–40
(1995). https://doi.org/10.1063/1.881445 Google Scholar
A. Maki, Y. Yamashita, Y. Ito, E. Watanabe, Y. Mayanagi, and
H. Koizumi,
“Spatial and temporal analysis of human motor activity using noninvasive NIR topography,”
Med. Phys., 22
(12), 1997
–2005
(1995). https://doi.org/10.1118/1.597496 Google Scholar
G. Strangman, D. A. Boas, and
J. P. Sutton,
“Non-invasive neuroimaging using near-infrared light,”
Biol. Psychiatry, 52
(7), 679
–693
(2002). https://doi.org/10.1016/S0006-3223(02)01550-0 Google Scholar
A. Villringer and
B. Chance,
“Non-invasive optical spectroscopy and imaging of human brain function,”
Trends Neurosci., 20
(10), 435
–442
(1997). https://doi.org/10.1016/S0166-2236(97)01132-6 Google Scholar
G. Strangman, R. Goldstein, S. L. Rauch, and
J. Stein,
“Near-infrared spectroscopy andimaging for investigating stroke rehabilitation: Test-retest reliability and review of the literature,”
Arch. Phys. Med. Rehabil., 87
(12), 12
–19
(2006). https://doi.org/10.1016/j.apmr.2006.07.269 Google Scholar
C. Terborg, S. Bramer, S. Harscher, M. Simon, and
O. W. Witte,
“Bedside assessment of cerebral perfusion reductions in patients with acute ischaemic stroke by near-infrared spectroscopy and indocyanine green,”
J. Neurol. Neurosurg. Psychiatry, 75
(1), 38
–42
(2004). Google Scholar
E. Watanabe, A. Maki, F. Kawaguchi, Y. Yamashita, H. Koizumi, and
Y. Mayanagi,
“Noninvasive cerebral blood volume measurement during seizures using multichannel near infrared spectroscopic topography,”
J. Biomed. Opt., 5
(3), 287
–290
(2000). https://doi.org/10.1016/S0896-6974(98)00037-1 Google Scholar
E. Watanabe, Y. Nagahori, and
Y. Mayanagi,
“Focus diagnosis of epilepsy using near-infrared spectroscopy,”
Epilepsia, 43 50
–55
(2002). https://doi.org/10.1046/j.1528-1157.43.s.9.12.x Google Scholar
D. K. Sokol, O. N. Markand, E. C. Daly, T. G. Luerssen, and
M. D. Malkoff,
“Near infrared spectroscopy (NIRS) distinguishes seizure types,”
Seizure, 9
(5), 323
–327
(2000). https://doi.org/10.1053/seiz.2000.0406 Google Scholar
K. Haginoya, M. Munakata, R. Kato, H. Yokoyama, M. Ishizuka, and
K. Iinuma,
“Ictal cerebral haemodynamics of childhood epilepsy measured with near-infrared spectrophotometry,”
Brain: J. Neurology, 125 1960
–1971
(2002). https://doi.org/10.1093/brain/awf213 Google Scholar
T. Hoshino, K. Sakatani, Y. Katayama, N. Fujiwara, Y. Murata, K. Kobayashi, C. Fukaya, and
T. Yamamoto,
“Application of multichannel near-infrared spectroscopic topography to physiological monitoring of the cortex during cortical mapping: technical case report,”
Surg. Neurol., 64
(3), 272
–275
(2005). https://doi.org/10.1016/j.surneu.2004.12.022 Google Scholar
S. Sumitani, T. Tanaka, S. Tayoshi, K. Ota, N. Kameoka, M. Morimune, S. Shibuya-Tayoshi, S. Kinouchi, S. Ueno, and
T. Ohmori,
“Hemodynamic changes in the prefrontal cortex during mental works as measured by multi channel near-infrared spectroscopy (NIRS),”
J. Med. Invest, 52 302
–303
(2005). https://doi.org/10.2152/jmi.52.302 Google Scholar
M. Izzetoglu, S. C. Bunce, K. Izzetoglu, B. Onaral, and
K. Pourrezaei,
“Functional brain imaging using near-infrared technology,”
IEEE Eng. Med. Biol. Mag., 26
(4), 38
–46
(2007). https://doi.org/10.1109/MEMB.2007.384094 Google Scholar
L. F. Quesney,
“Extratemporal epilepsy: clinical presentation, pre-operative EEG localization and surgical outcome,”
Acta neurologica Scandinavica, Supplementum, 140 81
–94
(1992). https://doi.org/10.1111/j.1600-0404.1992.tb04475.x Google Scholar
V. Osharina, E. Ponchel, A. Aarabi, R. Grebe, and
F. Wallois,
“Local haemodynamic changes preceding interictal spikes: A simultaneous electrocorticography (ECoG) and near-infrared spectroscopy (NIRS) analysis in rats,”
Neuroimage, 50
(2), 600
–607
(2010). https://doi.org/10.1016/j.neuroimage.2010.01.009 Google Scholar
T. H. Schwartz,
“Neurovascular coupling and epilepsy: hemodynamic markers for localizing and predicting seizure onset,”
Epilepsy Curr., 7
(4), 91
–94
(2007). https://doi.org/10.1111/j.1535-7511.2007.00183.x Google Scholar
J. Furusho, A. Suzuki, Y. Takakusa, F. Kawaguchi, N. Ichikawa, and
T. Kato,
“Simultaneous study of interictal EEG and near-infrared spectroscopy in a boy with epilepsy,”
International Congress Series, 1232 673
–676
(2002). https://doi.org/10.1016/S0531-5131(01)00698-7 Google Scholar
A. Gallagher, M. Lassonde, D. Bastien, P. Vannasing, F. Lesage, C. Grova, A. Bouthillier, L. Carmant, F. Lepore, R. Béland, and
D. K. Nguyen,
“Non-invasive pre-surgical investigation of a 10 year-old epileptic boy using simultaneous EEG-NIRS,”
Seizure, 17
(6), 576
–582
(2008). https://doi.org/10.1016/j.seizure.2008.01.009 Google Scholar
N. Roche-Labarbe, B. Zaaimi, P. Berquin, A. Nehlig, R. Grebe, and
F. Wallois,
“NIRS-measured oxy- and deoxyhemoglobin changes associated with EEG spike-and-wave discharges in children,”
Epilepsia, 49
(11), 1871
–1880
(2008). https://doi.org/10.1111/j.1528-1167.2008.01711.x Google Scholar
M. Giardini and
S. Trevisan,
“Portable high-end instrument for in-vivo infrared spectroscopy using spread spectrum modulation,”
860
–863
(2004). Google Scholar
A. Bozkurt, A. Rosen, H. Rosen, and
B. Onaral,
“A portable near infrared spectroscopy system for bedside monitoring of newborn brain,”
Biomed. Eng. Online, 4 29
(2005). https://doi.org/10.1186/1475-925X-4-29 Google Scholar
H. Atsumori, M. Kiguchi, A. Obata, H. Sato, T. Katura, K. Utsugi, T. Funane, and
A. Maki,
“Development of a multi-channel, portable optical topography system,”
3362
–3364
(2007). Google Scholar
M. Moosmann, P. Ritter, I. Krastel, A. Brink, S. Thees, F. Blankenburg, B. Taskin, H. Obrig, and
A. Villringer,
“Correlates of alpha rhythm in functional magnetic resonance imaging and near infrared spectroscopy,”
Neuroimage, 20
(1), 145
–158
(2003). https://doi.org/10.1016/S1053-8119(03)00344-6 Google Scholar
L. Rovati, G. Salvatori, L. Bulf, and
S. Fonda,
“Optical and electrical recording of neural activity evoked by graded contrast visual stimulus,”
Biomed. Eng. Online, 6 28
(2007). https://doi.org/10.1186/1475-925X-6-28 Google Scholar
A. J. Casson, D. C. Yates, S. J. M. Smith, J. S. Duncan, and
E. Rodriguez-Villegas,
“Wearable Electroencephalography,”
IEEE Eng. Med. Biol. Mag., 29
(3), 44
–56
(2010). https://doi.org/10.1109/MEMB.2010.936545 Google Scholar
H. Sato, M. Kiguchi, and
A. Maki,
“Wavelength dependence of effective pathlength factor in noninvasive optical measurements of human brain functions,”
Jpn. J. Appl. Phys., Part 2, 45
(12–16), L361
–L449
(2006). https://doi.org/10.1143/JJAP.45.L361 Google Scholar
H. Atsumori, M. Kiguchi, A. Obata, H. Sato, T. Katura, T. Funane, and
A. Maki,
“Development of wearable optical topography system for mapping the prefrontal cortex activation,”
Rev. Sci. Instrum., 80
(4), 043704
(2009). https://doi.org/10.1063/1.3115207 Google Scholar
R. Oostenveld and
P. Praamstra,
“The five percent electrode system for high-resolution EEG and ERP measurements,”
Clin. Neurophysiol., 112
(4), 713
–719
(2001). https://doi.org/10.1016/S1388-2457(00)00527-7 Google Scholar
Texas Instruments Incorporated, “Medical Applications Guide,”
20
(2007) Google Scholar
C. Soraghan,
“Development of a versatile multichannel CWNIRS instrument for optical brain-computer interface applications,”
(2010) Google Scholar
A. Bozkurt and
B. Onaral,
“Safety assessment of near infrared light emitting diodes for diffuse optical measurements,”
Biomed. Eng. Online, 3 9
(2004). https://doi.org/10.1186/1475-925X-3-9 Google Scholar
H. Gagnon, M. Cousineau, A. Adler, and
A. E. Hartinger,
“A resistive mesh phantom for assessing the performance of EIT systems,”
IEEE Trans. Biomed. Eng., 57
(9), 2257
–2266
(2010). https://doi.org/10.1109/TBME.2010.2052618 Google Scholar
E. Gratton, S. Fantini, M. A. Franceschini, G. Gratton, and
M. Fabiani,
“Measurements of scattering and absorption changes in muscle and brain,”
Philos. Trans. R. Soc. London, Ser. B, 352
(1354), 727
–735
(1997). https://doi.org/10.1098/rstb.1997.0055 Google Scholar
B. W. Zeff, B. R. White, H. Dehghani, B. L. Schlaggar, and
J. P. Culver,
“Retinotopic mapping of adult human visual cortex with high-density diffuse optical tomography,”
Proc. Natl. Acad. Sci. U.S.A., 104
(29), 12169
–12174
(2007). https://doi.org/10.1073/pnas.0611266104 Google Scholar
V. Y. Toronov, X. Zhang, and
A. G. Webb,
“A spatial and temporal comparison of hemodynamic signals measured using optical and functional magnetic resonance imaging during activation in the human primary visual cortex,”
Neuroimage, 34
(3), 1136
–1148
(2007). https://doi.org/10.1016/j.neuroimage.2006.08.048 Google Scholar
H. Obrig, H. Israel, M. Kohl-Bareis, K. Uludag, R. Wenzel, B. Müller, G. Arnold, and
A. Villringer,
“Habituation of the visually evoked potential and its vascular response: Implications for neurovascular coupling in the healthy adult,”
Neuroimage, 17
(1), 1
–18
(2002). https://doi.org/10.1006/nimg.2002.1177 Google Scholar
S. Coyle, T. Ward, and
C. Markham,
“Physiological noise in near-infrared spectroscopy: implications for optical brain computer interfacing,”
4540
–4543
(2004). Google Scholar
A. Delorme and
S. Makeig,
“EEGLAB: an open source toolbox for analysis of single-trial EEG dynamics including independent component analysis,”
J. Neurosci. Methods, 134
(1), 9
–21
(2004). https://doi.org/10.1016/j.jneumeth.2003.10.009 Google Scholar
T. J. Huppert, S. G. Diamond, M. A. Franceschini, and
D. A. Boas,
“HomER: A review of time-series analysis methods for near-infrared spectroscopy of the brain,”
Appl. Opt., 48
(10), D280
–D298
(2009). https://doi.org/10.1364/AO.48.00D280 Google Scholar
M. Zaletel, M. Strucl, T. Pogacnik, and
B. Zvan,
“Effects of visual contrast on visual evoked potentials and Doppler signal,”
Eur. J. Neurosci., 19 3353
–3358
(2004). https://doi.org/10.1111/j.0953-816X.2004.03448.x Google Scholar
S. Kurita-Tashima, S. Tobimatsu, M. Nakayama-Hiromatsu, and
M. Kato,
“Effect of check size on the pattern reversal visual evoked potential,”
Electroencephalogr. Clin. Neurophysiol., 80
(3), 161
–166
(1991). https://doi.org/10.1016/0168-5597(91)90118-H Google Scholar
C. S. Herrmann,
“Human EEG responses to 1-100 Hz flicker: resonance phenomena in visual cortex and their potential correlation to cognitive phenomena,”
Exp. Brain Res., 137 3
–4
(2001). https://doi.org/10.1007/s002210100682 Google Scholar
C. R. Lines, M. D. Rugg, and
A. D. Milner,
“The effect of stimulus intensity on visual evoked potential estimates of interhemispheric transmission time,”
Exp. Brain Res., 57
(1), 89
–98
(1984). https://doi.org/10.1007/BF00231135 Google Scholar
K. S. Rauss, G. Pourtois, P. Vuilleumier, and
S. Schwartz,
“Attentional load modifies early activity in human primary visual cortex,”
Hum. Brain Mapp, 30
(5), 1723
–1733
(2009). https://doi.org/10.1002/hbm.20636 Google Scholar
T. Durduran, G. Yu, M. G. Burnett, J. A. Detre, J. H. Greenberg, J. Wang, C. Zhou, and
A. G. Yodh,
“Medical optics and biotechnology - diffuse optical measurement of blood flow, blood oxygenation, and metabolism in a human brain during sensorimotor cortex activation,”
Opt. Lett., 29
(15), 1766
–1768
(2004). https://doi.org/10.1364/OL.29.001766 Google Scholar
|
||||||||||||||||||||||||||||||||||||||||||||||||||||||||||||||||||||||||||||||||||||||||||||||||||||||||||||||||||||||||||||||||||||||||||||||||||||||||||||||||||||||||||||||||||||||||||||||||||||||||||||||||||||||||


