

|
|
|
Disturbances of respiratory gas exchange are common in clinic. The most serious consequence is an inadequate supply of oxygen to the brain, leading to severe brain dysfunction. Hyperoxic ventilation has been proposed as a means to augment tissue oxygenation.1 During these pathological and/or preventative processes, the cerebral blood flow (CBF), being the oxygen carrier, is regulated and may modulate in response to changes in neuronal activity.2 Blood-flow response to oxygen perturbation in brain tissue, in general, has been studied by such techniques as hydrogen clearance technique,3 Doppler ultrasound,4 and functional magnetic resonance imaging (MRI).5 Although limited in their spatial resolution, these previous studies have improved our understanding of the hyperemic responses of CBF to hypoxia and anemic responses of CBF to hyperoxia; however, the associated changes in microvascular CBF (mCBF) are less understood.6 In particular, it is not clear to what extent the changes in microvascular density or microvascular flow rate can compensate for the physiological disturbance (hypoxia or hyperoxia) in brain tissue. Attempts have been made by intravital microscopic6 and microfilming7 studies through preparation of a closed cranial window and the use of fluorescently labeled red blood cells (RBCs) as flow markers; yet, it is difficult to elucidate, systematically, the effects of hypoxia and hyperoxia on the regulation of cerebral microcirculation. Thus, there is a clear need for a technique that can noninvasively monitor and directly measure the changes of microcirculation within cerebral microvascular beds so that the understanding of the microvascular mechanism of mCBF can be improved. The objective of this study is to demonstrate how the mCBF under acute systemic hypoxia and hyperoxia can be analyzed by use of a newly developed optical angiographic approach that enables in vivo imaging of cortical microvasculatures. As a novel extension of optical coherence tomography (OCT) technology, optical microangiography (OMAG),8, 9 is a new imaging modality capable of generating 3-D images of cortical cerebral blood perfusion distribution, and this is achieved with the cranium left intact. OMAG produces imaging contrasts via endogenous light scattering from flowing RBCs within open vessels; thus, it is a label-free imaging technology. Recent OMAG development has improved the system sensitivity to blood flow as low as ∼4 μm/s, which is sufficient to measure the capillary flows within tissue beds.9 In order to evaluate flow velocity, however, it is required to apply the phase-resolved Doppler technique10 to the OMAG flow signals so that the differential phase values (thus, the axial velocity) are extracted.11 However, the axial velocity information based on mean frequency shift has significant limitations. These limitations include Doppler angle dependence, aliasing, and difficulty in separating the true flow signal in slow-flow state (e.g., capillaries) from the noise background. In addition, the Doppler frequency shifts caused by noncapillary (>20 μm diam) flow in fast-flow state are unavoidably phase wrapped, which makes it difficult to obtain the true velocity values. In an attempt to overcome these limitations, in this study, we propose to use the “power Doppler” concept,12 a widely used approach in color Doppler ultrasound modality, to analyze the OMAG flow signals. Analogous to power Doppler ultrasound, the flow signals (i.e., optical reflectance) generated by OMAG indeed demonstrate the integrated power of the Doppler signal;8 this power is related to the number of RBCs flowing across light beam within a unit time,13 which can be referred to as flux (sometimes also termed as blood flow, flow rate, or perfusion rate in literature). As an alternative means of demonstrating cerebral hemodynamics, we use OMAG flow signals (i.e., power signals) to track the changes of detailed microvascular flow and analyze the relationship between mCBF responses in mice subject to the physiological challenge of O2 inhalation. Because OMAG is very sensitive to the slow blood flow, we will show that how convenient and valuable it is to monitor microhemodynamic activities of mCBF in both slow- and fast-flow states when the estimation of absolute velocity value is not necessary. The system used to monitor cerebral microhemodynamics is similar to that used in our previous work.9 Briefly, a superluminescent diode with a central wavelength of 1310 nm and a bandwidth of 65 nm was used as the light source, providing a ∼8.9-μm axial resolution in the tissue. In the sample arm, a 30-mm focal length objective lens was used to achieve ∼9 μm lateral resolution. The output light from the interferometer was sent to a spectrometer with a spectral resolution of ∼0.141 nm, producing a total depth range of ∼2.2 mm in the tissue. To achieve ultrahigh sensitive imaging of the flow, the spectrometer employed a high-speed InGaAs camera (SU1024LDH2, Goodrich Ltd., USA) capable of 92 × 103 lines per second. We adopted the scanning protocol described in previous work,14 which enabled an imaging rate of 280 fps. With this setup, it took ∼3 s for the system to acquire a whole 3-D volume data set, covering an area of ∼2.0 mm in the X direction and ∼2.5 mm in the Y direction over the sample. With a 280-fps imaging rate afforded by the fast camera, the temporal resolution (in terms of cross-sectional scan) is sufficient to monitor the time-dependent changes of blood flow in this study. The experiments were performed on C57 BL/6 adult mice of 20–30 g weight. All experimental animal procedures were in compliance with the Federal guidelines for care and handling of small rodents. The laboratory animal protocol for this work was approved by the Animal Care and Use Committee of the University of Washington. For experiments, the animal was anesthetized with isoflurane and secured in a stereotaxic apparatus to minimize possible motion artifacts. A skin incision was made on the frontal suture, and then the scalp was pulled aside to create an easy-access window at the parietal region for the system to image the brain with the skull left intact. During imaging, the mean arterial blood pressure (MABP) and the body temperature were monitored. The animal was ventilated with gas using a breathing mask at a gas flow rate of ∼1 L/min. To challenge the animal, we adjusted the O2 concentration by balancing N2 in the inhaled gas through a gas-proportioning meter (GMR2, Aalborg). A 20% O2 gas was initially given to the animal (i.e., normoxia state) and then switched to 10% O2 for a period of 5 min so that the animal was experiencing acute hypoxia. This was followed by supplying of 20% O2 gas for 3 min for the animal to recover (back to the normoxia state). And then the gas supply was switched to 100% O2 for 5 min (i.e., hyperoxia) and finally switched back to 20% O2 gas. During these challenging periods, OMAG was set continuously acquiring the B-scan images (M-B-scan mode). At the initial stage of normoxia, we used OMAG to capture a 3-D data set covering an area of 2 × 2.5 mm over the parietal skull, resulting in an OMAG projection view of brain vasculature [Fig. 1a]. According to the morphological features of the vasculature, we selected a representative B-scan position [marked by the dashed line in Fig. 1a] for M-B-scan in order to investigate how the mCBF responds to the acute O2 challenges. Figure 1b shows this B-scan OMAG flow image where cortical capillary flow signals (pointed by arrows) are clearly identified. In addition, most vessels are almost perpendicular to this cross-sectional plane; thus, the image delineates the approximate cross sections of the blood vessels. Fig. 1Representative functional microvasculature and its responses to systemic hypoxia, normoxia, and hyperoxia obtained by ultrahigh sensitive OMAG in mouse brain in vivo. (a) Projection map of 3-D OMAG image and (b) corresponding cross-sectional view (i.e., B-scan) at the position marked by the dashed line in (a), showing a typical microvascular network within parietal area. Abundant capillary flow signals are indicated by arrows in (b). (c) Time-lapsed plots showing relative changes of blood flow under controlled oxygen concentration, 10% (hypoxia), 20% (normoxia), 100% (hyperoxia), obtained from three individual animals. The white bar is 500 μm.  To provide hemodynamic analysis, we estimated the blood flow (flux) by integrating the reflectance signals from all microvessels across the entire B-scan cross-sectional area and evaluated its change over time by normalizing the signals with the baseline. The results from three individual animals are given in Fig. 1c. Although the measured signals of blood-flow changes due to the acute O2 challenge were varied from animal to animal, in general, the responses corresponded well to the temporal locations. We observed the blood-flow reduction at the early stage of hypoxia, which was then followed by a slight rise. The subsequent supply of 20% O2 gas (normoxia) has a tendency to drive the blood flow back to the baseline, but some animals (e.g., animal 3) reacted more aggressively. When the acute hyperoxia was given, a robust increase was shown, followed by a gradual decline. Finally, mCBF almost dropped to the baseline after 3 min of normoxia. To explain this dynamics, the MABP variation caused by physiological challenge should be considered. Previous reports indicated that MABP and heart rate are significantly reduced/increased when the mammals are exposed to hypoxia/hyperoxia.6 The MABP data collected in our experiments (Table 1) also show the influence of O2 levels on systemic circulatory parameters. Apparently, the rapid changes in MABP during acute hypoxia/hyperoxia were associated with pressure-passive mCBF; prolonged hypoxia/hyperoxia was associated with an increase/decrease in mCBF. The evidence obtained from this study has agreed well with the prior observations on a newborn calf and lamb.3 Specifically, the acute hypoxia-induced drop in MABP causes a decrease in microvascular CBF, but hypoxic survival demands that the energy and oxygen delivered should be balanced. The necessity for balance has important implications for the survival of the brain tissue, at least during the initial stages of hypoxia. Consistent with the “hypoxia-tolerance” theory,2 we observed the elevation of mCBF occurred at 2–4 min after onset of hypoxia (Fig. 1c). Here, we were not aiming at monitoring the response of microcirculation during chronic phase; thus, 3 min normoxia was allowed for circulatory adjustments to take place. Similar to the physiological adaption occurring with hypoxia, the mCBF level was modulated and started to decline back to the baseline during acute hyperoxia, although it was elevated due to the increased MABP. Table 1MABP measured under three physiological states.
In order to obtain more information as to how the capillary flow is altered under conditions of regulated microcirculation, we separated capillary (<20 μm in vessel diameter) and noncapillary (otherwise) microcirculations and compared their responses to the gas variations (Fig. 2). The relative values obtained at each time point are displayed by the average with standard deviation (SD) calculated from 1000 repeated B-scans. As seen, the observed effect on noncapillary microcirculation is much smaller than that in capillaries, indicating the varied sensitivity to this potent stimulus within microvessels at different flow states. In view of these findings, the action of hypoxia or hyperoxia on capillaries [indicated by box in Fig. 2b] could be qualitatively distinguished on the B-scan OMAG flow images at the four typical stages corresponding to the time points labeled by numbers in Fig. 2a. We observed that an apparent recruitment of perfused capillaries indicated by the increased capillary flow signals may have contributed to this enhanced capillary perfusion during the transient increase of oxygen-dependent MABP. In contrast, the reaction of noncapillary microvessels is not easily visualized. Fig. 2Different types of mCBF (capillary, noncapillary, and all) in response to switching the physiological conditions between hypoxia, normoxia, and hyperoxia. (a) The value at each time point is expressed by mean±SD. The action of hypoxia or hyperoxia on capillaries (indicated by box) could be qualitatively distinguished on (b) the B-scan images at four typical stages corresponding to the time points labeled by numbers in (a). 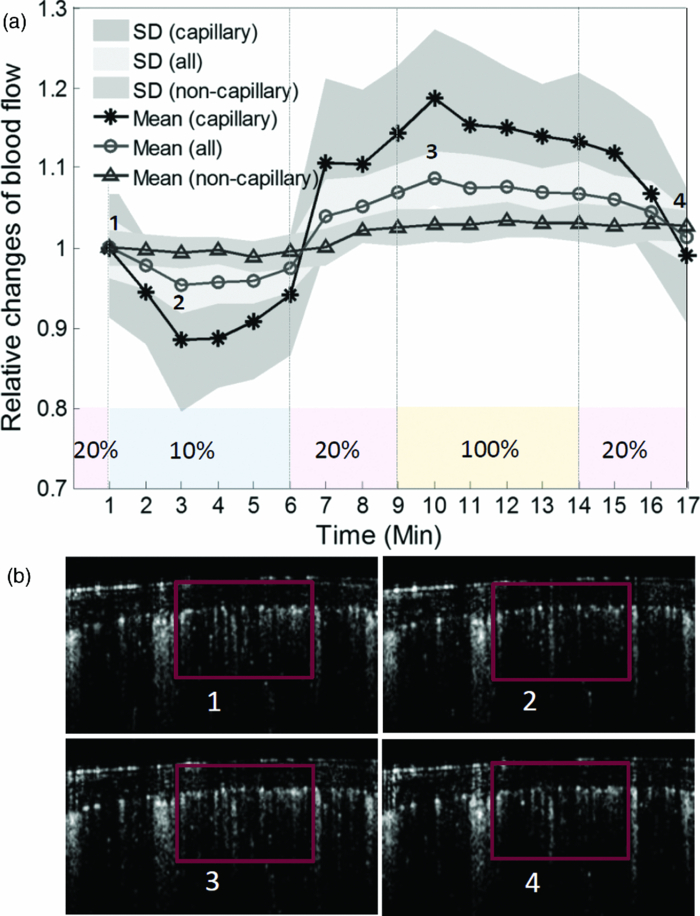 Theoretically, an increase/decrease in the total perfusion of the cerebral microvascular network may not only be associated with the an increase/decrease in microvessel density, but also related to an increase/decrease in blood flow in each single microvessel; however, little information is available as to which mechanism (either microvessel density or single microvessel flux) plays the dominant role in the regulation of regional mCBF. To investigate whether OMAG can shed some light on this, we estimated the functional microvessel density from the serial B-scan images. Here, we calculated the microvessel density as the percentage of the number of image pixels with values over zeros versus total pixel numbers for a capillary-apparent region [e.g., the region marked by the box in Fig. 2b]. According to the relationship between the density, mean flux, and total flux within the region, the relative mean flux changes can be obtained by dividing the relative total flux values by the microvessel density values. The resulting curves are shown in Fig. 3. Our results show that the perfused microvessel density or volume change mainly accounts for the total blood flux change, whereas the mean flux of blood flow through individual open microvessels produced little opposite change, which appears to play a secondary role as a mechanism in the regulation of microvascular blood flow to the brain during oxygen disturbances. It should be noted that the relative change of mean flux in mCBF correlates well with prior observations based on imaging techniques in which cranial window preparation was required.6, 7 Fig. 3Different flow parameters (total flux, density, and mean flux) within mCBF in response to physiological challenges. These relative changes (mean±SD) indicate that the microvessel density change primarily contributes to the total flux change within the microvascular tissue beds while the microvascular mean flux contributes to a minor degree.  To conclude, we presented a preliminary study on using ultrahigh sensitive OMAG to monitor mCBF changes during hypoxia and hyperoxia in mice. By analyzing OMAG reflectance signals from moving particles, we have shown that OMAG is sensitive to microhemodynamics and capable of differentiating the hemodynamics produced by “capillary” from that by “noncapillary” microcirculation, in addition to providing the relative values related to different flow parameters. Our preliminary results on qualitatively monitoring the response of microcirculation during acute hypoxia and hyperoxia reflect not only the direct reaction to the external oxygen-dependent stimulation, but present the internal adaptive regulation of microcirculation, which is in good agreement with the previous studies. This earlier work may lead to the potential applications of OMAG for cerebral microhemodynamics under various pathology and physiology. AcknowledgementsThis work was supported, in part, by National Institute of Biomedical Imaging and Bioengineering (Grant No. R01 EB009682), the National Heart, Lung, and Blood Institute (Grant No. R01 HL093140), and the American Heart Association (Grant No. 0855733G). ReferencesB. K. Siesjo, Brain Energy Metabolism, Wiley, New York
(1978). Google Scholar
B. R. Duling,
“Microvascular responses to alterations in oxygen tension,”
Circ. Res., 31
(4), 481
–489
(1972). Google Scholar
R. M. Gardiner,
“Cerebral blood flow and oxidative metabolism during hypoxia and asphyxia in the new-born calf and lamb,”
J. Physiol., 305
(1), 357
–376
(1980). Google Scholar
M. J. Poulin and
P. A. Robbins,
“Indexes of flow and cross-sectional area of the middle cerebral artery using Doppler ultrasound during hypoxia and hypercapnia in humans,”
Stroke, 27
(12), 2244
–2250
(1996). https://doi.org/10.1161/01.STR.27.12.2244 Google Scholar
T. Q. Duong, C. Iadecola, and
S.-G. Kim,
“Effect of hyperoxia, hypercapnia, and hypoxia on cerebral interstitial oxygen tension and cerebral blood flow,”
Magn. Reson. Med., 45
(1), 61
–70
(2001). https://doi.org/10.1002/1522-2594(200101)45:1<61::AID-MRM1010>3.0.CO;2-8 Google Scholar
A. G. Hudetz, B. B. Biswal, G. Fehér, and
J. P. Kampine,
“Effects of hypoxia and hypercapnia on capillary flow velocity in the rat cerebral cortex,”
Microvasc. Res., 54
(1), 35
–42
(1997). https://doi.org/10.1006/mvre.1997.2023 Google Scholar
K. P. Ivanov, M. K. Kalinina, and
Y. I. Levkovich,
“Microcirculation velocity changes under hypoxia in brain, muscles, liver, and their physiological significance,”
Microvas. Res., 30
(1), 10
–18
(1985). https://doi.org/10.1016/0026-2862(85)90033-0 Google Scholar
R. K. Wang, S. L. Jacques, Z. Ma, S. Hurst, S. Hanson, and
A. Gruber,
“Three dimensional optical angiography,”
Opt. Express, 15 4083
–4097
(2007). https://doi.org/10.1364/OE.15.004083 Google Scholar
Y. Jia and
R. K. Wang,
“Label-free in vivo optical imaging of functional microcirculations within meninges and cortex in mice,”
J. Neurosci. Methods, 194
(1), 108
–115
(2010). https://doi.org/10.1016/j.jneumeth.2010.09.021 Google Scholar
Y. Zhao, Z. Chen, C. Saxer, S. Xiang, J. F. de Boer, and
J. S. Nelson,
“Phase-resolved optical coherence tomography and optical Doppler tomography for imaging blood flow in human skin with fast scanning speed and high velocity sensitivity,”
Opt. Lett., 25
(2), 114
–116
(2000). https://doi.org/10.1364/OL.25.000114 Google Scholar
R. K. Wang and
L. An,
“Doppler optical micro-angiography for volumetric imaging of vascular perfusion in vivo,”
Opt. Express, 17
(11), 8926
–8940
(2009). https://doi.org/10.1364/OE.17.008926 Google Scholar
U. M. Hamper, M. R. DeJong, C. I. Caskey, and
S. Sheth,
“Power Doppler imaging: clinical experience and correlation with color Doppler US and other imaging modalities,”
Radiographics, 17
(2), 499
–513
(1997). Google Scholar
Y. Wang and
R. K. Wang,
“Measurement of particle concentration in flow by statistical analyses of optical coherence tomography signals,”
Opt. Lett., 36
(11), 2143
–2145 https://doi.org/10.1364/OL.36.002143 Google Scholar
L. An, J. Qin, and
R. K. Wang,
“Ultrahigh sensitive optical microangiography for in vivo imaging of microcirculations within human skin tissue beds,”
Opt. Express, 18
(8), 8220
–8228
(2010). https://doi.org/10.1364/OE.18.008220 Google Scholar
|


