|
|
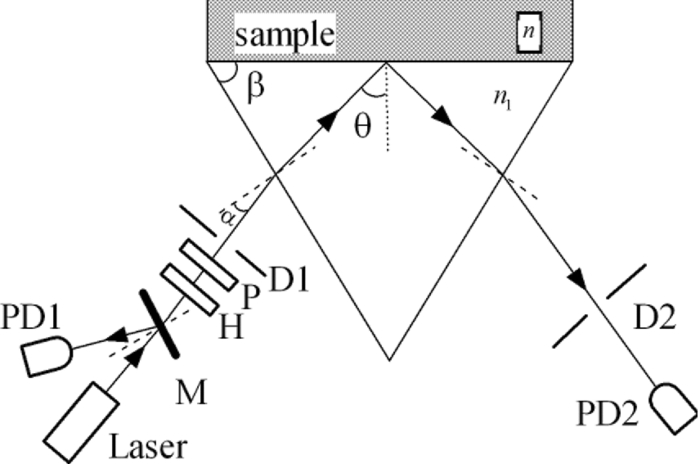
1.IntroductionRefractive index (RI) is an important optical parameter of biotissue, which can be defined in terms of a real part n r and an imaginary part n i as n = n r + in i, where n i is equal to the extinction coefficient κ, which means energy loss per unit at certain direction caused by absorption and scattering.1 When using a diffusion-approximation–based inverse model to determine the tissue optical parameters, RI is used as a known parameter and therefore its measurement accuracy affect the precise determination of other optical parameters.2 When the Monte Carlo method is used to simulate the light propagation in biotissues, RI determines the photons directions and boundary mismatch.3 It has been proved theoretically and experimentally that measurement of optical properties can be substantially affected by RI.4 The extinction coefficient should satisfy κ = μtλ/4π, μt, μs, and μa are the total attenuation coefficient, the scattering coefficient, and the absorption coefficient, respectively. μt = μs + μa.5 In the biomedical field, except for some weakly scattering tissues such as the cornea and lens in the anterior eye chamber, most biotissues have strong scattering.6 In the UV and visible regions of the electromagnetic spectrum, tissue absorption coefficient μa varies from 0.02 to 2.5 mm−1, while scattering coefficient μs varies from 2.5 to 40 mm−1.7, 8 So the traditional method such as Abbe refractometer is not applicable, and a new method named the optical fiber cladding method9 was developed. The main drawback of this method is the time-consuming procedure of substituting the cladding with biotissue and invalidity when the tissue sample is heterogeneous or distributed, or much smaller than the length of the fiber. Several other methods have been developed to measure the RI of biotissue, such as minimum deviation angle method,10 optical coherent tomography(OCT),11, 12, 13 surface plasmon resonance method (SPR),14 and total internal reflection method (TIR).15, 16, 17, 18, 19, 20 The differential total reflection method (DTRM) is a modified version of TIR. When the sample has weak absorption or little scattering, an inflexion point of the reflectance curve at the critical angle makes it easy to obtain n r. When the absorption or scattering is obvious, the reflectance curve will become smoother and no inflection point appears, so the differential of the reflectance curve is required to find the critical angle. One of the authors of this paper used DTRM to obtain RI of a strong absorption medium film.15 So far as we know, RI measurement of media with weak absorption or scattering have already been studied,15, 17 but the study of strong scattering media is still in the exploration stage.18, 19 All the methods mentioned above can only determine the real part of RI, and the imaginary part κ remains unsolved. 10, 11, 12, 13, 14, 15, 16, 17, 18, 19 Ding 20 first introduced the conception of complex refractive index in the measurement of human skin tissue and they used a nonlinear regression to obtain n r and κ simultaneously. In this paper, an extended differential total reflection method (EDTRM) is proposed to determine the complex refractive index of strong scattering media. Using this method, n r is directly determined by a differential of the reflectance curve, and κ can be obtained from nonlinear fitting. We proved that EDTRM is reliable for measuring RI of high scattering media such as biotissue. The usefulness and reliability of this method is verified by measuring the complex refractive indices of a series of high scattering tissue-mimicking phantoms and biotissues. 2.Material and MethodsEight kinds of tissue-mimicking phantoms are chosen: India ink solution (Solarbio Co.) of 3.3%, 5%, and 10% concentration, Intralipid-10% solution (Sino-Swed Pharmaceutical Co., Ltd.), white room temperature vulcanized silicon rubber (RTV No. 704), transparent RTV (No. 705) mixed with Al2O3 particles (Shanghai Shunhui Co.) at a weight ratio of 4:1, transparent RTV (No. 705) mixed with polystyrene microsphere (Institute of Polymer Chemistry of Nankai University, China) at a weight ratio of 4:1, 50% gelatin resin (Tianjin Guangfu Fine Chemical Research Institute) mixed with Al2O3 particles at a ratio of 20:3, 1.2% agar resin mixed with Al2O3 particles at a weight ratio of 5:1, epoxy resin (WSR6101) mixed with hardener (WSR 651, Bluestar New Chemical Materials Co., Ltd.), and Al2O3 particles at a weight ratio of 1:1:1. All the RTV are produced by Liyang Kangda Chemical Materials Co., Ltd. The Al2O3 particles have a diameter in the range of 2.5 to 5 μm. The polystyrene microsphere has a diameter of less than 30 μm. All the samples were prepared with a thickness of about 1 mm. Fresh porcine muscle and fresh porcine adipose were frozen for 30 min first and then sliced to thin section of about 1-mm thickness. The samples were pressed on the surface of the prism to make sure no air gap exists. Before the measurement, the system was calibrated by measuring the reflectance of deionized water. The schematic diagram of the experimental setup for reflectance measurement is shown in Fig. 1. n 1 is the RI of the prism. n is the RI of the sample. α is the incident angle at the air-prism interface, β is the apex angle (60 deg), and θ is the incident angle at the prism-sample interface. The He–Ne laser has a wavelength of 632.8 nm. M is a beam splitter and reflects part of the incident beam as a reference beam. Detector PD1 is used to receive the reference beam and monitor the power shift, which can calibrate the measured data and eliminate the influence of laser power fluctuation. After passing through the half-wave plate H, the polarizer P, and an aperture diaphragm D1, the beam reaches the air-prism interface. H is used to change the polarized direction of the incident beam for s- and p-polarized measurements. Detector PD2 is used to receive the emergent light from the prism. An aperture diaphragm D2 is placed before PD2 to reduce the influence of the scattering light and parasitic light. The equilateral prism is fixed on a rotation stage (PI, M-038), which is controlled by a Mercury C-863 servo motor controller and the PI General Command Set software on a computer. When light propagates from a denser medium to a less dense medium, the total reflection will occur at the critical angle θc, and all the light will be reflected back into the denser medium. The reflectance changes with the incident angle at the two media interface, which is described by Fresnel formula. θc is given by following equation Eq. 1[TeX:] \documentclass[12pt]{minimal}\begin{document}\begin{equation} \theta _c = \arcsin \frac{{n_r }}{{n_1 }}. \end{equation}\end{document}In general, we need to measure the intensity of reflection light at different incident angle as to determine the critical angle. According to the schematic diagram in Fig. 1, the mathematical formula of n r is Eq. 2[TeX:] \documentclass[12pt]{minimal}\begin{document}\begin{equation} n_r = n_1 \sin \left[ {\beta \pm \arcsin (\sin \alpha _c /n_1)} \right] \end{equation}\end{document}Eq. 3[TeX:] \documentclass[12pt]{minimal}\begin{document}\begin{equation} E = E_0 e^{ - \mu z} e^{i(kz - \omega t)}. \end{equation}\end{document}We eliminate the influence of time variation, and introduce n as complex refractive index, then E can be described as: Eq. 4[TeX:] \documentclass[12pt]{minimal}\begin{document}\begin{equation} E = E_0 e^{i2\pi z/\lambda n} \end{equation}\end{document}Based on the Fresnel formula,1 when the light is reflected at the prism-sample interface, we obtain Eq. 5[TeX:] \documentclass[12pt]{minimal}\begin{document}\begin{eqnarray} 2u_2^2 &=& n^2 (1 - \kappa ^2) - n_1^2 \sin ^2 \theta \nonumber\\ &&+\, \sqrt {[n^2 (1 - \kappa ^2) - n_1^2 \sin ^2 \theta]^2 + 4n^4 \kappa ^2 }, \end{eqnarray}\end{document}Eq. 6[TeX:] \documentclass[12pt]{minimal}\begin{document}\begin{eqnarray} 2v_2^2 &=& - [n^2 (1 - \kappa ^2) - n_1^2 \sin ^2 \theta] \nonumber\\ &&+\, \sqrt {[n^2 (1 - \kappa ^2) - n_1^2 \sin ^2 \theta]^2 + 4n^4 \kappa ^2 }, \end{eqnarray}\end{document}Eq. 7[TeX:] \documentclass[12pt]{minimal}\begin{document}\begin{equation} r_{1,2} = \frac{{n_1 \cos \theta - (u_2 + iv_2)}}{{n_1 \cos \theta + (u_2 + iv_2)}}. \end{equation}\end{document}Eq. 8[TeX:] \documentclass[12pt]{minimal}\begin{document}\begin{equation} R_{1,2} = \frac{{(n_1 \cos \theta - u_2)^2 + v_2^2 }}{{(n_1 \cos \theta + u_2)^2 + v_2^2 }}. \end{equation}\end{document}When emergent light leaves the prism and enters into the air, the reflection loss occurs at the prism-air interface, which is approximately equal to the loss of incidence at the air-prism interface. The reflectance of the s-polarized light at the air-prism interface (or the prism-air interface) is Eq. 9[TeX:] \documentclass[12pt]{minimal}\begin{document}\begin{equation} R_{2,3} = \left\{ {\frac{{\cos \alpha - n_1 \cos [ {{\rm asin(sin}\alpha {\rm /n}_{\rm 1} {\rm)}} ]}}{{\cos \alpha + n_1 \cos [ {{\rm asin(sin}\alpha {\rm /n}_{\rm 1} {\rm)}} ]}}} \right\}^2. \end{equation}\end{document}Finally, the measured reflectance should include the loss between the two interfaces mentioned above. For s-polarized light, the measured reflectance is given by Eq. 10[TeX:] \documentclass[12pt]{minimal}\begin{document}\begin{equation} R_s = R_{1,2}^*(1 - R_{2,3})^2. \end{equation}\end{document}The consistency between the measured curve and fitting curve is described by [TeX:] $E_s^2 $ , defined as Eq. 11[TeX:] \documentclass[12pt]{minimal}\begin{document}\begin{equation} E_s ^2 = 1 - \frac{{\sum\nolimits_{i = 1}^N {(R_{m,i} - R_{s,i})^2 } }}{{\sum\nolimits_{i = 1}^N {(R_{m,i} - \bar R)^2 } }}, \end{equation}\end{document}In our experiment, the reflectance curves of the sample as a function of incident angle were measured for p- and s-polarized incident light, respectively. We use the EDTRM to obtain n r and κ. The reflectance curves change most rapidly near the critical angle. By differential of the reflectance curve, we obtained the value of critical angle αc, whose position corresponds with the peak of the differential curve. The real part n r is calculated using Eq. 2. Here we use a nonlinear fitting program based on the Nelder–Mead simplex method to solve the imaginary part κ, which is a popular direct search method for multidimensional unconstrained minimization. For s-polarized light, the value of incident angle and the real part n r are substituted into Eqs. 5, 6, 7, 8, 9, 10 to obtain the calculated data. By fitting the calculated data to the experimental data in the nonlinear fitting program, κ is solved when we get a smallest fitting error in Eq. 11. For p-polarized light, the procedure is similar. 3.Results and DiscussionThe reflectance curves of deionized water and ink solution for p-polarized light are shown in Fig. 2a. For p-polarized light, the real part n r of the deionized water is 1.3324 and the extinction coefficient κ is smaller than 1×10⁻⁴. The complex refractive indices are 1.3344+0.0012i, 1.3359+0.0018i, and 1.3391+0.0041i for 3.3%, 5%, and 10% ink solution, respectively. It is clearly seen from Fig. 2b that the extinction coefficient increases nearly linearly with the ink concentration, which agrees well with the previous work.21 This verifies the reliability of our measurement setup. As shown in Fig. 2a, an obvious difference exists among samples with different absorption. The smoothness of the reflectance curve increases with the absorption of the sample, so the differential of the reflectance curve is needed to find the critical angle. Fig. 2(a) Reflectance curves of deionzed water and ink solution of 3.3%, 5%, and 10% concentration. (b) The extinction coefficient as a function of the India ink concentration. n 1 = 1.51466.  The RI of Intralipid-10% solution is 1.3496+0.0022i for p-polarization and 1.3500+0.0024i for s-polarization. When κ = 0.0024, λ = 632.8 nm, the total attenuation coefficient μ t is about 47.6 mm−1. Staveren 22 reported that μ t of Intralipid-10% solution varies from 34 to 55 mm−1 at the wavelength of 632.8 nm. Considering the differences of recipe and manufacturing procedure between different brands, our results are acceptable. Fitting reflectance curves and experimental data of RTV 704 are shown in Fig. 3a. The curves in Fig. 3b correspond with the differential of reflectance curves and the experimental data in Fig. 3a. The complex refractive indices are 1.4112+0.0031i for p-polarization and 1.4112+0.0036i for s-polarization. The fitting curves fit the experimental data fairly well and no obvious difference is observed. We measured n r of four types of substrate, RTV705 (n r = 1.4040 ± 0.001), gelatin (n r = 1.3805 ± 0.002), agar (n r = 1.3348 ± 0.001), and epoxy resin (n r = 1.5511 ± 0.002).Their measured reflectance curves are shown in Fig. 4, and their RIs are summarized and listed in Table 1. We can see that the extinction coefficients of the samples increase obviously after adding the scattering particles. In Lauldi’s23 study, they used silicone as the main component of phantoms, which has an RI of 1.404. In Andree’s24 study, the RI of silicone is 1.41. These values are similar to the RTV product used in our experiment. Phantoms made up of epoxy resin,25 agar,26 or gelatin,27 in which optical absorbers and scattering substances are added, and have a different receipt from our study. Wagnieres 26 measured the RI of agar phantoms by a traditional Abbe refractometer, which delivers much less accuracy. So the RI value of agar and gelatin phantom in our study can be a supplement in a future phantom study. Fig. 3(a) Fitting reflectance curves and experimental data of RTV 704: s-polarization (solid line, pluses), p-polarization (dotted line, circles). Pluses show the experimental data of s-polarization and circles show experimental data of p-polarization. (b) The derivative of the fitting reflectance curves: s-polarization (dashed-dotted line), p-polarization (dashed line). The derivative of the experimental data: s-polarization (solid line), p-polarization (dotted line). n 1 = 1.61656.  Fig. 4(a) Fitting curves and experimental data of gelatin resin added with Al2O3 particles (solid line, circles) and RTV 705 added with Al2O3 particles (dotted line, pluses). s-polarization, n 1 = 1.72304. (b) Fitting curves and experimental data of RTV 705 added with polystyrene microsphere (solid line, circles, n 1 = 1.61656), agar resin added with Al2O3 particles (dashed line, pluses, n 1 = 1.51466), and epoxy resin added with Al2O3 particles (dotted line, stars, n 1 = 1.72304), s-polarization.  Table 1RIs for tissue-mimicking phantoms and biotissues.
The results of porcine muscle and porcine adipose are shown in Fig. 5. Bashkatov 28 summarized the RI value of biotissue. For different types of tissues, n r of muscle ranges form 1.36 to 1.46 and n r of adipose ranges form 1.41 to 1.49. For s-polarization, the measured n r is 1.3677±0.003 for porcine muscle, which is smaller than the former research of Li and Xie18 (1.380±0.007). Zysk 12 measured the adjacent adipose of rat mammary tumors using OCT and the result is 1.467 ± 0.026. Our measured RI is 1.4663+0.0016i for porcine adipose, which is similar to Lai’s19 result (1.4699± 0.0003) but smaller than Li and Xie18 (1.493± 0.005). It has been proved that the pressure applied on the surface of the sample and the tissue striations orientation will lead to large differences of the measured RI.18, 20 So the main difference of RI is likely due to the conditions of samples, such as the fat concentration, the pressure applied on the sample and the amount of intracellular and extra cellular fluids. Fig. 5(a) Fitting reflectance curves and experimental data of porcine muscle (dotted line, circles, n 1 = 1.51466) and porcine adipose (solid line, pluses, n 1 = 1.72304), s-polarization. (b) The derivative of the fitting reflectance curves: porcine muscle (dotted line), porcine adipose (solid line).  The measured extinction coefficient κof porcine muscle and porcine adipose are about 0.002, which exhibits biotissue to have the character of high light scattering. The increase of the scattering coefficient will make the reflectance curve become smoother near the critical angle, which will lead to the decrease of measurement accuracy using EDTRM. So when κ is larger than 0.004, the difficulty of using EDTRM to determine RI arises. Fortunately, most of the biotissue has a κ smaller than 0.002, so EDTRM is generally applicable. The parameter [TeX:] $E_s ^2 $ , defined as the fitting quality, is larger than 0.992 for deionized water and ink solution. For Intralipid-10% solution, [TeX:] $E_s ^2 $ is about 0.980. The results are similar to Ding’s20 For the other six tyes of tissue mimicking phantoms, [TeX:] $E_s ^2 $ ranges from 0.975 to 0.999. Each of the samples was continuously measured 4 times to calculate the standard deviation. The standard deviation of n r is smaller than 0.0001 for the tissue-mimicking phantoms and smaller than 0.0005 for the measured porcine tissue, which is much smaller than Ding’s20 The main difference may be caused by the difference of tissue, for we measured the same sample 4 times and they measured 4 or 6 skin samples 12 or 18 times. The experimental error of n r can be calculated by the differential of Eq. 2, which is Eq. 12[TeX:] \documentclass[12pt]{minimal}\begin{document}\begin{equation} \Delta n_r = \left| {\frac{{\partial n_r }}{{\partial \beta }}} \right|\Delta \beta + \left| {\frac{{\partial n_r }}{{\partial \alpha _c }}} \right|\Delta \alpha _c + \left| {\frac{{\partial n_r }}{{\partial n_1 }}} \right|\Delta n_1.\end{equation}\end{document}The possible sources of error include errors of the vertex angle (Δβ), the measured critical incident angle (Δαc), and the refractive index of prism (Δn 1). The high resolution rotation stage has a minimum incremental motion of 3.5 μrad and a design resolution of 0.59 μrad, so the error caused by the rotation stage can be ignored. It has been proved that the effect of the divergence angle of laser and the precision of the detector can be neglected.16 For high scattering media, the minimum angle interval in our experiment is about 0.1 deg. For porcine muscle, n 1 = 1.514, Δβ = 0.0002 rad, Δαc = 0.1°, by substitutint these values into Eq. 2, we get the total experimental error Δn r = 0.002. By changing the value of n r in the range of error, we calculate the error of κ by the fitting program. The experimental error of the other phantoms and biotissues can be estimated by the same way and the results are listed in Table 1. The main experimental error originates from the shift of the critical incident angle Δαc, which is influenced by the extinction coefficient of the sample.16 In conclusion, a new method of determining refractive indices is introduced. Our experimental results prove that EDTRM is applicable for RI measurement of high scattering media such as biotissue and tissue-mimicking phantoms, which has a similar or better accuracy compared to the other method. Considering the importance of RI and tissue-mimicking phantoms in biomedical fields, we intend to make a further study of this method. AcknowledgmentsThis research is supported by the Chinese National Key Basic Research Special Fund (Grant No. 2011CB922003), National Talent Training for Basic Sciences Foundation (Grant No. J0730315), Creative Experimental Project of National Undergraduate Students (Grant No. 101005502), and Fundamental Research Funds for the Central Universities. ReferencesM. Born and
E. Wolf, Principles of Optics, Pergamon, New York
(1959). Google Scholar
M. S. Patterson, B. Chance, and
B. C. Wilson,
“Time resolved reflectance and transmittance for the non-invasive measurement of tissue optical properties,”
Appl. Opt., 28
(12), 2331
–2336
(1989). https://doi.org/10.1364/AO.28.002331 Google Scholar
L. H. Wang, S. L. Jacques, and
L. Q. Zheng,
“MCML Monte Carlo modeling of light transport in multilayered tissues,”
Comput. Methods Programs Biomed., 47
(2), 131
–146
(1995). https://doi.org/10.1016/0169-2607(95)01640-F Google Scholar
M. A. Bartlett and
H. Jiang,
“Effect of refractive index on the measurement of optical properties in turbid media,”
Appl. Opt., 40 1735
–1741
(2001). https://doi.org/10.1364/AO.40.001735 Google Scholar
C. F. Bohren and
D. R. Huffman, Absorption and Scattering of Light by Small Particles, John Wiley and Sons, New York
(1983). Google Scholar
V. V. Tuchin,
“Reviews of topical problems: Light scattering study of tissues,”
Phys. Usp., 40
(5), 495
–515
(1997). https://doi.org/10.1070/PU1997v040n05ABEH000236 Google Scholar
A. J. Durkin, S. Jaikumar, and
R. Richards-Kortum,
“Optically dilute, absorbing, and turbid phantoms for fluorescence spectroscopy of homogeneous and inhomogeneous samples,”
Appl. Spectros., 47
(12), 2114
–2121
(1993). https://doi.org/10.1366/0003702934066244 Google Scholar
W. F. Cheong, S. A. Prahl, and
A. J. Welch,
“A review of the optical properties of biological tissues,”
IEEE J. Quantum Electron., 26
(12), 2166
–2185
(1990). https://doi.org/10.1109/3.64354 Google Scholar
F. Bolin, L. E. Preuss, R. C. Taylor, and
R. J. Ference,
“Refractive index of some mammalian tissues using a fiber optic cladding method,”
Appl. Opt., 28
(12), 2297
–2303
(1989). https://doi.org/10.1364/AO.28.002297 Google Scholar
D. K. Sardar and
L. B. Levy,
“Optical properties of whole blood,”
Lasers. Med. Sci., 13 106
–111
(1998). https://doi.org/10.1007/s101030050062 Google Scholar
G. J. Tearney, M. E. Brezinski, J. F. Southern, B. E. Bouma, M. R. Hee, and
J. G. Fujimoto,
“Determination of the refractive index of highly scattering human tissue by optical coherence tomography,”
Opt. Lett., 20
(21), 2258
–2260
(1995). https://doi.org/10.1364/OL.20.002258 Google Scholar
A. M. Zysk, E. J. Chaney, and
S. A. Boppart,
“Refractive index of carcinogen-induced rat mammary tumours,”
Phys. Med. Biol., 51 2165
–2177
(2006). https://doi.org/10.1088/0031-9155/51/9/003 Google Scholar
X. Wang, C. P. Zhang, L. S. Zhang, L. L. Xue, and
J. G. Tian,
“Simultaneous refractive index and thickness measurements of bio tissue by optical coherence tomography,”
J. Biomed. Opt., 7 628
–632
(2002). https://doi.org/10.1117/1.1501887 Google Scholar
A. J. Jaaskelainen, K. E. Peiponen, and
J. A. Raty,
“On reflectometric measurement of a refractive index of milk,”
J. Dairy Sci., 84 38
–43
(2001). https://doi.org/10.3168/jds.S0022-0302(01)74449-9 Google Scholar
C. P. Zhang, Q. W. Song, C. Y. Ku, R. B. Gross, and
R. R. Birge,
“Determination of the refractive index of a bacteriorhodopsin film,”
Opt. Lett., 19
(18), 1409
–1411
(1994). https://doi.org/10.1364/OL.19.001409 Google Scholar
Q. W. Song, C.-Y. Ku, C. Zhang, R. B. Gross, and
R. R. Birge,
“Modified critical angle method for measuring the refractive index of bio-optical materials and its application to bacteriorhodopsin,”
J. Opt. Soc. Am. B., 12
(5), 797
–803
(1995). https://doi.org/10.1364/JOSAB.12.000797 Google Scholar
G. H. Meeten,
“Refractive index errors in the critical-angle and Brewster-angle methods applied to absorbing and heterogeneous materials,”
Meas. Sci. Technol., 8 728
–733
(1997). https://doi.org/10.1088/0957-0233/8/7/006 Google Scholar
H. Li and
S. S. Xie,
“Measurement method of the refractive index of biotissue by total internal reflection,”
Appl. Opt., 35
(10), 1793
–1795
(1996). https://doi.org/10.1364/AO.35.001793 Google Scholar
J. Lai, Z. Li, C. Wang, and
A. He,
“Experimental measurement of the refractive index of biological tissues by total internal reflection,”
Appl. Opt., 44
(10), 1845
–1849
(2005). https://doi.org/10.1364/AO.44.001845 Google Scholar
H. F. Ding, J. Q. Lu, W. A. Wooden, P. J. Kragel, and
X. H. Hu,
“Refractive indices of human skin tissues at eight wavelengths and estimated dispersion relations between 300 and 1600 nm,”
Phys. Med. Biol., 51 1479
–1489
(2006). https://doi.org/10.1088/0031-9155/51/6/008 Google Scholar
R. Cubeddu, A. Pifferi, P. Taroni, A. Torricelli, and
G. Valentini,
“A solid tissue phantom for photon migration studies,”
Phys. Med. Biol., 42 1971
–1979
(1997). https://doi.org/10.1088/0031-9155/42/10/011 Google Scholar
H. J. van Staveren, C. J. M. Moes, J. van Marie, S. A. Prahl, and
M. J. C. van Gemert,
“Light scattering in Intralipid-10% in the wavelength range of 400–1100 nm,”
Appl. Opt., 30
(31), 4507
–4514
(1991). https://doi.org/10.1364/AO.30.004507 Google Scholar
M. Lualdi, A. Colombo, B. Farina, S. Tomatis, and
R. Marchesini,
“A phantom with tissue-like optical properties in the visible and near infrared for use in photomedicine,”
Lasers. Med. Sci., 28 237
–243
(2001). https://doi.org/10.1002/lsm.1044 Google Scholar
S. Andree, C. Reble, J. Helfmann, I. Gersonde, and
G. Illing,
“Spatially resolved reflectance used to deduce absorption and reduced scattering coefficients,”
Proc. SPIE, 7368 73680I
(2009). https://doi.org/10.1117/12.831601 Google Scholar
M. Firbank, M. Oda, and
D. T. Delpy,
“An improved design for a stable and reproducible phantom material for use in near-infrared spectroscopy and imaging,”
Phys. Med. Biol., 40 955
–961
(1995). https://doi.org/10.1088/0031-9155/40/5/016 Google Scholar
G. Wagnieres, S. Cheng, M. Zellweger, N. Utke, D. Braichotte, J. P. Ballini, and
H. V. D. Bergh,
“An optical phantom with tissue-like properties in the visible for use in PDT and fluorescence spectroscopy,”
Phys. Med. Biol., 42 1415
–1426
(1997). https://doi.org/10.1088/0031-9155/42/7/014 Google Scholar
S. J. Madsen, B. C. Wilson, M. S. Patterson, Y. D. Park, S. L. Jacques, and
Y. Hefetz,
“Experimental tests of a simple diffusion model for the estimation of scattering and absorption coefficients of turbid media from time-resolved diffuse reflectance measurements,”
Appl. Opt., 31 3509
–3517
(1992). https://doi.org/10.1364/AO.31.003509 Google Scholar
N. Bashkatov, E. A. Genina, and
V. V. Tuchin,
“Optical properties of skin, subcutaneous, and muscle tissues: a review,”
J. Innov. Opt. Health. Sci., 4
(1), 9
–38
(2011). https://doi.org/10.1142/S1793545811001319 Google Scholar
|