
|
|
1.IntroductionAcute otitis media (AOM) is, the most frequently diagnosed disease in children that involves antibiotic treatment.1 In the United States, more than 20 million antibiotic prescriptions are registered annually due to AOM alone.2, 3 In otitis media (OM) diagnosis, the position of the tympanic membrane is an important factor as a bulging membrane is a sign indicating AOM, whereas a retracted membrane is normally associated with otitis media with effusion. Even though otitis media diagnosis cannot rely on single signs or single symptoms, a bulging tympanic membrane is associated with a high positive prediction value.4 The overlap between the signs and symptoms of AOM and, e.g., the common cold, makes it difficult for clinicians to achieve high diagnostic accuracy in OM. As a consequence, AOM is overdiagnosed and many patients are subject to unnecessary antimicrobial treatment. Hence, a modality that can help increase the diagnostic accuracy, and that does not inflict significantly on the medical examination, is needed in the primary healthcare. We have previously proposed a technique for surface curvature assessment based on fiber optics.5, 6 Spatially resolved reflection (SRR) is measured without contact by measuring backscattered photons from a sample as detected by an array of fibers where each fiber is connected to a photo diode. The SRR is measured at multiple source positions. The source and detector fibers were arranged in two linear arrays, and a custom made LabView virtual instrument controlled the activation and deactivation of the source laser diodes, with only one source to be active at a time. The technique was miniaturized and implemented in a standard otoscope (Heine Beta 200, Heine, Germany) allowing for application of the sensor in the human ear. Two parallel arrays, 4-mm wide, of optical fibers (200/230 μm, NA = 0.22), with 11 fibers in each array, were attached to the distal end of the modified otoscope; one array serving as detector and the other as source. For each source, the backscattered photons are detected at 11 detectors giving rise to an 11×11 data set. A source-detector intensity matrix (SDIM) is formed by arranging the SRR in a matrix where the row number corresponds to the source channel. In Ref. 6 we presented Monte Carlo simulations of the SDIM measurements of the solid optical phantoms presented in Refs. 5 and 6. The aim of the present study was to evaluate whether the SDIM method for shape assessment can be used on membranes for discriminating between bulging and retracted positions. An ear model with a latex membrane was used for proof-of-principle. Measurements were also done on tympanic membranes from harvested temporal bones. 2.Materials and Methods2.1.OtoscopeA tailored epoxy otoscope speculum allowing for inclusion of a double array of parallel optical fibers was manufactured by means of stereolithography (Fig. 1, right panel). The fibers were equidistantly aligned in two parallel arrays, one array serving illumination from computer controlled pigtailed laser diodes (L2K-P650-LD-MM-DL3147–060-A, Laser2000, Norrköping, Sweden) and the other serving detection of the backscattered light. Each laser was activated for 20 ms in a sequence that was repeated 4 times. The photodiodes were configured to detect the backscattered light in parallel at a sample rate of 5 kHz/channel. Fig. 1Left: Set-up for membrane surface curvature assessment using a model ear. The lowerp part contains a cavity, into which a cylinder was inserted. The lower part of the inner cylinder was cut at 30 deg relative the horizontal plane and a replaceable rubber membrane was attached to the tilted end. A syringe allowed for cavity pressure changes and membrane positioning. The arrows show membrane response for syringe movement. Right: Front-view photo of the tip of the ear speculum showing the fiber distributions for the source and detector arrays. Fibers other than the source and detector arrays were utilized for white light illumination.  With the fiber arrays, acquisition of the SDIM is possible; a technique that we have described in detail elsewhere.5 The signal was arranged in a matrix, the SDIM, where row i represented the spatially resolved detection when light source i was active. The profiles represented by the SDIM rows are affected by the position of the source and the displacement of the surface. In this arrangement, the SDIM becomes a function of multiple source-detector separations and multiple measuring distances, i.e., the distance from the surface to the probe, which is varying for nontrivial surface shapes. 2.2.Model EarVerification of instrument performance was performed in measurements of the displacement of two membranes of vulcanized latex (membrane 1 and 2) in a set-up resembling the human ear with structures mimicking the external auditory canal, the tympanic membrane, and the middle ear cavity (Fig. 1, left panel). Membrane 1 was thinner and more translucent than membrane 2. The syringe, tube, cylinder cavity, and membrane constituted a closed system where volume alterations caused by syringe piston repositioning are compensated by membrane displacement. Infusing the piston induces positive cavity pressure, causing the membrane to bulge into the canal; whereas a negative pressure, achieved by withdrawing the piston, forces the membrane to retract into the cavity. Hence, the position of the rubber membrane of the model can be manipulated in ways that resembles the position of the tympanic membrane at different middle ear pressures. By filling the closed system with fluid, e.g., water, the displacement of the piston corresponds to the displacement of the membrane due to the incompressible property of the fluid. Hence, the curvature of the membrane at different pressures could be calculated from readings of the syringe piston position. 2.3.Temporal BonesTympanic membrane displacement upon applied middle ear pressure was investigated in vitro utilizing harvested human temporal bones (TBs), n = 4. The TBs were sealed using dental phosphate cement (Heraeus Kulzer GmbH&co, Germany) allowing pressure equalization via the eustachian tube. By connecting the eustachian tube to a syringe pump, via a plastic tube with low compliance, the SDIM for retracted, neutral, and bulging tympanic membranes were registered utilizing the modified otoscope (Fig. 2). Due to air seal leakages, bulging and retracted positions of the tympanic membrane were established by applying continuous infusion and withdrawal, respectively, of the syringe piston. Prior to each measurement, otomicroscopic examination verified the ability of the syringe pump to affect tympanic membrane position. Fig. 2Set-up for in vitro tympanic membrane surface curvature assessment. A syringe, connected to a syringe pump, infused/withdrew air into/from the middle ear cavity via a plastic tube sealed with dental cement against the Eustachian tube. The temporal bone is illustrated as cross-section for clarity.  2.4.Model Ear MeasurementsMeasurements on two types of latex membranes were performed utilizing the model ear (Fig. 2). The closed system consisting of the syringe, tube, and model ear was filled with water and the membrane position manipulated by piston movement corresponding to cavity volume variation in the range V−0.3 to V+0.3 ml in steps of 0.1 ml, where V is the unknown cavity volume at atmospheric pressure. Within this range, the membrane displacement can be approximated with a spherical cap.7 With given volume variations, membrane peak displacement ranges from −5 to 4 mm, where the asymmetry is due to different inner and outer diameters of the cylinder holding the membrane. Measuring distances, d, of 10 and 15 mm were applied. SDIM acquisition was performed for each configuration. 2.5.Tympanic Membrane MeasurementsThe otoscope speculum was inserted into the external auditory canal of the TBs to a position approximately 15 mm from the tympanic membrane. The TB and otoscope were held in a fixed position by means of a translational stage so that the monitored fraction of the tympanic membrane did not vary between measurements. The otoscope was adjusted to measure the SDIM from the segment of the tympanic membrane that is posterior and parallel to the long process of the malleus, i.e., in the postero-superior quadrant of the tympanic membrane. 2.6.Normalization and Sgnal ProcessingTo compensate for interchannel variability, the SDIMs were normalized utilizing an external reference [Eq. 1], an internal reference [Eq. 2], or both [Eq. 3]. Eq. 1[TeX:] \documentclass[12pt]{minimal}\begin{document}\begin{equation} {\rm SDIM}_{{\rm ext}} (i,j) = \frac{{M(i,j)}}{{R(d,i,j)_{| {{\rm d} = {\rm 15\, mm}}} }} \end{equation}\end{document}Eq. 2[TeX:] \documentclass[12pt]{minimal}\begin{document}\begin{equation} {\rm SDIM}_{{\mathop{\rm int}} } (i,j) = \frac{{M(i,j)}}{{M_{{\rm neutral}(i,j)} }} \end{equation}\end{document}Eq. 3[TeX:] \documentclass[12pt]{minimal}\begin{document}\begin{equation} {\rm SDIM}_c (i,j) = \frac{{M(i,j)}}{{R(d,i,j)_{| {{\rm d} = {\rm 15\, mm}}} }} \cdot \frac{{R'(d,i,j)_{| {{\rm d} = {\rm 15\, mm}}} }}{{R'(d,i,j)}}, \end{equation}\end{document}A matrix representing a Gaussian surface were fitted to each SDIM applying a Levenberg–Marquardt iterative fitting procedure8 using nonlinear least squares. where o, A, a, b, c, i 0, and j 0 where fitting parameters and i and j the SDIM element indices. The parameters A, a, b, c, i 0, and j 0 fits a two-dimensional Gaussian function with amplitude A, centered at (i 0, j 0 ); a, b, and c the width of the Gaussian; o the offset, i.e., the elevation from the ij-plane, and T a rotation operator aligning the Gaussian to its optimal base plane.3.Results3.1.Model Ear MeasurementsA typical SDIMext from the thinner latex membrane (#1) is seen in Fig. 3. The amplitude in the Gaussian fit is gradually more negative for retracted surfaces and more positive for bulging surfaces. Similar SDIMs were observed from the thicker membrane (#2). The SDIMint from membrane #1 is given in Fig. 4. The same conclusion can be drawn on the sign of the amplitude in relation to the shape of the membrane as for SDIMext. The relation between the membrane displacement and the Gaussian amplitude for the model ear measurements from membrane 1 and 2 is presented in Fig. 5. Results from membrane 1 and 2 showed similar dynamics and amplitudes. Fig. 3Top: SDIMext from vulcanized latex membrane (membrane 1) measurements at 15 mm distance. Middle: The corresponding model fit. Bottom: The amplitude (squares) and offset (circles) model fitting parameters. Each column represents a membrane volume displacement, ranging from −0.3 to 0.3 ml from left to right.  Fig. 4Top: SDIMint from vulcanized latex membrane measurements (membrane 1) at 15 mm distance. Middle: The corresponding model fit. Bottom: The amplitude (squares) and offset (circles) model fitting parameters. Each column represents a membrane displacement, ranging from −0.3 to 0.3 ml from left to right.  Fig. 5Amplitude (left) and offset (right) of model fit for ear model measurements (SDIMext) as function of membrane curvature radius corresponding to volume variations in the range V−0.3 to V+0.3 ml in steps of 0.1 ml, where V is the ear model cavity volume at atmospheric pressure. The Pearson's product moment correlation coefficient, r 2, for the fit was 0.87±0.08, 0.87±0.06, and 0.84±0.09 for membrane 1 at d = 10 mm (x), membrane 1 at d = 15 mm (*), and membrane 2 at d = 15 mm, (o) respectively.  3.2.Tympanic Membrane In Vitro MeasurementsMeasurements were performed on three TBs where the otoscope was repositioned two, three, and five times, respectively. Three measurement series were performed for each position. One TB was excluded due to a hyper mobile tympanic membrane. Typical SDIMext from retracted, normally positioned, and bulging tympanic membrane are seen in Fig. 6. It can be observed that Gaussian amplitude is positive for all membrane positions. However, for SDIMint, the amplitude is negative for a retracted and positive for a bulging tympanic membrane (Fig. 7). This was seen for all three TMs. The scatter plots of amplitude and offset from retracted and bulging tympanic membranes for the four normalization procedures are given in Fig. 8. The parameters did not discriminate between the positions for SDIMext. The best discrimination was found for SDIMint and SDIMcr. Fig. 6Typical SDIMc from a retracted, a normally positioned and a bulging tympanic membrane (left to right) as normalized by the external reference surface. 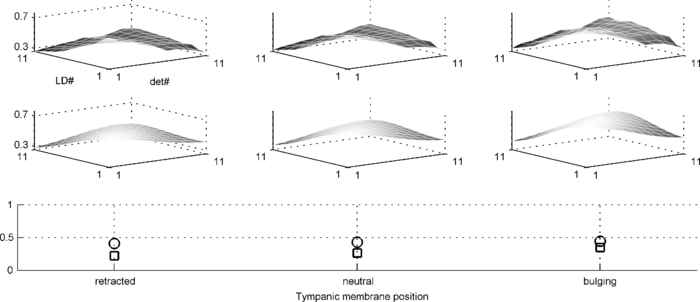 3.3.Goodness of FitThe Pearson's product moment correlation coefficients between the SDIM model and measurements for the various normalizations are presented in Table 1. The SDIMint displayed less than 10% variation in most cases. Table 1The Pearson's product moment correlation coefficient, r 2 ± sd, for the Gaussian fit in the different source detector intensity matrix calculations. N is the number of measurements, n is the number of measurements where the r 2 calculation inclusion criterion of a 10% dynamics in the SDIM, was met.
4.DiscussionWe have presented and evaluated an optical method using two arrays of spatially distributed optical fibers, one for illumination and one for detection of backscattered light incorporated in a custom otoscope speculum. Analysis of the recorded source detector intensity matrix SDIM, using a Gaussian surface with amplitude A and offset o, was performed to represent the shape of the surface. It was shown, using a model ear with a latex membrane, that retracted and bulging membranes can be discriminated by either normalizing the SDIM with an external plastic flat surface, SDIMext or by the neutral position of the membrane itself, SDIMint. The more complex shapes of tympanic membranes in harvested temporal bones were discriminated when using a two-step normalization procedure. When validating the method for surface shape representation, gradual convex and concave shapes were created by controlling the water volume displacement in a Plexiglas ear model with latex membranes. As can be seen in Fig. 5, there is a gradual, but slight decrease in amplitude for the concave shapes, while the convex surfaces displayed a better dynamic. This is in accordance with our previous findings when the method was evaluated on solid polyacetal plastic blocks.5 There is a strong dependence of the Gaussian amplitude and the distance to the surface. A short distance (10 mm in Fig. 5), yields a large amplitude change for varying shapes. Therefore, it is important to take the measuring distance into account when assessing the shape of the tympanic membranes from the temporal bones. Performing measurements on the tympanic membranes with graded degrees of curvature was not possible as this would have required either a completely sealed cavity, preferably with a water filled system such as in the ear model measurements, or knowledge of the individual compliances for the different temporal bones. Instead, stable bulging and convex positions of the membrane were accomplished by applying a continuous pressure, utilizing the syringe pump, to the middle ear. If the data were normalized by an external reference surface, to account for source and detector calibration, separation of the shapes was not possible (Fig. 8, upper left panel). This is due to individual variability of the shape of the membranes and the varying distances between otoscope and membrane. Both effects are accounted for when normalizing bulging and retraced data from each membrane to that from the membrane in neutral position (Fig. 8, upper right panel). This normalization, however, requires that manipulations of the position of the membrane can be performed as in tympanometry or pneumatic otoscopy. If the shape of the membrane should be assessed by a single measurement, a different normalization that accounts for measurement distance is needed. A first effort to compensate for the distance was done by the SDIMc , a normalization procedure utilizing reference recordings with varying distances in order to match the SDIM from a tympanic membrane to that from a normally positioned membrane with known distance (SDIMc). However, in this case a combination of amplitude and offset of the surface was needed to separate bulging from retracted membranes (Fig. 8, lower left panel). If in addition, the distance compensated SDIMc was normalized to the mean SDIMc from normally positioned tympanic membranes, yielding SDIMcr, position discrimination was obtained based only on the Gaussian amplitude, with minimal overlap (Fig. 8, lower right panel). 5.ConclusionIn conclusion, surface shapes from retracted and bulging tympanic membranes could be separated with a single measurement, given that variations in measurement distance is accounted for and that the measurement from normally positioned tympanic membranes are used for normalization. Hence, the method has potential to aid in quantitative assessment of the tympanic membrane position. AcknowledgmentsThis work was supported by the Swedish Agency for Innovation Systems (VINNOVA) through the Swedish National Center of Excellence for NonInvasive Medical Measurements (NIMED). ReferencesG. Worrall,
“Acute otitis media,”
Canadian Family Physician, 53
(12), 2147
–2148
(2007). Google Scholar
S. I. Pelton,
“Otitis media,”
Principles and Practice of Pediatric Infectious Diseases, 190
–198 Churchill Livingstone, New York
(2003). Google Scholar
W. J. Steinbach, T. C. Sectish, K. W. Chang, and
A. H. Messner,
“Pediatric residents’ clinical diagnostic accuracy of otitis media,”
Pediatrics, 109
(6), 993
–998
(2002). https://doi.org/10.1542/peds.109.6.993 Google Scholar
K. Ramakrishnan, R. A. Sparks, and
W. E. Berryhill,
“Diagnosis and treatment of otitis media,”
American Family Physician, 76
(11), 1650
–1658
(2007). Google Scholar
M. Sundberg, M. Borga, H. Knutsson, A. Johansson, T. Stromberg, and
P. A. Oberg,
“Fibre-optic array for curvature assessment: application in otitis diagnosis,”
Med. Biol. Eng. Comput., 42
(2), 245
–252
(2004). https://doi.org/10.1007/BF02344638 Google Scholar
M. Sundberg, T. Lindbergh, and
T. Strömberg,
“Monte Carlo simulations of backscattered light intensity from convex and concave surfaces with an optical fiber array sensor,”
Interactions with Tissue and Cells XVII, SPIE, San José
(2006). Google Scholar
H. Duan, Z. W. Hu, and
Z. C. Fang,
“Study on deformation characters of a large rubber circular plate,”
Modell. Simul. Mater. Sci. Eng., 12
(2), 245
–253
(2004). https://doi.org/10.1088/0965-0393/12/2/006 Google Scholar
W. H. Press, B. P. Flannery, S. A. Teukolski, and
W. T. Vetterling,
“Numerical recipes,”
The Art of Scientific Computing, Cambridge University Press, Cambridge
(1992). Google Scholar
|


