
|
|
1.IntroductionApoptosis, a regulated form of cell death, is implicated in the selective deletion of cells in certain disease states, where a biological role for deletion is evident.1, 2 A wide variety of stimuli and conditions, both physiological and pathological, can trigger apoptosis. These stimuli include: DNA damage, intracellular damage, toxins, extracellular signals, heat, free radicals, growth factor withdrawal, cytokines, loss of matrix attachment, glucocorticoids, nitric oxide, oxidative stress, and radiation.3 The role of apoptosis in cancer is so prominent that its evasion is considered to be one of the fundamental hallmarks of cancer.4 Further, it is now well-documented that many cytotoxic anticancer agents induce apoptosis, raising the possibility that defects in the apoptotic programs contribute to treatment failure.5, 6, 7 Reed may have put it best: “when it comes to the successful eradication of cancer cells by nonsurgical means, ultimately, all roads lead to apoptosis. Essentially all cytotoxic anticancer drugs [and other cancer therapies] currently in clinical use, when they work, induce apoptosis of malignant cells”.8 Enhanced apoptosis is also responsible for many of the adverse effects of chemotherapy in addition to tumor regression.9 Due to the central role of apoptosis in disease management, it would be desirable to have a noninvasive method to serially detect and monitor apoptosis in patients undergoing conventional cancer treatments as well as for the development and testing of new drugs.10 The development of a noninvasive detection method for apoptosis requires knowledge of the pathways and mechanisms that allow for the biochemical and morphological changes of apoptosis. Many of these biochemical and morphological changes result from the activation of a series of cysteine proteases, called caspases, which cleave target molecules after certain aspartate residues11 and produce the morphological and biochemical changes characteristic of apoptosis.12, 13, 14 Apoptosis is distinguished from other forms of cell death by its unique micromorphology changes. Perhaps the most widely recognized apoptotic morphology changes are those that occur in the cell nucleus. During apoptosis, nuclear material (DNA and other proteins) collects into condensed, coarsely granular aggregates, which can be confluent over the entire nucleus, or localized to crescent-shaped caps.15 In most, but not all cases, the nucleus then breaks up into discrete fragments, in which the characteristic segmentation of chromatin is maintained.1, 16 Dramatic changes in mitochondrial morphology, including swelling17 and shrinkage, can also occur during the early stages of apoptotic cell death.18 After treatment with apoptotic stimuli, mitochondrial christae remodel from a normal configuration to a vesicular structure to release cytochrome c into the cytosol. During this progression, the distribution of mitochondria is also affected. Fragmentation of the mitochondrial network has been described in connection with many modes of apoptosis induction. The mitochondrial network transitions from an interconnected tubular structure to a punctiform, fragmented structure at early stages of the apoptotic cascade.19 Apoptosis also induces a process known as apoptotic volume decrease (AVD), which occurs before or coincidentally with nuclear changes, and during which the cell cytoplasm progressively condenses, presumably a consequence of an expulsion of water.16 AVD is accompanied by an increase in cellular density and is often the earliest visible manifestation of apoptosis. In vitro apoptosis measurements in cell culture are commonly employed in early stage research for screening potential anticancer agents, using assay methods that exploit some of the biochemical and morphological features of apoptosis described above. These methods include: various types of optical microscopy, gel electrophoresis, DNA nick-end labeling, mitochondrial assays, and detection of apoptotic proteins. Some assays utilize flow cytometry, which can quantify the apoptotic population. All current methods, however, require either the addition of an exogenous stain or labeling agent, or the physical disruption of the culture itself.20, 21 An ideal assay for apoptosis would allow for assessment of the apoptotic state of a population of cells without altering the intracellular environment. Such a method would enable monitoring of a single culture sample (or even a single cell) over time, rather than requiring a new culture for each time point. This would allow for a more accurate assessment of cellular responses and minimize the effects of culture-to-culture biological variability. In addition, it would be ideal for this detection method to be sensitive to very early apoptotic changes, which could help elucidate the specific apoptotic pathways activated by the agents under investigation. Recently, there has been interest in developing optical methods of detecting apoptosis in cell cultures due to their inherent noninvasiveness, with a longer-term goal of in vivo measurements.22, 23, 24, 25, 26, 27 Specifically, our group has been developing elastic scattering spectroscopy (ESS) as a diagnostic tool for apoptosis. ESS is sensitive to underlying cellular micromorphology at the organelle level,28, 29, 30 so the dramatic morphology changes of apoptotic cells make apoptosis an attractive target for monitoring by this method. In recent publications,25, 26 we have demonstrated that both angle- and wavelength-dependent scattering can discriminate between apoptotic and normally propagating cells. Wavelength-dependent backscattering measurements can detect changes in scattering from Chinese hamster ovary (CHO) cells 10 to 15 min after treatment with the apoptosis-inducing agent staurosporine.26 Though we are interested in sensing changes in scattering due to apoptosis as early in the process as possible, we also wished to investigate the possibility of later scattering changes, particularly since the process can progress in culture for 24 h or more. Furthermore, when developing a new detection method for apoptosis, it is important to determine whether the new technique is specific to the apoptotic process. Having identified a reliable optical signal, we conducted a series of experiments to determine whether the observed changes in optical signature were, in fact, specifically due to apoptosis. This paper reports on that series of experiments, which verify the specific correlation of the optical signal with the apoptotic process. A discussion of the possible biological sources of the early scattering changes is presented in a companion publication. 2.Experiment Design2.1.Instrument Design and Measurement ProtocolWavelength-dependent measurements in the near-backward direction were made with instrumentation previously described and validated.26 A schematic is presented in Fig. 1. Briefly, broadband light from a xenon arc lamp (Hamamatsu, LC5, L8253) was delivered to cell cultures plated in glass-bottomed 12-well plates (Mat-Tek Corp., P12G-1.5-14-F) using a fiber probe. The probe consisted of six 100-μm illumination fibers arranged in a circularly-symmetric pattern around a single 100-μm collection fiber. The probe was positioned above the sample at a distance such that the scattered light was collected at an angle of approximately 179 deg. A kinematic mount allowed access to each of the plate's 12 wells with precise repositioning. The unpolarized scattered light was transmitted to a spectrometer (Ocean Optics, USB4000) and analyzed. The sample plate was positioned in a temperature-controlled water bath (37°C) with a black surface, both to help maintain culture conditions and to minimize collected background light. Fig. 1Schematic of instrumentation to measure the wavelength dependence of backscattered light from cell cultures. Broadband light was delivered to an adherent cell culture by a fiber optic probe. Light scattered at approximately 179 deg was collected and analyzed.  Two separate measurements were required for each sample: 1. I sample, the raw spectrum collected from a cell culture and 2. I background, the spectrum collected using all components of the system excluding the cells. Additionally, a spectral response, I spec.resp., was acquired using a spectrally-flat diffuse reflector (Spectralon, Labsphere, Inc.), to account for the spectral characteristics of the system. Pixelation noise was reduced using boxcar smoothing with a width of eight pixels corresponding to the resolution of the spectrometer (∼1.5 nm). The spectrum of each cell sample was calculated using the following formula: I spectrum = (I sample − I background)/I spec.resp.. To eliminate dependence on the intensity of incident light or the number of cells interrogated, the spectra were normalized to the area under the curve. 2.2.Correlation of ESS Changes to Drug ConcentrationA first measure of specificity for apoptosis was performed to determine if the observed optical signal is caused by the addition of staurosporine. Varying the concentration of staurosporine should alter the extent of apoptosis in a culture. The optical response is expected to correlate with the percentage of apoptotic cells, and if the optical signal is correlated with apoptosis, the kinetics of optical changes should also increase with increasing dose. To assess this, we performed scattering measurements in the near-backward direction on CHO cells and confirmed the occurrence of apoptosis with a standard assay of caspase activity. CHO cells were plated in polystyrene culture dishes and grown in Dulbecco's modification of eagle's medium (DMEM) supplemented with 10% fetal bovine serum and 1% penicillin and streptomycin. Atmosphere was held at 37°C and 5% CO2. Cells were plated in glass-bottomed 12-well plates and grown to confluence. At the beginning of the experiment, the growth medium was aspirated and replaced with clear DMEM supplemented with one of the five different concentrations of staurosporine (Sigma-Aldrich, S6942). Each treated sample was paired with a control sample containing an equivalent volume of dimethyl sulfoxide (DMSO). Thus, each plate held the five different concentrations and their corresponding controls, such that the environmental conditions were the same for all samples in each set. The scattering measurements described in Sec. 2.1 were made at various times up to 48 h, to capture the onset and progression of changes in the optical signal. Apoptotic activity in samples treated with each concentration of staurosporine was quantified 4 h and 24 h after staurosporine treatment using a luminescent assay for caspase activity (Caspase-Glo 3/7 Assay, Promega). Cells were grown in white-walled 96-well plates (Cliniplate 96-well microplate, Thermo Fisher Scientific) under the same conditions as those used in the optical experiments. 2.3.ESS Measurements in Other Cell TypesA new method for detecting apoptosis in cell cultures should not be limited to a specific response in a single cell type. Thus, the protocol from Sec. 2.2 was performed on PC-3 cells, a human prostate cancer line, to determine if the scattering characteristics of staurosporine-induced apoptosis were similar to that of CHO cells.31 2.4.ESS Measurements With Other Apoptosis InducersIf the observed optical signal is due to the apoptotic process, rather than some other feature of staurosporine treatment, different induction protocols should produce similar apoptotic morphology changes to staurosporine treatment and, therefore, similar optical signals. To confirm this, scattering measurements were performed on multiple sets of CHO cells, each treated with a different apoptosis inducer. (See list of concentrations in Sec. 3.3.) Control cultures were also considered, one without a vehicle for the compounds dissolved in water, and one with DMSO only. The concentrations used for each inducer were chosen based on the manufacturer's data sheets or a literature search.32 Scattering measurements were taken for each culture at six time points, chosen based on the features of the optical signal observed for cultures treated with 2 μm staurosporine, to allow for comparison of magnitude and timescale. The presence or absence of apoptosis in cultures treated with each inducer after 4 or 24 h was verified using the caspase activity assay described in Sec. 2.2. 2.5.Determining Specificity: Blocking the Caspase CascadeMany of the classic apoptotic morphology changes, including chromatin condensation and nuclear fragmentation, are downstream of the apoptosis-specific caspase cascade. These downstream morphology changes should be prevented if the caspase cascade is blocked. Inhibition of caspase activity by the use of broad-spectrum caspase inhibitors results in the inhibition of apoptosis as assessed by the lack of appearance of apoptotic nuclear morphology and oligonucleosomal DNA fragmentation.33 The commonly used caspase inhibitor carbobenzoxy-valyl-alanyl-aspartyl-[O-methyl]-fluoromethylketone (z-VAD-fmk), which binds to the catalytic site of the caspase proteases and can thereby block apoptosis induction, was used in this study. We expect that if the features of the optical signal observed in CHO cells following treatment with staurosporine result from apoptotic morphology changes that are downstream of the caspase cascade, blocking caspase acitivty, and therefore, the downstream morphological changes, should attenuate the optical response. Conversely, if the optical signal results from morphological changes upstream of the caspase cascade, blocking that pathway should have little effect on the optical response. These measurements should allow identification of optical features that are necessarily specific to the apoptotic process. We note that while features due to upstream morphology changes may not necessarily be specific to apoptosis, they may nevertheless be characteristic and yield useful diagnostic information. Confluent cultures of CHO cells were treated with one of the following: a control volume of DMSO; 2 μm staurosporine in DMSO; 2 μm staurosporine in DMSO plus 50 μm z-VAD-fmk (Enzo Life Sciences, BML-P416-0001); or 50 μm z-VAD-fmk alone. Scattering measurements were made at times up to 48 h following treatment. The presence or absence of apoptosis in cultures treated with staurosporine or staurosporine plus z-VAD-fmk was determined by the caspase assay described in Sec. 2.2. 3.Results3.1.Dose Response: CHO Cells Treated with StaurosporineScattering measurements in the near-backward direction were performed on six sets of samples. Cultures treated with staurosporine showed both an early optical signal, characterized (simplistically) by an overall decrease in the (negative) spectral slope, as well as a late optical signal characterized by an increase in spectral slope. Representative spectra in Fig. 2, taken from cultures treated with 2 μm staurosporine (dotted red) and the corresponding control (solid black) at 30 m and 24 h post-treatment, respectively, illustrate the early (top) and late optical signals (bottom). To determine the statistical significance of these scattering changes, the slope ratios of ESS spectra at 450 and 700 nm were calculated for all cultures of CHO cells treated with either 2 μm staurosporine or 0.2% DMSO (combining results from Secs. 3.1, 3.3, 3.4; n = 17). A paired student's t-test comparing the ratio from the DMSO and staurosporine-treated cells revealed that the spectral slope changes were significant both at 30 m (p < 10−5) and at 24 h (p < 10−8). Fig. 2Representative spectra showing early and late optical signals. Spectra were taken from control cultures containing 0.2% DMSO only (solid black) and cultures treated with 2 μm staurosporine carried in DMSO for 30 m and 24 h.  Both the kinetics and the magnitude of these signals were dependent on staurosporine concentration. These qualitative dose-response results are summarized in Table 1, where the onset times of the early and late optical signals, as well as their relative magnitudes, are indicated. The magnitude of the optical signal is described qualitatively in terms of the slope difference of the ESS signal between CHO cells treated with 0.5 μm staurosporine and the control population. Table 1A summary of scattering changes observed in cell cultures (n = 6) treated with five different concentrations of the apoptosis inducer, staurosporine. The onset times for early and late scattering changes as well as relative magnitudes of the changes are indicated for each concentration. The relative magnitudes of the effect are expressed in terms of the arbitrary unit, +, relating to the degree of the slope differences in ESS signal between CHO cells treated with 0.5 μm staurosporine and the corresponding control cells.
The cultures treated with 0.5 μm staurosporine showed only slight changes in optical scattering. The magnitude of both the early and late optical signals was greater for the cultures treated with 1 μm staurosporine than for the cultures treated with 0.5 μm staurosporine. The three highest concentrations of staurosporine produced an optical signal with still greater magnitude. For concentrations that produced detectable changes in scattering, faster kinetics was apparent with increasing concentration. The early optical signal occurred after 30 m of treatment with 0.5 μm staurosporine and after 15 m of treatment with 1 μm staurosporine. The cultures treated with the three higher concentrations produced early optical signals beginning earlier than 15 m. The strength of the optical signal at 15 m was greater for higher concentrations, suggesting progressively early onset times. The onset of the late optical signal was also accelerated in cultures treated with higher concentrations of staurosporine. The incubation time required for late signal onset decreased from 12 h in cultures treated with the lowest concentration of staurosporine to 4 to 6 h in cultures treated with 5 and 10 μm staurosporine. This indicates that the time required for onset of apoptosis in a number of cells is sufficient to produce detectable differences in scattering decreases with increasing inducer concentration. The average and range (n = 3) of caspase activity produced by each concentration of staurosporine or DMSO are shown in Fig. 3. In each of the control samples, a low level of caspase activity was observed, corresponding to a low level of apoptosis. At 4 h post-treatment, the treated samples show a monotonic increase of caspase activity with increasing inducer concentration. By 24 h post-treatment, each treated sample displays similar high levels of caspase activation. Fig. 3Average results of a fluorometic assay (n = 3, error bars depict the range of measurement) to determine apoptotic activity in cultures treated with increasing doses of staurosporine and their corresponding controls by measuring the activated forms of caspase-3 and caspase-7.  From the correlation between the scattering and caspase activity data, it is evident that the magnitude and timing of the features of the optical signal are correlated with treatment dose of staurosporine. Furthermore, the caspase activity assay data also suggests that the optical signal is related to staurosporine-induced apoptotic activity present in the cultures. 3.2.Dose Response: PC-3 Cells Treated with StaurosporineFollowing the same protocol as for CHO cells, scattering measurements were performed on two sets of PC-3 cultures. The representative spectra in Fig. 4, taken from PC-3 cultures treated with 2 μm staurosporine (dotted red) or 1% DMSO (solid black) for 30 m and 24 h illustrate both early and late changes in optical scattering. The relative timing and magnitude of those features as a function of staurosporine concentration are summarized in Table 2. Again, as in Table 1, the magnitude of the optical “signal” is described qualitatively in terms of the slope difference of the ESS signal between PC-3 cells treated with 0.5 μm staurosporine and the control population. Interestingly, the kinetics of the early optical signal were similar for both cell types, while the kinetics of the late optical signal were slower in PC-3 cells than in CHO cells for the lower concentrations, but were faster than that of the CHO cells at the 10 μm concentration. Nevertheless, the qualitative features of the signal were consistent between the two cell types despite the differing dynamics. Thus, the optical signatures observed upon apoptosis induction with staurosporine are not restricted to a single cell type. Fig. 4Representative spectra showing early and late optical signals produced by PC-3 cells. Spectra from control cultures treated with 1% DMSO (solid black) and cultures treated with 10 μm staurosporine are compared at 4 h and 24 h.  Table 2A summary of scattering changes observed in cell cultures of PC-3 cells (n = 2) treated with five different concentrations of the apoptosis inducer, staurosporine. The onset times for early and late scattering changes as well as relative magnitudes of the changes are indicated for each concentration. The relative magnitudes of the effect are expressed in terms of the arbitrary unit, +, relating to the degree of the slope differences in ESS signal between PC-3 cells treated with 0.5 μm staurosporine and the corresponding control cells.
3.3.Response of CHO cells to Other Apoptosis Induction ProtocolsScattering measurements were performed on CHO cells treated with six different protocols to induce apoptosis. At least two sets of measurements were acquired from cultures treated with each inducer. Four of the six inducers tested produced changes in optical signal. Like the spectra produced by staurosporine, these changes in optical signal were characterized by an overall decrease in spectral slope at early times and an overall increase in spectral slope at later times. Both the onset times of the early and late optical signals and the magnitude of those signals varied with apoptosis inducer, as summarized in Table 3. Table 3Summary of the timing of scattering changes observed in cell cultures treated with staurosporine and six other apoptosis inducers. The onset times for early and late scattering changes as well as the mechanism of action is listed for each inducer.
The results of the fluorometric caspase assay are shown in Fig. 5. The average caspase activity (and the range of measured activity) for each of the six treatments is plotted along with a medium-only control and a DMSO-only control, and the level of caspase activity in cells treated with staurosporine for comparison. Fig. 5Caspase-3 and caspase-7 activity as measured by standard assay for multiple apoptosis inducers. The average activity (n = 3) for each inducer is plotted with the range of measured values. The values for Fas ligand and paclitaxel are from a single measurement. 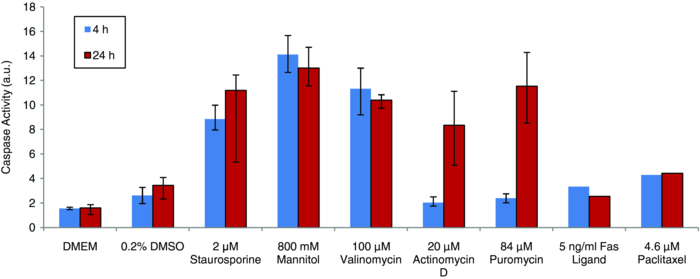 While several of these treatments induced apoptosis in CHO cells, it is not surprising that some did not. The response of a cell depends upon its specific machinery and receptors, so not all cells will respond to all apoptotic stimuli. The inducers chosen for this study induce apoptosis through different mechanisms (listed in Table 3), so these measurements help to ensure that the optical response is not pathway-specific. Of the six conditions tested, four produced appreciable increased levels of apoptosis in CHO cells, while two did not. 800 mM mannitol produced levels of apoptosis that were approximately the same as staurosporine treatment and valinomycin produced higher levels. Actinomycin D and puromycin showed no appreciable caspase activity above the basal level of the controls at 4 h, but produced levels similar to staurosporine treatment at 24 h. Treatment with either Fas ligand or puromycin yielded only a slight increase of caspase activity above the activity of the controls. When considering both the scattering data and the caspase activity for each condition, it is encouraging that each treatment that produced an optical response also showed elevated levels of apoptotic activity. Furthermore, in the cases were no optical signal was present, the caspase assay confirmed that there was no increase of apoptosis for those conditions. Additionally, the timing of the features of the optical signal and levels of caspase activation were consistent. Delayed caspase activation correlated with late onset of the optical signals. We note that the correlation is not exact in all cases, and is likely the result of additional apoptotic mechanisms not measurable by caspase activity. The findings that the optical response due to staurosporine treatment is dose-dependent and is not restricted to a specific cell line, and that similar optical responses result from treatment with inducers with different mechanisms of action, suggest that the observed optical signals result from common apoptotic morphology changes rather than being an additional side effect of a specific type of treatment. 3.4.Blocking the Caspase CascadeScattering measurements were performed on nine sets of samples to evaluate the impact of the caspase inhibitor z-VAD-fmk on staurosporine-induced ESS signals, as described in Sec. 2.5. Figure 6 shows the average spectra of the untreated control (black), and of cells treated with staurosporine (red), and the sample containing both staurosporine and z-VAD-fmk (green). No scattering changes were observed in the culture treated with z-VAD-fmk alone (data not shown). Fig. 6ESS measurements of CHO cells treated with DMSO only (thin black), staurosporine (thick red), and staurosporine plus the caspase inhibitor z-VAD-fmk (thick dotted green). 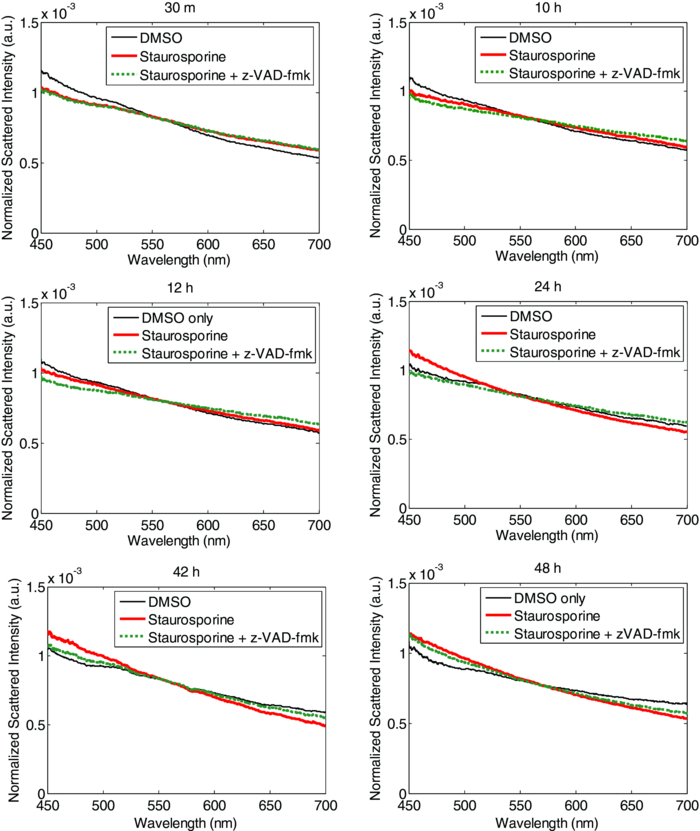 z-VAD-fmk had no effect on the early optical signal produced by staurosporine treatment, indicating that the apoptotic changes responsible for the early optical signature is upstream of the caspase cascade. The specific biological origin of the early optical signal is discussed in the accompanying paper. Through the first 6 h, cells treated with staurosporine and z-VAD-fmk produced the same ESS spectrum as cells treated with staurosporine alone. This indicates that z-VAD-fmk does not inhibit the typical early manifestations of apoptosis upstream of the caspase cascade. In contrast, the onset of late scattering changes was affected when the caspase cascade was blocked by z-VAD-fmk. The late optical signal occurred after the first 8 h of treatment with staurosporine alone, but not until sometime between 36 and 48 h in the culture co-treated with z-VAD-fmk. By 48 h, the cells treated with staurosporine and z-VAD-fmk produced a spectrum very similar to those treated with staurosporine alone. This implies that z-VAD-fmk does not indefinitely impede apoptosis in CHO cells treated under these conditions. The optical response to staurosporine can be described as three phases: 1. an initial phase characterized by a decrease in slope of the optical signal (15 m to 6 h); 2. a second phase resulting in a loss of that optical signal (8 to 12 h); and 3. a third phase characterized by an increase in slope (>18 h). When considered in this fashion, the inhibition of the caspase cascade (with z-VAD-fmk) delays the onset of both the second and third phases. The studies above do not yield enough information to determine whether phases 2. and 3. of the optical signal are due to the same underlying biological mechanism, but further discussion can be found in the companion paper to this work. The impact of z-VAD-fmk on staurosporine-activated caspase activity is shown in Fig. 7. Low caspase activity was seen at both 4 and 24 h under the three control conditions (DMEM only, DMSO only, and z-VAD-fmk only). Cells treated with staurosporine showed a marked increase in caspase activity at both times. The culture containing both staurosporine and z-VAD-fmk had very low levels of caspase activity at both 4 and 24 h of treatment, indicating that z-VAD-fmk effectively blocks the caspase cascade during the first 24 h of staurosporine treatment. Fig. 7Average caspase activity (and the range of values measured, n = 3) for CHO cells treated with: DMEM, 0.2% DMSO, 50 μm z-VAD-fmk, 2 μm staurosporine, or 2 μm staurosporine plus 50 μm z-VAD-fmk. 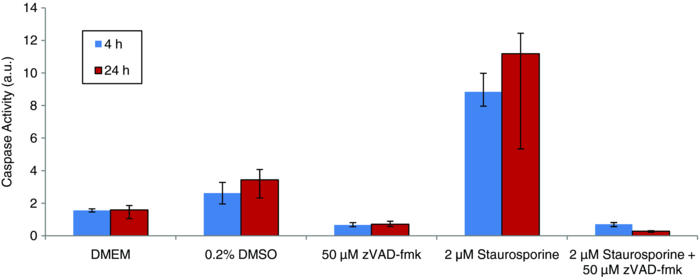 While z-VAD-fmk did not prevent the early signal, it did, nonetheless, slow the kinetics of the late optical signal. The lack of late optical signal correlates with the absence of significant caspase activity at 4 and 24 h. These observations are consistent with the hypothesis that an apoptotic morphological change downstream of the caspase cascade is responsible for the late optical signal. Furthermore, the overall increase in negative spectral slope is indicative of the presence of smaller scattering centers. This would be consistent with the appearance of condensed chromatin, mitochondrial christae reformation, and cytoskeletal disruption, which are characteristic of apoptosis. This hypothesis initially seems at odds with the eventual appearance of a late optical signal in cultures co-treated with z-VAD-fmk. If the caspase cascade remains blocked, and the late signal is due to an apoptotic change downstream of the caspase cascade, this should not occur. Staurosporine, however, has been shown to induce both caspase-dependent apoptosis and caspase-independent apoptosis, which occurs on a longer timescale than the caspase-dependent events.33, 41 In the slower type of apoptosis, cells still exhibit the morphological and biochemical features despite effective caspase inhibition. If staurosporine induces caspase-independent apoptosis in CHO cells, and the apoptotic morphologies are maintained but occur on a slower timescale, this would account for the very late scattering changes despite inhibition with z-VAD-fmk. We also note that despite the addition of z-VAD-fmk, staurosporine still causes the death of CHO cells. Since mitochondria are involved in apoptosis upstream of the caspase cascade, addition of z-VAD-fmk does not prevent mitochondrial changes. Early in apoptosis, mitochondria rupture and release cytochrome c into the cytosol. This rupture results in the loss of mitochondrial function and energy production, and ultimately the death of the cell. This cell death occurs on a relatively slow timescale42 and may contribute to late changes in ESS spectrum when the caspase cascade is blocked. 4.Conclusions and Future StudiesCell cultures treated with inducers of apoptosis show both an early optical signal, characterized by an overall decrease in spectral slope, as well as a late optical signal characterized by an increase in spectral slope. The experiments presented investigate the relationship between observed changes in optical scattering and the apoptotic process itself. We conclude that the optical signal observed is directly indicative of apoptosis, based on the following observations: 1. The magnitude and kinetics of the optical signal in CHO cells depend on the concentration of apoptosis inducer. 2. The optical signal is not restricted to a single cell type. The magnitude and kinetics of the optical signal induced by staurosporine treatment of PC-3 cells are similar to those in CHO cells. 3. The optical signal is not restricted to a single type of inducer. An optical signal with the same qualitative early and late features is produced with various treatment protocols that are known to induce apoptosis in CHO cells through different mechanisms. The early and late optical signals are absent in the case of treatments that do not induce apoptosis in these cells. 4. Inhibition of the apoptosis-specific caspase cascade during staurosporine treatment delays the onset of the late optical signal. Having shown that the observed changes in wavelength-dependent backscattering are indicative of apoptosis in cell cultures the next step in developing ESS as a reliable diagnostic tool for apoptosis is to determine the specific morphology changes responsible for the changes in scattered spectrum. Considering both the timescale of the late optical signal and the evidence that these changes occur downstream of the caspase cascade, the late optical signal is likely due to the later stage apoptotic changes. These may include the classic morphology changes of chromatin condensation, mitochondrial christae remodeling, and cytoskeletal disruption. As mentioned above, some studies suggest that mitochondrial fragmentation occurs in parallel with the formation of apoptotic bodies and an increase in DNA fragmentation. In this case, mitochondrial fragmentation, if it occurs in CHO cells, could account, at least in part, for some of the observed late signal. We note that the qualitative feature of the late signal—the relative increase in scattering at shorter wavelengths—is indicative of an increased preponderance of smaller scatterers. This is consistent with all of the morphology changes discussed above, where material and organelles condense and segregate into smaller structures. Further pathway studies and high-resolution imaging will be required to determine the specific apoptotic morphology changes responsible for the late optical signal. Finally, we note that the early optical signal is unaffected by blockage of the caspase cascade. While we cannot conclude that the origin of the early signal is necessarily specific to apoptosis, it is still possible that early scattering changes arise from one or more apoptotic morphology changes upstream of the caspase cascade. The fact that the early signal appears during apoptosis induced with multiple preparations through different mechanisms suggests that it is indicative of the process and can still yield diagnostic information. An investigation of the origins of the early optical signal during apoptosis induction is the subject of a companion publication. AcknowledgmentsThis work was supported in part by the NIH/NIBIB (R21 EB009543) and by the Boston University Photonics Center. ReferencesJ. F. R. Kerr,
J. Searle,
B. V. Harmon, and
C. J. Bishop,
“Apoptosis,”
Perspectives on Mammalian Cell Death, 93
–128 Oxford University Press, Oxford United Kingdom
(1987). Google Scholar
G. Manjo and
I. Joris,
“Apoptosis, oncosis, and necrosis: An overview of cell death,”
Am. J. Pathol., 146
(1), 3
–15
(1995). Google Scholar
P. J. M. Best,
D. Hasdai,
G. Sangiorgi,
R. S. Schwartz,
D. R. Holmes Jr.,
R. D. Simari, and
A. Lerman,
“Apoptosis: basic concepts and implications in coronary artery disease,”
Arterioscler., Thromb., Vasc. Biol., 19 14
–22
(1999). https://doi.org/10.1161/01.ATV.19.1.14 Google Scholar
J. M. Brown and
L. D. Attardi,
“The role of apoptosis in cancer development and treatment response,”
Nat. Rev. Cancer, 5
(3), 231
–237
(2005). https://doi.org/10.1038/nrc1560 Google Scholar
W. Hu and
J. J. Kavanagh,
“Anticancer therapy targeting the apoptotic pathway,”
The Lancet Oncol., 4 721
–729
(2003). https://doi.org/10.1016/S1470-2045(03)01277-4 Google Scholar
S. W. Lowe and
A. W. Lin,
“Apoptosis in cancer,”
Carcinogenesis, 21
(3), 485
–495
(2000). https://doi.org/10.1093/carcin/21.3.485 Google Scholar
D. J. Waxman and
P. S. Schwartz,
“Harnessing apoptosis for improved anticancer gene therapy,”
Cancer Res., 63 8563
–8572
(2003). Google Scholar
J. C. Reed,
“Apoptosis-targeted therapies for cancer,”
Cancer Cells, 3 17
–22
(2003). https://doi.org/10.1016/S1535-6108(02)00241-6 Google Scholar
J. F. R. Kerr,
C. M. Winterford, and
B. V. Harmon,
“Apoptosis: Its significance in cancer and cancer therapy,”
Cancer, 73
(8), 2013
–2026
(1994). https://doi.org/10.1002/1097-0142(19940415)73:8<2013::AID-CNCR2820730802>3.0.CO;2-J Google Scholar
F. G. Blankenburg,
“In vivo detection of apoptosis,”
J. Nucl. Med., 49
(Supplement 2), 81S
–95S
(2008). https://doi.org/10.2967/jnumed.107.045898 Google Scholar
J. M. Adams,
“Ways of dying: multiple pathways to apoptosis,”
Genes Dev., 17 2481
–2495
(2003). https://doi.org/10.1101/gad.1126903 Google Scholar
K. J. Zimmerman and
D. R. Green,
“How cells die: Apoptosis pathways,”
J. Allergy Clin. Immunol., 108
(4), S99
–S103
(2001). https://doi.org/10.1067/mai.2001.117819 Google Scholar
L. H. Boise and
C. M. Collins,
“Salmonella-induced cell death: apoptosis, necrosis or programmed cell death?,”
Trends Microbiol., 9
(2), 64
–67
(2001). https://doi.org/10.1016/S0966-842X(00)01937-5 Google Scholar
S. L. Fink and
B. T. Cookson,
“Apoptosis, pyroptosis, and necrosis: Mechanistic description of dead and dying Eukaryotic cells,”
Infect. Immun., 73
(4), 1907
–1916
(2005). https://doi.org/10.1128/IAI.73.4.1907-1916.2005 Google Scholar
A. H. Wyllie,
J. F. R. Kerr, and
A. R. Currie,
“Cell death: the significance of apoptosis,”
Int. Rev. Cytol., 68 251
–306
(1980). https://doi.org/10.1016/S0074-7696(08)62312-8 Google Scholar
J. F. R. Kerr,
A. H. Wyllie, and
A. R. Currie,
“Apoptosis: a basic biological phenomenon with wide-ranging implications in tissue kinetics,”
Br. J. Cancer, 26 239
–257
(1972). https://doi.org/10.1038/bjc.1972.33 Google Scholar
M. G. Vander Heiden,
N. S. Chandel,
E. K. Williamson,
P. T. Schumacker, and
C. B. Thompson,
“Bcl-xL regulates the membrane potential and volume homeostasis of mitochondria,”
Cells, 91 627
–637
(1997). https://doi.org/10.1016/S0092-8674(00)80450-X Google Scholar
S. Desagher and
J.-C. Martinou,
“Mitochondria as the central control point of apoptosis,”
Trends Cell Biol., 10 369
–377
(2000). https://doi.org/10.1016/S0962-8924(00)01803-1 Google Scholar
M. Karbowski and
R. J. Youle,
“Dynamics of mitochondrial morphology in healthy cells and during apoptosis,”
Cell Death Differ., 10 870
–880
(2003). https://doi.org/10.1038/sj.cdd.4401260 Google Scholar
M. C. Willingham,
“Cytochemical methods for the detection of apoptosis,”
J. Histochem. Cytochem., 47
(9), 1101
–1109
(1999). https://doi.org/10.1177/002215549904700901 Google Scholar
R. Sgonc and
J. Gruber,
“Apoptosis detection: an overview,”
Exp. Gerontol., 33 525
–533
(1998). https://doi.org/10.1016/S0531-5565(98)00031-X Google Scholar
N. N. Boustany,
S. C. Kuo, and
N. V. Thakor,
“Optical scatter imaging: subcellular morphometry in situ with Fourier filtering,”
Opt. Lett., 26
(14), 1063
–1065
(2001). https://doi.org/10.1364/OL.26.001063 Google Scholar
N. N. Boustany,
Y. C. Tsai,
B. Pfister,
W. M. Joiner,
G. A. Oyler, and
N. V. Thakor,
“BCL-x(L)-dependent light scattering by apoptotic cells,”
Biophys. J., 87
(6), 4163
–4171
(2004). https://doi.org/10.1529/biophysj.104.048736 Google Scholar
J. D. Wilson,
B. R. Giesselman,
S. Mitra, and
T. H. Foster,
“Lysosome-damage-induced scattering changes coincide with release of cytochrome c,”
Opt. Lett., 32
(17), 2517
–2519
(2007). https://doi.org/10.1364/OL.32.002517 Google Scholar
C. S. Mulvey,
A. L. Curtis,
S. K. Singh, and
I. J. Bigio,
“Elastic scattering spectroscopy as a diagnostic tool for apoptosis in cell cultures,”
IEEE J. Sel. Top. Quantum Electron., 13
(6), 1663
–1670
(2007). https://doi.org/10.1109/JSTQE.2007.910115 Google Scholar
C. S. Mulvey,
C. A. Sherwood, and
I. J. Bigio,
“Wavelength-dependent backscattering measurements for quantitiative real-time monitoring of apoptosis in living cells,”
J. Biomed. Opt., 14
(6), 064013
(2009). https://doi.org/10.1117/1.3259363 Google Scholar
K. J. Chalut,
J. H. Ostrander,
M. G. Giacomelli, and
A. Wax,
“Light scattering measurements of subcellular structure provide noninvasive early detection of chemotherapy-induced apoptosis,”
Cancer Res., 69
(3), 1199
–1204
(2009). https://doi.org/10.1158/0008-5472.CAN-08-3079 Google Scholar
H. Fang,
M. Ollero,
E. Vitkin,
L. M. Kimerer,
P. B. Cipolloni,
M. M. Zaman,
S. D. Freedman,
I. J. Bigio,
I. Tizkan,
E. B. Hanlon, and
L. T. Perelman,
“Noninvasive sizing of subcellular organelles with light scattering spectroscopy,”
IEEE J. Sel. Top. Quantum Electron., 9 267
–276
(2003). https://doi.org/10.1109/JSTQE.2003.812515 Google Scholar
H. Fang,
L. Qiu,
M. M. Zaman,
E. Vitkin,
S. Salahuddin,
C. Andersson,
L. M. Kimerer,
P. B. Cipolloni,
M. D. Modell,
B. S. Turner,
S. E. Keates,
I. J. Bigio,
I. Itzkan,
S. D. Freedman,
R. Bansil,
E. B. Hanlon, and
L. T. Perelman,
“Confocal light absorption and scattering spectroscopic (CLASS) microscopy,”
Appl. Opt., 46 1760
–1769
(2007). https://doi.org/10.1364/AO.46.001760 Google Scholar
I. Itzkan,
L. Qui,
H. Fang,
M. M. Zaman,
E. Vitkin,
I. C. Ghiran,
S. Salahuddin,
M. D. Modell,
C. Andersson,
L. M. Kimerer,
P. B. Cipolloni,
K.-H. Lim,
S. D. Freedman,
I. J. Bigio,
B. P. Sachs,
E. B. Hanlon, and
L. T. Perelman,
“Confocal light absorption & scattering spectroscopic (CLASS) microscopy monitors organelles in live cells with no exogenous labels,”
Proc. Natl. Acad. Sci. U.S.A., 104 17255
–17260
(2007). https://doi.org/10.1073/pnas.0708669104 Google Scholar
M. E. Kaighn,
K. S. Narayan,
Y. Ohnuki,
J. F. Lechner, and
L. W. Jones,
“Establishment and characterization of a human prostatic carcinoma cell line (PC-3),”
Invest. Urol., 17
(1), 16
–23
(1979). Google Scholar
R. Abdalah,
L. Wei,
K. Francis, and
S. P. Yu. “,
“Valinomycin-induced apoptosis in Chinese hamster ovary cells,”
Neurosci. Lett., 405 68
–73
(2006). https://doi.org/10.1016/j.neulet.2006.06.055 Google Scholar
C. A. Belmokhtar,
J. Hillion, and
E. Ségal-Bendirdjian,
“Staurosporine induces apoptosis through both caspase-dependent and caspase-independent mechanisms,”
Oncogene, 20 3354
–3362
(2001). https://doi.org/10.1038/sj.onc.1204436 Google Scholar
R. Bertrand,
E. Solary,
P. O’Connor,
K. W. Kohn, and
Y. Pommier,
“Induction of a Common Pathway of Apoptosis by Staurosporine,”
Exp. Cell Res., 211 314
–321
(1994). https://doi.org/10.1006/excr.1994.1093 Google Scholar
E. Maeno,
T. Shimizu, and
Y. Okada,
“Normotonic cell shrinkage induces apoptosis under extracellular low Cl- conditions in human lymphoid and epithelial cells,”
Acta Physiol., 187 217
–222
(2006). https://doi.org/10.1111/j.1748-1716.2006.01554.x Google Scholar
R. Abdalah,
L. Wei,
K. Francis, and
S. P. Yu,
“Valinomycin-induced apoptosis in Chinese hamster ovary cells,”
Neurosci. Lett., 405 68
–73
(2006). https://doi.org/10.1016/j.neulet.2006.06.055 Google Scholar
J. Kleef,
M. Kornmann,
H. Sawhney, and
M. Korc,
“Actinomycin D induces apoptosis and inhibits growth of pancreatic cancer cells,”
Int. J. Cancer, 86 399
–407
(2000). https://doi.org/10.1002/(SICI)1097-0215(20000501)86:3<399::AID-IJC15>3.0.CO;2-G Google Scholar
I. Tabuchi,
“Next-generation protein-handling method: puromycin analogue technology,”
Biochem. Biophys. Res. Commun., 305 1
–5
(2003). https://doi.org/10.1016/S0006-291X(03)00686-7 Google Scholar
S. Nagata,
“Fas ligand-induced apoptosis,”
Ann. Rev. Genet., 33 29
–55
(1999). https://doi.org/10.1146/annurev.genet.33.1.29 Google Scholar
P. L. Judson,
J. M. Watson,
P. A. Gehrig,
W. C. Fowler Jr., and
J. S. Haskill,
“Cisplatin inhibits paclitaxel-induced apoptosis in cisplatin-resistant ovarian cancer cell lines: Possible explanation for failure of combination therapy,”
Cancer Res., 59 2425
–2432
(1999). Google Scholar
X. D. Zhang,
S. K. Gillespie, and
P. Hershey,
“Staurosporine induces apoptosis of melanoma by both caspase-dependent and –independent apoptotic pathways,”
Molecular Cancer Therapeutics, 3 187
–197
(2004). Google Scholar
L. Lartigue,
Y. Kushnareva,
Y. Seong,
H. Lin,
B. Faustin, and
D. D. Newmeyer,
“Caspase-independent mitochondrial cell death results from loss of respiration, not cytotoxic protein release,”
Mol. Biol. Cell, 20 4871
–4884
(2009). https://doi.org/10.1091/mbc.E09-07-0649 Google Scholar
|


