
|
|
1.IntroductionMultiple research groups have taken advantage of the extreme sensitivity of Raman spectroscopy to detect subtle changes in a variety of samples. Raman spectroscopy has been used to solve many types of problems, from detecting malignant areas in various sites, such as the cervix,1 bladder,2, 3 colon,4, 5 breast,6, 7 and esophagus8, 9 in vivo and in vitro, detecting controlled substances,10 and authenticating works of art.11 Raman spectroscopy is useful for multiple applications because it is a molecular-specific technique that provides detailed information about the biochemical composition of a sample by probing vibrational or rotational transitions in chemical bonds. Therefore, a Raman spectrum consists of a series of spectrally narrow peaks and valleys that represent the different vibrational modes of specific scattering molecules. These peaks are associated with specific bonds, such that a Raman spectrum may be referred to as a biochemical fingerprint of a molecule, tissue, or sample. Changes in peaks may be related to differences in the concentration of glycogen or collagen,12 which is useful in cancer detection, benzoic acid rings for drug detection,13 and natural or synthetic stains to decipher ages of works of art.14 Although Raman spectroscopy is inherently a sensitive technique, previous studies using Raman to detect cervical dysplasia both in vivo and in vitro have reported a wide range of sensitivity (70–100%) and specificity (70–100%) rates.1, 15, 16, 17, 18, 19 Krishna used a benchtop Raman spectroscopy system to acquire information from cervical samples ex vivo and classified normal compared to malignant samples at sensitivity and specificity rates of 75–99.5%.19 Because infection with certain strains of human papillomavirus (HPV) is the cause of cervical dysplasia in >99% of cases worldwide,20, 21, 22 certain research groups have used Raman spectroscopy to identify differences between HPV types. Jess used a confocal Raman microscope system and were able to discriminate varying HPV types in live and fixed cells with sensitivity and specificity rates of 70–100%.15 Our research group has used a portable probe-based Raman spectroscopy system to distinguish between normal and malignant cervical samples in cell culture, in vitro and in vivo. The sensitivity and specificity rates of this work have ranged between 81 and 97%.1, 16, 17 Variations in classification rates that are observed when using Raman spectroscopy to detect malignant areas of the cervix are a hurdle that must be overcome in order for this technology to benefit clinical practice. Fortunately, as more research into using Raman spectroscopy to diagnose cervical dysplasia has been conducted, it has become apparent that by accounting for normal patient variations, the sensitivity and specificity of Raman for diagnosing disease can increase.23, 24 Similar research on inherent normal patient variability has been seen when using Raman on other tissue sites, such as the colon and the breast.25, 26, 27 In many cases, accounting for these normal differences has led to an increase in both the sensitivity and specificity rates of classifying normal spectra compared to disease. Specifically, research from our lab has shown that both hormonal differences due to menstrual cycles and menopause23 and previous disease or presence near disease24 have a significant impact on the Raman spectra acquired from benign areas of the cervix in vivo as well as the classification of spectra acquired from metaplastic and dysplastic sites. During a menstrual cycle and menopause, varying levels of hormones are released throughout the body that can cause changes in the cervix, including softening, drying, or thinning.28, 29 Permanent field effects or malignancy-associated changes that result from the presence or prior history of disease may account for the significant effect of such differences on Raman spectra.30, 31 Accounting for hormonal levels and history of disease prior to disease classification resulted in sensitivity and specificity rates of >95%. By recognizing and accounting for these normal variations prior to disease classification, better training sets were used for the classification algorithms and, therefore, differences among spectra were more likely to result from malignancy than normal variations. Other factors may further improve cervical disease classification with Raman spectroscopy. Race and ethnicity, for example, as well as socioeconomic status are all correlated with different incidences of cervical malignancies.32 In 2010, black and Hispanic populations had the highest incidence of and mortality rates from cervical dysplasia in the U.S. (11.1 cases and 4.6 deaths and 12.7 cases and 3.1 deaths per 100,000 women, respectively, compared to 7.9 cases and 2.2 deaths per 100,000 white women).33, 34 Worldwide, cervical cancer is the fifth most common cancer for women and the most common cancer for women in Central America and southern Africa.35 These differences are likely correlated with reduced access to routine care and screening. Obesity is also associated with higher rates of cancer, including cervical cancer.22, 36, 37 There are many potential reasons for the contribution of obesity to cervical cancer, including differences in vaginal flora patterns, steroid hormone and cholesterol levels, cultural norms, and bacterial or viral infections.36 HPV could also be a potential factor in the differences in incidence and mortality rates because several at-risk strains are more prevalent in certain racial and ethnic populations.20, 21, 22 Any of these characteristics may significantly influence the biochemical makeup of the cervix and, thus, the Raman spectra acquired from the cervix. Such important variables must be accounted for prior to disease classification to increase classification accuracy rates. It is interesting to explore whether other optical techniques are similarly influenced by normal patient variables. Studies have shown that fluorescence spectroscopy is not significantly influenced by changes that occur during a woman's menstrual cycle or menopause because it only causes a variation of 8–16% in normal spectra.38, 39 This result suggests that fluorescence spectroscopy is not sensitive to the small biochemical changes that occur as a result of the fluctuations in normal hormonal levels. Biochemical changes due to hormonal fluctuations, age, and parity have been observed in the breast using reflectance and transmittance spectroscopy;40, 41 however, their effect on disease classification has yet to be determined. Similar results have been found in the cervix,42 but these results are controlled by levels of hemoglobin, water, and lipids, instead of the broader biochemical fingerprint obtained with Raman spectroscopy. Kelly used infrared (IR) spectroscopy to separate samples based on HPV infection and age and were able to show separation of samples using principal component analysis followed by linear discriminant analysis, but this in vitro study was performed on cells grown in culture.43 IR spectroscopy, analogous to Raman spectroscopy, may perform with similar sensitivity rates. However, the water content found in bulk tissue may inhibit IR spectra, thereby reducing its utility as a tool for in vivo detection. To our knowledge, there are no published reports that consider the effect of race/ethnicity, body mass index (BMI), obstetric history, or socioeconomic status on optical measurements. The goal of this study is to examine the significance of such normal variations on the classification of Raman spectra. Implementing Raman spectroscopy in a clinical setting will require it to be successfully applied to any patient population, regardless of race or ethnicity, BMI, parity, or socioeconomic status. To accomplish this goal, Raman measurements were acquired from a diverse patient population without current or previous disease. A classification algorithm, sparse multinomial logistic regression (SMLR), was then used to determine if the Raman spectra were significantly affected by race/ethnicity, BMI, obstetric history, or socioeconomic status. 2.Materials and MethodsIn our lab, previous studies were performed on a predominantly white population with BMI levels of normal to overweight.1, 17, 23, 24 For this study, patients were recruited from the county hospital in Nashville, Tennessee (Nashville General Hospital at Meharry) to acquire data from patients of varying racial/ethnic background, BMI, obstetric history, and socioeconomic status. This study was approved by the Meharry Medical College Institutional Review Board. 2.1.Patient EnrollmentA total of 75 adult female patients undergoing a routine Pap smear consented to participate in the study. The patient's age, date of last menstrual period, use of artificial hormones, menopausal status, height, weight, obstetric history, ethnicity, address, insurance, relevant medical history, and any previous abnormal Pap smears were all noted upon chart review. After the cervix was exposed and visually examined by the attending physician, the cervix was wiped clean with a dry cotton swab followed by saline. Raman measurements were then taken from three locations on the ectocervix. Next, the Pap smear procedure was done according to standard clinical protocol. The spectra were correlated with histological results and considered normal if the Pap smear was negative. 2.2.Patient InformationPatients were stratified according to four sets of data to determine the sensitivity of Raman spectroscopy: (i) Race/ethnicity (white, black, and Hispanic), (ii) BMI category (normal, overweight, and obese), (iii) parity (no pregnancies or ≥1), and (iv) socioeconomic status (uninsured or insured, determined by whether the patient had government-subsidized or private health insurance). Racial or ethnic group was determined by what the patient identified herself as. BMI was calculated (using the following formula) from the height and weight measured the same day when Raman spectra were acquired:44
[TeX:]
\documentclass[12pt]{minimal}\begin{document}\begin{eqnarray*}
{\rm BMI} = \frac{{{\rm mass}({\rm lb}) \times 703}}{{[{\rm height}({\rm in})]^2 }}.
\end{eqnarray*}\end{document}
BMI values that define specific categories used in this study—normal, overweight, and obese—are presented in Table 1. Obstetric history was determined from a chart review.
Table 1Weight status based on body mass index (BMI).
2.3.Instrumentation and Data ProcessingRaman spectra were collected in vivo using a portable Raman spectroscopy system, consisting of a 785-nm diode laser (PI-ECL-785-350, Process Instruments, Inc., Salt Lake City, Utah), a beam-steered fiber-optic probe (Visionex, Atlanta, Georgia), an imaging spectrograph (Holospec f/1.8i-NIR, Kaiser Optical Systems, Ann Arbor, Michigan), and a back-illuminated, deep-depletion, thermoelectrically cooled CCD camera (Pixis 256BR, Princeton Instruments, Princeton, New Jersey), all controlled with a laptop computer. Details of the system have been reported previously.45 The fiber-optic probe delivered 80 mW of incident light onto the tissue at an integration time of 2–3 s, with all room lights and the computer monitor turned off. The system provided a spectral resolution of eight wavenumbers (cm−1). Spectral calibration of the system was performed each day using a neon-argon lamp and naphthalene and acetaminophen standards to correct for day to day variations. A National Institute of Standards and Technology (NIST)-calibrated tungsten lamp was also used to account for the wavelength-dependent response of the system. The spectra were processed for fluorescence subtraction and noise smoothing using the modified polynomial fit and Savitzy–Golay methods, described previously.45 Following data processing, each spectrum was normalized to its mean spectral intensity across all Raman bands to account for intensity variability. 2.4.Data AnalysisAs previously reported, menopausal status and history of cervical disease affects Raman spectra.23 For this reason, only premenopausal patients with no history of cervical disease were used in this analysis. A composite spectrum averaging Raman measurements from each patient was used for analysis because it would contain the effects of any significant patient variations. Discrimination was performed with SMLR, a Bayesian machine-learning framework that computes the posterior probability of a spectrum belonging to each tissue class based on a labeled training set.24, 46 For this analysis, whichever class had the higher probability of membership was the one to which the spectrum was classified. Because only one composite spectrum per patient was used, SMLR was run with leave-one-patient-out cross-validation. A range of input parameters to SMLR have been tested previously, and these tests revealed that the combination of parameters that provide the most accurate classification, while also maximizing sparsity, was using a Laplacian prior, direct kernel, λ value of 0.01, with no additional bias term. 3.ResultsThe epidemiologic makeup (race/ethnicity groups, BMI category, obstetric history, and socioeconomic status) of the entire cohort of 75 patients recruited to this study is shown in Table 2. In the analyses that follow, only Raman spectra from premenopausal women with no history or current presence of cervical disease were used. Because of lower recruitment numbers, patients of Arabic descent or underweight BMI were excluded. Some spectra could not be classified into appropriate categories, such as those from women with spontaneous abortions and from women whose health insurance was only acquired recently. Those spectra were also excluded. Table 2Patient categories. Total in all categories is 75.
3.1.Race and EthnicityRaman spectra (n = 193) were acquired from the cervix of patients from 3 different racial and ethnic groups (white n = 21, black n = 23, Hispanic n = 18, total = 62, excluded = 13). There are many similarities across these spectra throughout the wavenumber range [Fig. 1a]. Figure 1b shows difference spectra of Raman measurements from white and black patients and white and Hispanic patients. A few of the small differences between the spectra are shown as the box plots in Figs. 1c, 1d, 1e, including the peaks that have been assigned in previous studies as lipid and DNA of ∼1303 cm−1, the phenylalanine and DNA region around 1510–1520 cm−1 and the shoulders of the 1656 cm−1 amide I peak.47, 48, 49 Changes in the shoulders of the amide I peak are usually due to changes in the secondary structures of amide I, such as the β pleated sheet proteins.49 These peaks that seemed to qualitatively have the most difference in the averaged composite spectra have large areas of overlap. Box plots were used to visualize the data because they provide more detailed information compared to bar graphs. These figures have been explained in detail previously.50 Generally, the box represents the 25th and 75th percentiles of the data as the bottom and top of the box. The centerline is the median, the error bars represent one standard deviation from the mean, and any outliers are represented by a plus sign. Fig. 1(a) Normalized average Raman spectra of white, black, and Hispanic patients. Highlighted regions are displayed in (c–e). (b) Difference spectra between measurements from white and black patients and white and Hispanic patients. (c–e) Box plots of specific peaks of Raman spectra from normal cervix of patients who described themselves as white, black, or Hispanic. Potential peak assignments: (c) Lipid and DNA, (d) phenylalanine and DNA, (e) Amide I shoulder. The box contains data between the 25th and 75th percentile, with the centerline representing the median. The error bars are ±1 S.D. about the mean. Outliers are represented by +.  3.2.Body Mass IndexRaman measurements (n = 187) from three different BMI categories (normal n = 19, overweight n = 21, obese n = 23, total = 63, excluded = 12) were acquired and averaged. The spectra among these three categories appear similar in most areas, but a few significant differences occur in the peaks at 1010, 1656, and 1750 cm−1 [Fig. 2a]. Difference spectra have been plotted in Fig. 2b, showing differences between patients of normal BMI and overweight BMI, as well as normal and obese. To visualize important areas of the spectra, box plots for these peaks, which have been assigned by other researchers as phenylalanine, lipid, and C = C bonds, respectively, are shown in Figs. 2c, 2d, 2e.49, 51, 52 Fig. 2(a) Normalized average Raman spectra from normal, overweight and obese patients. Highlighted regions are displayed in (c–e). (b) Difference spectra between measurements from normal and overweight patients and normal and obese patients. (c–e) Box plots showing regions of difference between patients with normal and overweight + obese BMI levels. Potential peak assignments: (c) phenylalanine, (d) lipid, (e) C = C bond. The box contains data between the 25th and 75th percentile, with the centerline representing the median. The error bars are ±1 S.D. about the mean. Outliers are represented by +.  3.3.ParityRaman measurements (n = 117) were obtained from two groups of patients, nulliparous (n = 23) and parous (n = 24, total = 47, excluded = 28). Compared to previous spectra, there are slight variations throughout the entire range [Fig. 3a]. A subtraction spectrum showing the differences between measurements from women who have and have not been pregnant is shown in Fig. 3b. More significant differences are seen in the region of 1050–1130 cm−1, which have been attributed to C–C and C–O stretches, as well as varying concentrations of collagen, elastin, lipid, and proline.49, 53, 54 Box plot peaks corresponding to some of these differing regions are shown in Figs. 3c, 3d, 3e. Fig. 3(a) Normalized average Raman spectra from patients with zero pregnancies and one or more pregnancy. Highlighted regions are displayed in (c–e). (b) Difference spectra between measurements from patients with and without previous pregnancy. (c–e) Box plots showing regions of difference between patients with and without previous pregnancy. Potential peak assignments: (c) collagen/elastin, (d) Amide III, (e) C–O stretch. The box contains data between the 25th and 75th percentile, with the centerline representing the median. The error bars are ±1 S.D. about the mean. Outliers are represented by +.  3.4.Socioeconomic StatusFor this study, patients’ health insurance status was used as an indicator of socioeconomic status. Raman spectra (n = 123) were obtained from the cervix of patients with or without private health insurance with 26 patients in each category [excluded = 23; Fig. 4a]. Included in the group of patients without health insurance were women who qualified for the Tennessee Breast and Cervical Cancer Screening program. These patients have health care for mammograms, Pap smears, etc., but the program does not provide comprehensive health-care coverage. The spectra from the two groups mostly overlap, with only a few areas of small differences between patients with and without health insurance. This outcome is shown in Fig. 4b. Figures 4c, 4d, 4e contain box plots for the peaks at 1095, 1265, and 1656 cm−1, which correspond to [TeX:] ${\rm PO}_2^{ - 1} $ , protein content, and the shoulder of the amide I band.49, 54, 55, 56 Fig. 4(a) Normalized average Raman spectra from patients with and without health insurance. Highlighted regions are shown in (c–e). (b) Difference spectra between measurements from patients with and without health insurance. (c–e) Box plots showing regions of difference between patients with and without health insurance. Potential peak assignments: (c) [TeX:] ${\rm PO}_2^{ - 1} $ , (d) protein content, (e) Amide I shoulder. The box contains data between the 25th and 75th percentile, with the centerline representing the median. The error bars are ±1 S.D. about the mean. Outliers are represented by +. 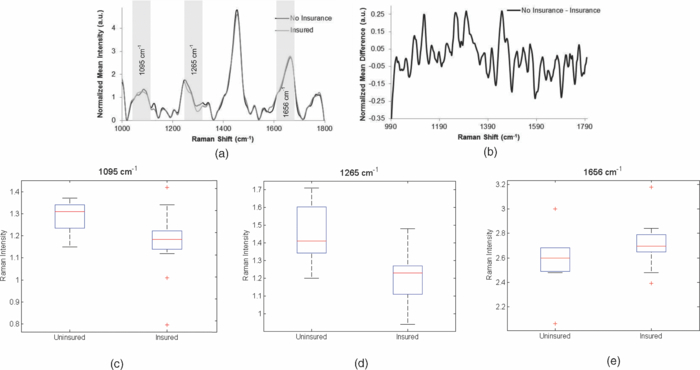 3.5.Statistical AnalysesAlthough box plots have been used to highlight various regions of the spectrum, the entire normalized spectrum from 990 to 1800 cm−1 for each patient within each category was used for this analysis. The first step of this analysis was to classify the spectra according to the previous categories (i.e., white, black, and Hispanic, etc.) to determine if significant differences exist in the Raman spectra acquired from these specific groups of patients. Various iterations of analyses were used to decide how the spectra should be classified, which was determined by finding the greatest classification accuracy of these iterations. For example, for the BMI category, SMLR was first performed to classify the spectra as normal, overweight, or obese. However, a higher classification accuracy rate was found when SMLR was performed with only two categories: normal versus a combined category of spectra from overweight and obese patients. Table 3 shows the maximum classification accuracy obtained within each patient variability category. The category of race/ethnicity classified with a maximum rate of 58%, BMI with a maximum rate of 78% when spectra were classified as normal or a combined category of overweight or obese, parity with a rate of 75%, and socioeconomic status with a rate of 61%. Table 3Results from statistical analyses of patient variables.
4.DiscussionPrevious studies using Raman spectroscopy to detect cervical dysplasia have shown limited success.1, 15, 16 We have previously demonstrated that some of these limitations can be overcome by accounting for both normal patient variability, such as hormonal differences and the history or presence of disease.1, 23, 24 In this paper, we evaluate whether Raman spectra acquired from normal tissue can be separated based on other patient variables, including race/ethnicity, BMI, obstetric history, and socioeconomic status. The spectra used in the analyses presented here were acquired from patients with no history of disease and whose current Pap smear result was within normal limits. When a pathologist examined these cytology specimens, few variations were observed and the clinical diagnosis of each patient was normal. If there are no significant differences due to common patient variations, such as ethnicity, height, and weight, then we expect spectra acquired from the cervix of patients with a normal pathology to also appear similar and have few variations. Furthermore, if these variables have no impact on the spectra, then statistical classification should produce results with accuracy rates of ∼50%, similar to a coin toss. Previous studies have suggested the patient variables analyzed in this paper may be correlated with higher incidences of cervical dysplasia.32, 35 Although we do not expect a significant impact from these normal physiological and social variables on the biochemical makeup of the cervix or the acquired Raman spectra, investigating the influence of these variables is an important first step in validating the application of Raman spectroscopy on a diverse patient population. The results from this study show that some of these variables produce significant changes to Raman spectra that are separable using statistical classification methods. The two patient variables that resulted in the most separable spectra were BMI and parity, with classification rates of 78 and 75%, respectively. These results suggest that BMI and parity cause significant changes in the cervix and therefore affect any spectra acquired from the cervix. As discussed previously, higher BMI is associated with increased areas of inflammation and higher blood serum hormonal levels.22, 24, 37 Although there are cycling levels of hormones that affect the elasticity and softness of the cervix, varying baseline levels of steroid hormones due to BMI differences may change the cervix as well. Similarly, it is reasonable to believe that parity would influence normal Raman spectra. The cervix is known to change dramatically during pregnancy and labor.57 These changes appear to be long term and affect tissue biochemistry significantly enough to be recognizable with Raman spectroscopy. Furthermore, accuracy rates may increase by defining narrower classification groups. Figure 3c shows a box plot of the peak at 1070 cm−1, correlating to collagen and elastin content. Although there is little variance in patients who have not been pregnant, there is a significant amount of variance in the spectra from those who have. This variance may be correlated with number of pregnancies and type of delivery (vaginal or caesarean), both of which may change the concentration and organization of collagen.58 In the future, comparing groups of patients to different delivery types and number of pregnancies may increase accuracy rates. Classification by socioeconomic status and race/ethnicity resulted in accuracy rates of 61 and 58%, respectively, suggesting that these variables have a smaller impact on the Raman spectra. Although there are small differences in the Raman spectra that lead to a classification rate of >50%, socioeconomic status and race/ethnicity are less significant compared to BMI and parity. One possible explanation for the 61% classification accuracy with socioeconomic status may be an increased prevalence of undiagnosed medical problems due to the lack of medical insurance reducing access to comprehensive health care. These results also suggest that the different incidence rates of cervical dysplasia among racial and ethnic groups are not due to fundamental differences in the biochemical makeup of the cervix. Even though there is no physiological evidence that race or ethnicity change the biochemical makeup of the cervix, it was important to investigate these variables to ensure that Raman spectroscopy can be applied to detect cervical dysplasia in diverse populations. The low rate of classifying data by race or ethnicity alone suggests that these variations do not significantly affect the cervix or the classification of Raman spectra. This outcome is significant because it indicates Raman spectroscopy may be applied in clinical settings on any patient population. The success of the analyses performed in this study depends on the reliability of the data used to categorize the spectra. For example, the patient reported her own race or ethnicity, but the categories were limited to “white,” “black,” and “Hispanic,” and she may fit into more than one or none of these. BMI is a controversial measure of body fat that may be inaccurate because it does not reflect changes due to age, race, gender, etc.59 To classify spectra based on parity, higher rates may be achieved by further categorizing previously pregnant patients by number of pregnancies and number and type of delivery (vaginal or cesarean). In this study, some spectra (n = 11) were acquired during a patient's postpartum exam, typically 6–10 weeks after delivery. Obtaining data at this point may not only affect spectra acquired from the cervix, but also a patient's BMI. Future studies on patient variability should exclude data from such patients. Finally, whether or not a patient has health-care coverage may not be an accurate measure of socioeconomic status or other cultural practices, such as dietary and social habits that are associated with different economic levels. To truly investigate the influence of specific variables, surveys of the patients may be more beneficial. Studies from our lab and others have looked at the effect of hormonal variations,28 age,26 acetic acid,24 creams and lotions,27 history or presence of disease,24, 25 smoking, BMI, obstetric history, insurance status, and race/ethnicity on Raman spectra obtained from nonmalignant areas of the cervix and other tissues. The results from previous work have shown that, prior to classification, stratifying spectra based on hormonal changes and history or presence of disease reduces intraclass variability among both normal and diseased spectra.1, 24 Unsupervised classification algorithms were then more likely to account for the variance due to differences from disease instead of the variance due hormonal status or disease history, resulting in improved performance. However, close examination of these results revealed that a significant amount of intraclass variance among the normal spectra remained,1, 23, 24 which motivated investigating additional factors that could be used to account for the variance among normal spectra and improve classification of disease. Therefore, the purpose of this paper is to perform the critical intermediate step of identifying the most separable sources of intraclass variation among normal spectra. Our results indicate that of the variables investigated, normal spectra are best separated as a function of BMI and parity, which are both easily obtainable from the patient. On the basis of previous experience with hormonal status and disease history, it is possible that stratification of the spectra by BMI and parity may also improve the accuracy of disease diagnosis using Raman spectroscopy. Because an effect of race/ethnicity or socioeconomic status on classification was not identified, there appears to be no benefit to accounting for those variables prior to classification. Consideration of other variables beyond those discussed here may be important and can be determined based on organ sites. However, the cost to benefit ratio of incorporating additional physiological patient variables prior to spectral classification must be considered before further analysis is performed. Current research is underway in our lab to understand the significance of BMI, parity, race/ethnicity, and socioeconomic status on disease classification and to quantify the relative variance these factors impart on normal spectra compared to diseased spectra. Although it may be possible that BMI and parity do not affect disease spectra as has been demonstrated with normal spectra, they are still important factors to be aware of prior to classification of cervical dysplasia. The goal of using Raman spectroscopy for precancer detection is to provide an automated, real-time method of accurately detecting malignant cells in any patient population, regardless of race, ethnicity, BMI, parity, or socioeconomic status. Previous work using Raman spectroscopy for in vivo screening and diagnosis of cervical dysplasia has shown promising results, with sensitivities and specificities of >90%; however, this work was done in a fairly homogenous patient population. In this study, we investigated the spectral variations in a more diverse patient group and found more distinct differences due to BMI and obstetric history compared to race/ethnicity and socioeconomic status. We believe these results suggest that classification algorithms for the detection of cervical dysplasia with Raman spectroscopy should be developed to incorporate BMI and obstetric history, but it does not appear necessary to control for race, ethnicity, or a patient's socioeconomic status. These results also suggest that normal sources of physiological variability, such as hormone levels, BMI, etc., may affect the inherent baseline Raman spectra acquired from other organ systems as well. For example, skin pigment and dryness may be important variables to account for when using Raman spectroscopy for diagnosing melanoma. Age and gender may be significant factors that impact the biochemical makeup of the GI tract. Parity and hormonal fluctuations may affect the classification accuracy of Raman spectra acquired from the ovary. By examining the effect of such normal physiological variables on spectra, the sensitivity of Raman spectroscopy will be revealed, as will its effectiveness for detecting and diagnosing disease. AcknowledgmentsThe authors acknowledge the financial support of the National Institute of Health Grant No. R01-CA-095405 and a predoctoral fellowship (Grant No. T32-HL7751-15) for E.V. Special thanks go to the nurses and staff at Meharry Medical College for their help, and to Chetan Patil and Amy Rudin for proofreading this paper. ReferencesE. M. Kanter,
E. Vargis,
S. Majumder,
M. D. Keller,
E. Woeste,
G. G. Rao, and
A. Mahadevan-Jansen,
“Application of Raman spectroscopy for cervical dysplasia diagnosis,”
J. Biophoton., 2 81
–90
(2009). https://doi.org/10.1002/jbio.200910001 Google Scholar
P. Crow,
A. Molckovsky,
N. Stone,
J. Uff,
B. Wilson, and
L. M. WongKeeSong,
“Assessment of fiberoptic near-infrared raman spectroscopy for diagnosis of bladder and prostate cancer,”
Urology, 65 1126
–1130
(2005). https://doi.org/10.1016/j.urology.2004.12.058 Google Scholar
M. C. Grimbergen,
C. F. van Swol,
R. J. van Moorselaar,
J. Uff,
A. Mahadevan-Jansen, and
N. Stone,
“Raman spectroscopy of bladder tissue in the presence of 5-aminolevulinic acid,”
J. Photochem. Photobiol. B, 95 170
–176
(2009). https://doi.org/10.1016/j.jphotobiol.2009.03.002 Google Scholar
C. Krafft,
A. A. Ramoji,
C. Bielecki,
N. Vogler,
T. Meyer,
D. Akimov,
P. Rosch,
M. Schmitt,
B. Dietzek,
I. Petersen,
A. Stallmach, and
J. Popp,
“A comparative Raman and CARS imaging study of colon tissue,”
J. Biophoton., 2 303
–312
(2009). https://doi.org/10.1002/jbio.200810063 Google Scholar
M. V. Chowdary,
K. K. Kumar,
K. Thakur,
A. Anand,
J. Kurien,
C. M. Krishna, and
S. Mathew,
“Discrimination of normal and malignant mucosal tissues of the colon by Raman spectroscopy,”
Photomed. Laser Surg., 25 269
–274
(2007). https://doi.org/10.1089/pho.2006.2066 Google Scholar
M. V. Chowdary,
K. Kalyan Kumar,
S. Mathew,
L. Rao,
C. M. Krishna, and
J. Kurien,
“Biochemical correlation of Raman spectra of normal, benign and malignant breast tissues: a spectral deconvolution study,”
Biopolymers, 91 539
–546
(2009). https://doi.org/10.1002/bip.21171 Google Scholar
S. K. Majumder,
M. D. Keller,
F. I. Boulos,
M. C. Kelley, and
A. Mahadevan-Jansen,
“Comparison of autofluorescence, diffuse reflectance, and Raman spectroscopy for breast tissue discrimination,”
J. Biomed. Opt., 13 054009
(2008). https://doi.org/10.1117/1.2975962 Google Scholar
H. Barr,
C. Kendall,
F. Bazant-Hegemark,
P. Moayyedi,
G. Shetty, and
N. Stone,
“Endoscopic screening and surveillance for Barrett's esophagus—clinical implications,”
MedGenMed, 8
(2), 88
(2006). Google Scholar
G. Shetty,
C. Kendall,
N. Shepherd,
N. Stone, and
H. Barr,
“Raman spectroscopy: elucidation of biochemical changes in carcinogenesis of oesophagus,”
Br. J. Cancer, 94 1460
–1464
(2006). https://doi.org/10.1038/sj.bjc.6603102 Google Scholar
C. Eliasson,
N. A. Macleod, and
P. Matousek,
“Non-invasive detection of cocaine dissolved in beverages using displaced Raman spectroscopy,”
Anal. Chim. Acta, 607 50
–53
(2008). https://doi.org/10.1016/j.aca.2007.11.023 Google Scholar
M. Leona,
P. Decuzzi,
T. A. Kubic,
G. Gates, and
J. R. Lombardi,
“Nondestructive identification of natural and synthetic organic colorants in works of art by surface enhanced Raman scattering,”
Anal. Chem.,
(2011). https://doi.org/10.1021/ac2007015 Google Scholar
V. Kumar and
S. L. Robbins, Robbins Basic Pathology, Saunders/Elsevier, Philadelphia
(2007). Google Scholar
A. P. Gamot,
G. Vergoten, and
G. Fleury,
“Etude par spectroscopie raman du chlorhydrate de cocaine,”
Talanta, 32 363
–372
(1985). https://doi.org/10.1016/0039-9140(85)80100-4 Google Scholar
R. L. Feller,
A. Roy,
E. W. FitzHugh, and
B. H. Berrie, Artists’ Pigments: A Handbook of Their History and Characteristics, National Gallery of Art, Washington
(1986). Google Scholar
P. R. T. Jess,
D. D. W. Smith,
M. Mazilu,
K. Dholakia,
A. Riches, and
C. S. Herrington,
“Early detection of cervical neoplasia by Raman spectroscopy,”
Int. J. Cancer, 121 2723
–2728
(2007). https://doi.org/10.1002/ijc.23046 Google Scholar
A. Mahadevan-Jansen,
M. F. Mitchell,
N. Ramanujam,
A. Malpica,
S. Thomsen,
U. Utzinger, and
R. Richards-Kortum,
“Near-infrared Raman spectroscopy for in vitro detection of cervical precancers,”
Photochem. Photobiol., 68 123
–132
(1998). https://doi.org/10.1111/j.1751-1097.1998.tb03262.x Google Scholar
A. Robichaux-Viehoever,
E. Kanter,
H. Shappell,
D. Billheimer,
H. Jones III, and
A. Mahadevan-Jansen,
“Characterization of Raman spectra measured in vivo for the detection of cervical dysplasia,”
Appl. Spectrosc., 61 986
–993
(2007). https://doi.org/10.1366/000370207781746053 Google Scholar
Y. Yazdi,
N. Ramanujam,
R. Lotan,
M. F. Mitchell,
W. Hittelman, and
R. Richards-Kortum,
“Resonance Raman spectroscopy at 257 nm excitation of normal and malignant cultured breast and cervical cells,”
Appl. Spectrosc., 53 82
–85
(1999). https://doi.org/10.1366/0003702991945254 Google Scholar
C. M. Krishna,
N. B. Prathima,
R. Malini,
B. M. Vadhiraja,
R. A. Bhatt,
D. J. Fernandes,
P. Kushtagi,
M. S. Vidyasagar, and
V. B. Kartha,
“Raman spectroscopy studies for diagnosis of cancers in human uterine cervix,”
Vib. Spectrosc., 41 136
–141
(2006). https://doi.org/10.1016/j.vibspec.2006.01.011 Google Scholar
J. M. M. Walboomers,
M. V. Jacobs,
M. M. Manos,
F. X. Bosch,
J. A. Kummer,
K. V. Shah,
P. J. F. Snijders,
J. Peto,
C. J. L. M. Meijer, and
N. Muñoz,
“Human papillomavirus is a necessary cause of invasive cervical cancer worldwide,”
J. Pathol., 189 12
–19
(1999). https://doi.org/10.1002/(SICI)1096-9896(199909)189:1%3c12::AID-PATH431%3e3.0.CO;2-F Google Scholar
E. F. Dunne,
E. R. Unger,
M. Sternberg,
G. McQuillan,
D. C. Swan,
S. S. Patel, and
L. E. Markowitz,
“Prevalence of HPV infection among females in the United States,”
J. Am. Med. Assoc., 297 813
–819
(2007). https://doi.org/10.1001/jama.297.8.813 Google Scholar
J. V. Lacey Jr.,
C. A. Swanson,
L. A. Brinton,
S. F. Altekruse,
W. A. Barnes,
P. E. Gravitt,
M. D. Greenberg,
O. C. Hadjimichael,
L. McGowan, and
R. Mortel,
“Obesity as a potential risk factor for adenocarcinomas and squamous cell carcinomas of the uterine cervix,”
Cancer, 98 814
–821
(2003). https://doi.org/10.1002/cncr.11567 Google Scholar
E. M. Kanter,
S. Majumder,
G. J. Kanter,
E. M. Woeste, and
A. Mahadevan-Jansen,
“Effect of hormonal variation on Raman spectra for cervical disease detection,”
Am. J. Obstet. Gynecol., 200 512
(2009). https://doi.org/10.1016/j.ajog.2008.11.024 Google Scholar
E. Vargis,
E. M. Kanter,
S. K. Majumder,
M. D. Keller,
R. B. Beaven,
G. Rao, and
A. Mahadevan-Jansen,
“Effect of normal variations on disease classification of Raman spectra from cervical tissue,”
Analyst, 139 2981
–2987
(2011). https://doi.org/10.1039/c0an01020k Google Scholar
M. S. Bergholt,
W. Zheng,
K. Lin,
K. Y. Ho,
M. Teh,
K. G. Yeoh,
J. B. So, and
Z. Huang,
“Characterizing variability in in vivo Raman spectra of different anatomical locations in the upper gastrointestinal tract toward cancer detection,”
J. Biomed. Opt., 16 037003
(2011). https://doi.org/10.1117/1.3556723 Google Scholar
A. S. Haka,
K. E. Shafer-Peltier,
M. Fitzmaurice,
J. Crowe,
R. R. Dasari, and
M. S. Feld,
“Diagnosing breast cancer by using Raman spectroscopy,”
Proc. Nat. Acad. Sci. U. S. A., 102 12371
–12376
(2005). https://doi.org/10.1073/pnas.0501390102 Google Scholar
L. Chrit,
P. Bastien,
G. D. Sockalingum,
D. Batisse,
F. Leroy,
M. Manfait, and
C. Hadjur,
“An in vivo randomized study of human skin moisturization by a new confocal Raman fiber-optic microprobe: assessment of a glycerol-based hydration cream,”
Skin Pharmacol. Physiol., 19 207
–215
(2006). https://doi.org/10.1159/000093116 Google Scholar
A. Cano,
V. Serra,
J. Rivera,
R. Monmeneu, and
C. Marzo,
“Expression of estrogen receptors, progesterone receptors, and an estrogen receptor-associated protein in the human cervix during the menstrual cycle and menopause,”
Fertil. Steril., 54 1058
–1064
(1990). Google Scholar
S. F. Gould,
J. M. Shannon, and
G. R. Cunha,
“The autoradiographic demonstration of estrogen binding in normal human cervix and vagina during the menstrual cycle, pregnacy, and the menopause,”
Am. J. Anat., 168 229
–238
(1983). https://doi.org/10.1002/aja.1001680209 Google Scholar
S. Thomsen and
D. Tatman,
“Physiological and pathological factors of human breast disease that can influence optical diagnosis,”
Ann. N.Y. Acad. Sci., 838 171
–193
(1998). https://doi.org/10.1111/j.1749-6632.1998.tb08197.x Google Scholar
H. E. Nieburgs,
“Recent progress in the interpretation of malignancy associated changes (MAC),”
Acta Cytol., 12
(6), 445
–453
(1968). Google Scholar
J. B. Mitchell and
L. A. McCormack,
“Time trends in late-stage diagnosis of cervical cancer: differences by race/ethnicity and income,”
Med. Care, 35 1220
–1224
(1997). https://doi.org/10.1097/00005650-199712000-00006 Google Scholar
A. Jemal,
R. Siegel,
J. Xu, and
E. Ward,
“Cancer statistics, 2010,”
CA: Cancer J. Clinicians, 60
(5), 277
–300
(2010). https://doi.org/10.3322/caac.20073 Google Scholar
E. Ward,
A. Jemal,
V. Cokkinides,
G. K. Singh,
C. Cardinez,
A. Ghafoor, and
M. Thun,
“Cancer disparities by race/ethnicity and socioeconomic status,”
CA: Cancer J. Clinicians, 54 78
–93
(2004). https://doi.org/10.3322/canjclin.54.2.78 Google Scholar
J. Ferlay,
H. R. Shin,
F. Bray,
D. Forman,
C. Mathers, and
D. M. Parkin,
“Estimates of worldwide burden of cancer in 2008: GLOBOCAN 2008,”
Int. J. Cancer, 127 2893
–2917
(2010). https://doi.org/10.1002/ijc.25516 Google Scholar
E. E. Calle and
R. Kaaks,
“Overweight, obesity and cancer: epidemiological evidence and proposed mechanisms,”
Nat. Rev. Cancer, 4 579
–591
(2004). https://doi.org/10.1038/nrc1408 Google Scholar
T. J. Key,
N. E. Allen,
P. K. Verkasalo, and
E. Banks,
“Energy balance and cancer: the role of sex hormones,”
Proc. Nutr. Soc., 60 81
–89
(2001). https://doi.org/10.1079/PNS200068 Google Scholar
C. Macaulay,
R. Richards-Kortum,
U. Utzinger,
A. Fedyk,
E. Atkinson,
D. Cox, and
M. Follen,
“Variation of fluorescence spectroscopy during the menstrual cycle,”
Opt. Express, 10
(12), 493
–504
(2002). Google Scholar
K. C. Sung,
M. Y. Dawood,
S. Gregg,
U. Urs,
E. N. Atkinson,
R. R-K. Rebecca, and
F. Michele,
“Fluorescence spectroscopy for cervical precancer detection: Is there variance across the menstrual cycle?,”
J. Biomed. Opt., 7 595
–602
(2002). https://doi.org/10.1117/1.1509753 Google Scholar
R. Cubeddu,
C. D’Andrea,
A. Pifferi,
P. Taroni,
A. Torricelli, and
G. Valentini,
“Effects of the menstrual cycle on the red and near-infrared optical properties of the human breast,”
Photochem. Photobiol., 72 383
–391
(2000). https://doi.org/10.1562/0031-8655(2000)072>0383:EOTMCO<2.0.CO;2 Google Scholar
J. A. Knight,
K. M. Blackmore,
J. Wong,
S. Tharmalingam, and
L. Lilge,
“Optical spectroscopy of the breast in premenopausal women reveals tissue variation with changes in age and parity,”
Med. Phys., 37 419
–426
(2010). https://doi.org/10.1118/1.3276737 Google Scholar
V. T. Chang,
P. S. Cartwright,
S. M. Bean,
G. M. Palmer,
R. C. Bentley, and
N. Ramanujam,
“Quantitative physiology of the precancerous cervix in vivo through optical spectroscopy,”
Neoplasia, 11
(4), 325
–332
(2009). Google Scholar
J. G. Kelly,
K. T. Cheung,
C. Martin,
J. J. O’Leary,
W. Prendiville,
P. L. Martin-Hirsch, and
F. L. Martin,
“A spectral phenotype of oncogenic human papillomavirus-infected exfoliative cervical cytology distinguishes women based on age,”
Clin. Chim. Acta, 411 1027
–1033
(2010). https://doi.org/10.1016/j.cca.2010.03.029 Google Scholar
“Physical status: the use and interpretation of anthropometry,”
World Health Organ Tech. Rep. Ser. 854, Benteli, Swizterland
(1995). Google Scholar
C. A. Lieber and
A. Mahadevan-Jansen,
“Automated method for subtraction of fluorescence from biological Raman spectra,”
Appl. Spectrosc., 57 1363
–1367
(2003). https://doi.org/10.1366/000370203322554518 Google Scholar
B. Krishnapuram,
L. Carin,
M. A. Figueiredo, and
A. J. Hartemink,
“Sparse multinomial logistic regression: fast algorithms and generalization bounds,”
IEEE Trans. Pattern Anal. Mach. Intell., 27 957
–968
(2005). https://doi.org/10.1109/TPAMI.2005.127 Google Scholar
G. J. Puppels,
J. H. Olminkhof,
G. M. Segers-Nolten,
C. Otto,
F. F. de Mul, and
J. Greve,
“Laser irradiation and Raman spectroscopy of single living cells and chromosomes: sample degradation occurs with 514.5 nm but not with 660 nm laser light,”
Exp. Cell Res., 195 361
–367
(1991). https://doi.org/10.1016/0014-4827(91)90385-8 Google Scholar
C. A. Lieber,
K. Molpus,
K. Brader, and
A. Mahadevan-Jansen,
“Diagnostic tool for early detection of ovarian cancers using Raman spectroscopy,”
Proc. SPIE, 3918 129
–130
(2000). https://doi.org/10.1117/12.384934 Google Scholar
A. Mahadevan-Jansen and
R. R. Richards-Kortum,
“Raman spectroscopy for the detection of cancers and precancers,”
J. Biomed. Opt., 1 31
–70
(1996). https://doi.org/10.1117/12.227815 Google Scholar
J. W. Tukey, Exploratory data analysis, Addison-Wesley, Reading, MA
(1977). Google Scholar
R. J. Erckens,
M. Motamedi,
W. F. March, and
J. P. Wicksted,
“Raman spectroscopy for non invasive characterization of ocular tissue: potential for detection of biological molecules,”
J. Raman Spectrosc., 28 293
–299
(1997). https://doi.org/10.1002/(SICI)1097-4555(199705)28:5<293::AID-JRS47>3.0.CO;2-0 Google Scholar
S. Fendel and
B. Schrader,
“Investigation of skin and skin lesions by NIR-FT-Raman spectroscopy,”
Fresenius’ J. Anal. Chem., 360 609
–613
(1998). https://doi.org/10.1007/s002160050767 Google Scholar
U. Utzinger,
D. L. Heintzelman,
A. Mahadevan-Jansen,
A. Malpica,
M. Follen, and
R. Richards-Kortum,
“Near-infrared Raman spectroscopy for in vivo detection of cervical precancers,”
Appl. Spectrosc., 55 955
–959
(2001). https://doi.org/10.1366/0003702011953018 Google Scholar
C. J. Frank,
D. C. Redd,
T. S. Gansler, and
R. L. McCreery,
“Characterization of human breast biopsy specimens with near-IR Raman spectroscopy,”
Anal. Chem., 66 319
–326
(1994). https://doi.org/10.1021/ac00075a002 Google Scholar
T. Miura and
G. J. Thomas Jr.,
“Raman spectroscopy of proteins and their assemblies,”
Subcell Biochem., 24 55
–99
(1995). Google Scholar
C. H. Liu,
B. B. Das,
W. L. Sha Glassman,
G. C. Tang,
K. M. Yoo,
H. R. Zhu,
D. L. Akins,
S. S. Lubicz,
J. Cleary,
R. Prudente,
E. Celmer,
A. Caron, and
R. R. Alfano,
“Raman, fluorescence, and time-resolved light scattering as optical diagnostic techniques to separate diseased and normal biomedical media,”
J. Photochem. Photobiol. B, 16 187
–209
(1992). https://doi.org/10.1016/1011-1344(92)80008-J Google Scholar
D. N. Danforth,
A. Veis,
M. Breen,
H. G. Weinstein,
J. C. Buckingham, and
P. Manalo,
“The effect of pregnancy and labor on the human cervix: changes in collagen, glycoproteins, and glycosaminoglycans,”
Am. J. Obstet. Gynecol., 120 641
–651
(1974). Google Scholar
S. Y. Yu,
C. A. Tozzi,
J. Babiarz, and
P. C. Leppert,
“Collagen changes in rat cervix in pregnancy–polarized light microscopic and electron microscopic studies,”
Proc. Soc. Exp. Biol. Med., 209
(4), 360
–368
(1995). Google Scholar
K. J. Rothman,
“BMI-related errors in the measurement of obesity,”
Int. J. Obes., 32 S56
–S59
(2008). https://doi.org/10.1038/ijo.2008.87 Google Scholar
|


