
|
|
1.IntroductionAggregation is a characteristic behavior of red blood cells (RBC) which occurs under specific conditions such as the presence of large macromolecules and low shear forces.1, 2 RBC aggregation is a reversible process: an increase of shear forces, such as an increased flow rate in a cylindrical tube, results in disaggregation of aggregates into individual RBC, while aggregates are formed again at lower shear forces or at stasis. The extent (i.e., average number of RBC per aggregate) and the time course (i.e., rate of aggregate growth) of aggregation under defined conditions are determined by both suspending phase and cellular properties.3 The concentration of certain macromolecules in the suspending medium (e.g., plasma) is an important determinant of RBC aggregation, with fibrinogen being the most important pro-aggregant in plasma.4 An increased concentration of fibrinogen occurs in clinical states that cause acute phase reactions, resulting in enhanced RBC aggregation; RBC aggregation is thus a good indicator of acute phase reactions and has been successfully used to monitor the inflammatory response during a variety of disease processes.5, 6, 7, 8 RBC aggregation is a measurable property of blood and has been found to be significantly altered during disease processes.1 In addition to conventional clinical laboratory procedures such as the measurement of erythrocyte sedimentation rate, specially developed RBC aggregometers can be used to quantitate various aspects of the aggregation process.9 As reviewed elsewhere, most instruments built for this purpose monitor light transmittance (LT) or light reflectance (LR) during the course of aggregation. The LT or LR time courses during RBC aggregation are known as “syllectograms” (Ref. 10) and are widely used to derive aggregation parameters by mathematical analysis.1, 11 An important element of such instruments is the shearing apparatus used for complete disaggregation of RBC in suspension in order to provide a defined starting time point for monitoring light intensity; the geometry of the shearing apparatus and the aggregation chamber are important determinants of the calculated aggregation parameters.12, 13, 14, 15 Instruments using LT and LR monitoring have been compared in terms of calculated aggregation parameters and their power in detecting various experimental alterations of RBC aggregation, with different sensitivities reported for various types of instruments.16 It has been suggested that the properties of light projected onto RBC suspensions to monitor LT or LR should influence the results of the aggregation measurements.1 It is well known that hemoglobin, which is the main constituent of RBC cytoplasm, has a characteristic absorbance spectrum that depends on its oxygenation status.17 It can thus be predicted that measured aggregation parameters may also depend on the degree of hemoglobin oxygenation. In fact, it has been previously shown that the oxygenation level of a RBC suspension significantly affected measured aggregation parameters, including those sensitive to the extent of aggregation as well as its time course.18 However, this influence of oxygenation status was only observed if the parameters were measured using a specific instrument (i.e., LORCA, Mechatronics, The Netherlands) but not if another aggregometer (i.e., Myrenne Aggregometer, Myrenne, Roetgen, Germany) was used. These two instruments have technical differences: 1. in order to calculate aggregation parameters, the LORCA monitors backscattered light intensity while the Myrenne aggregometer uses LT data and 2. the LORCA uses a laser beam of 670 nm wavelength while the Myrenne employs an infrared light-emitting diode. Therefore, the different effects of oxygenation level on the sensitivity of parameters provided by these instruments may be due to both measuring method and wavelength. Although methods based on the analysis of LR and LT data recorded during RBC aggregation have been previously compared and discussed in detail,13, 14, 16 very little information is available on the effects of light wavelength. This study was thus designed to investigate the influence of wavelength (500 to 900 nm) by monitoring LT during RBC aggregation in a rectangular flow chamber for both normal human blood and RBC suspensions with different levels of aggregation tendency. Of particular interest were possible effects of wavelength on static and dynamic aggregation parameters derived from LT-time data and on the effects of hemoglobin oxygen saturation. 2.Materials and Methods2.1.Blood Sampling and Preparation of Test SamplesThirty ml of venous blood samples were obtained from 10 healthy, human male volunteers, aged between 25 to 52 years, following oral informed consent. A tourniquet was applied to locate the antecubital vein prior to venipuncture and kept in place during the blood sampling that was completed within 90 s after the application of the tourniquet.19 The samples were anticoagulated with ethylenediamine-tetraaceticacid (1.5 mg/ml). Blood samples were centrifuged at 1400 × g for 6 min, plasma was aspirated and saved, and the RBC pellet was washed twice with isotonic phosphate-buffered saline (PBS, pH = 7.4, 290 mOsm/kg). An aliquot of plasma was diluted with PBS at a 1/3 ratio so that it contained only 66% of plasma components compared to the original plasma. Washed RBC from each donor were resuspended in either their autologous plasma, in diluted plasma, or in 0.5% dextran 500 (500 kDa, D-5251, Sigma Chemical Company, St. Louis, Missouri) dissolved in PBS; the hematocrit of these suspensions was adjusted to 0.4 l/l by adding or removing suspending media and confirmed by the microhematocrit method. Note that compared to RBC in undiluted plasma, RBC in 1/3 diluted plasma have reduced aggregation while RBC in 0.5% dextran 500 are characterized by enhanced aggregation.9 RBC suspensions were either oxygenated or deoxygenated by equilibration with air or 100% nitrogen prior to being used by rolling 3 ml of suspension in a 15-ml polypropylene tube for 15 min at room temperature. Nitrogen was moisturized by bubbling through distilled water prior to being introduced into the tube containing the blood. The oxygen partial pressure of RBC suspensions was measured using a blood gas analyzer (Stat Profile Critical Care Xpress, Nova Biomedical, Waltham, MA, USA). 2.2.Measurement SystemLT through the RBC suspensions described above was measured in a plastic rectangular flow chamber (0.25 mm high × 4 mm wide × 40 mm long). The transparent flow chamber was positioned between two optical fiber probes, one attached to the light source and the other to a spectrometer. A syringe pump was used to maintain blood flow through the flow channel for 10 s at the start of each measurement procedure at a volumetric rate to generate a wall shear rate of ∼500 s−1. This high shear rate was sufficient for complete disaggregation in all blood samples, either in plasma or in the dextran solution. LT spectra were recorded over the wavelength range of 500 to 900 nm using a miniature spectrometer (HR4000CGV, Ocean Optics, Florida); data were obtained at 1 s intervals for 100 s following flow stoppage. Note that the maximum recording time of 100 s was selected based upon our previous work showing that aggregation is essentially complete within this time period and that sedimentation of RBC starts to affect measurements for times >100 s.20 A tungsten halogen lamp (HL-2000, Ocean Optics, Florida) was used as the light source and a 400-μm diameter optical fiber cable was used to deliver light to the flow chamber. A collimating lens (74-VIS collimating lens, Ocean Optics, Florida) was connected to the end of the fiber to focus the light on the flow chamber. Transmitted light through the flow chamber was focused by another collimating lens located at the opposite side of the chamber onto an optical fiber connected to the spectrometer. LT spectra during flow and aggregation were recorded for each RBC suspension (i.e., in native plasma, diluted plasma, or 0.5% dextran 500) prepared using blood from a given donor. Prior to using RBC suspensions, the chamber was filled with deionized water and the spectrum recorded in order to standardize the transmittance data; LT at each wavelength is expressed as a percentage of transmittance through water at the same wavelength. 2.3.Data AnalysisThe minimum LT level observed within seconds after the sudden stop of flow represented the start of the aggregation process. The following aggregation parameters were calculated using LT time courses during aggregation at 500-, 600-, 700-, and 800-nm wavelengths as described elsewhere:15, 16, 21, 22 1. amplitude (AMP), the total change in intensity of transmitted light during the 100 s period; 2. aggregation half time (T 1/2), the time required to reach an LT level corresponding to 50% of AMP; 3. surface area (SA), the area below the time course curve during the first 10 s; and 4. aggregation index (AI), the ratio of the area below the time course curve to the sum of the areas above and below the curve during the first 10 s. Additionally, time constants for the fast (T fast) and slow (T slow) components of RBC aggregation were calculated by fitting the 100 s LT versus time data to a double-exponential equation Eq. 1[TeX:] \documentclass[12pt]{minimal}\begin{document}\begin{equation} I_t = a + b \cdot e^{ - t/T_{fast} } + c \cdot e^{ - t/T_{slow} }, \end{equation}\end{document}2.4.Measurement of Red Blood Cell Aggregation in the SamplesAggregation parameters were measured in the three suspensions prepared from each blood sample using a photometric rheoscope with a Couette shearing apparatus (LORCA, Mechatronics, Hoorn, The Netherlands). The instrument reports aggregation parameters calculated in a manner similar to that previously described in Sec. 2.3. 2.5.Calculations and StatisticsThe results of the measurements in RBC suspensions with normal and modified aggregation are expressed as mean ± standard error (SE) with statistical comparisons done using one-way ANOVA followed by appropriate post-tests. Additionally, standardized differences from control values were calculated for the data obtained for suspensions with modified aggregation by dividing the mean difference between control and these suspensions by the pooled standard deviation (SDp) of the control plus modified data Eq. 2[TeX:] \documentclass[12pt]{minimal}\begin{document}\begin{equation} St.{\textit Diff.} = \frac{{(M_c - M_m)}}{{SD_p }}. \end{equation}\end{document}M c and M m are the means of the selected parameter for control and modified samples prepared using RBC from 10 donors. SDp was calculated as the square root of the average of the squared standard deviations (SDc and SDm) of the data from the control and modified samples being compared23 Eq. 3[TeX:] \documentclass[12pt]{minimal}\begin{document}\begin{equation} SD_p = \sqrt {\frac{{(SDc^2 + SDm^2)}}{2}}. \end{equation}\end{document}The standardized difference has been accepted as a measure of the power of each measurement condition to detect a difference between two groups.24 3.Results and Discussion3.1.Light Transmittance Spectrum of Oxygenated Blood during Flow and at StasisFigure 1 presents typical results of LT through an oxygenated blood sample during flow, 1 s after flow stoppage, and at 60 s after flow stoppage when RBC aggregates have developed; data were obtained at wavelengths between 500 to 900 nm. LT was highest at wavelengths close to the upper end of the spectrum (i.e., 900 nm), gradually decreased with decreasing wavelength, and exhibited a sharp decrease at wavelengths below 600 nm. LT spectra were characterized by a similar pattern during all phases of the measurement (i.e., during flow, 1 and 60 s after flow stoppage), although LT levels, especially in the range between 600 and 900 nm, were markedly different from each other. LT at all wavelengths in this range were highest during flow and lowest immediately after flow stoppage, then increased at 60 s and approached levels observed during flow. Fig. 1Light transmittance at wavelengths between 500 to 900 nm through a 250-μm thick oxygenated blood film during flow, 1 and 60 s after the flow stoppage (i.e., with RBC aggregates developed). Transmitted light intensity was normalized to that for deionized water in the same flow channel. 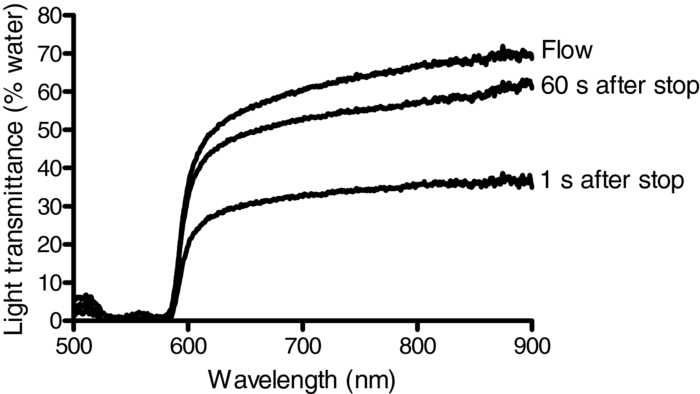 Time courses of LT (i.e., syllectograms) at four wavelengths (i.e., 500, 600, 700, and 800 nm) for the same experiment described for Fig. 1 are presented in Fig. 2. Stoppage of flow was followed by a sharp decrease in LT levels, which reached a minimum within seconds. This minimum was followed by increased LT with an initial rapid phase and a following slower phase. The time courses of transmittance at these four wavelengths all followed a similar pattern although the normalized transmitted light intensity depended on the wavelength: ∼50 to 60% for 700 and 800 nm, ∼30% for 600 nm, and ∼3% for 500 nm. Fig. 2A typical example of light transmittance time course through an oxygenated blood sample at selected wavelengths during the 100 s period starting immediately after stopping high shear flow (i.e., ∼500 s−1). The values are normalized to the transmittance of deionized water. 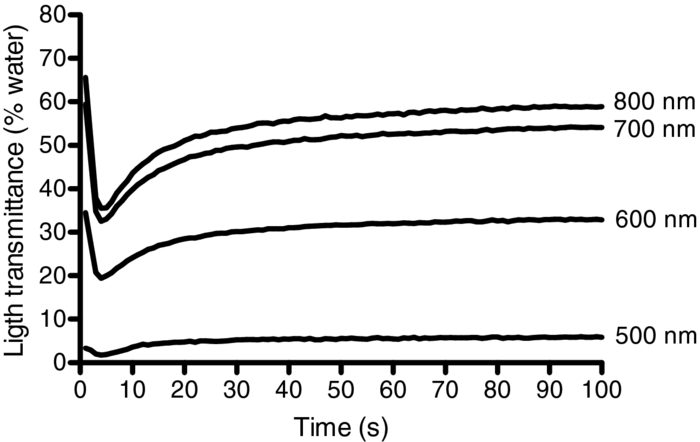 LT through suspensions is determined by the optical properties of the suspending phase, particle concentration, particle geometry, and the optical properties of particles.17, 25 This general case can be directly applied to RBC suspensions, with hematocrit (i.e., particle concentration) being an important determinant of LT.26 Light absorbance by RBC importantly contributes to the behavior of light passing through a suspension of these cells, with higher absorbance resulting in reduced LT;27 RBC hemoglobin content is also an important determinant of absorbance and, hence, the level of LT. The absorption spectrum of hemoglobin is clearly a critical factor determining LT through RBC suspensions. Hemoglobin is an effective light absorbant, especially at wavelengths below 600 nm.17, 27, 28 Thus, absorbance of hemoglobin has a well-known dependence on the wavelength of light and this dependency perfectly explains the relationship between the level of transmittance and wavelength observed in this study: about 10 times higher absorbance at wavelengths below 600 nm,27 which is consistent with the differences in the LT shown in Fig. 2. The time course of LT following the sudden stop of flow of RBC suspensions (i.e., during RBC aggregation) mainly reflects the change in the number of effective particles: aggregation of RBC results in larger particles and, thus, the number of scatters decrease as does the effective total optical path through the chamber, thus giving rise to increased LT during the course of aggregation.1 Additionally, LT might also be affected by other processes altering the particle concentration in the area under observation, such as sedimentation of RBC. However, the course of RBC sedimentation in suspensions used in this study is very slow than the course of the aggregation process, and starts to be effective after the first 100 s following an abrupt stoppage of flow in a similar flow system.20 Therefore the sedimentation effect has been accepted to not significantly interfere with the recorded LT in the current study. Obviously, the magnitude of changes in LT due to alterations of the number of effective particles is also strongly affected by the light absorbance of these particles. 3.2.Influence of Oxygenation Level on Light Transmittance PatternsAn important factor affecting the LT characteristics of RBC suspensions is the degree of hemoglobin oxygen saturation. Hemoglobin has isobestic points for oxygenated and deoxygenated forms (e.g., 582 and 808 nm), with the largest difference in light absorbance between these forms at about 650 nm.28, 29 LT spectra were recorded during flow, immediately after flow stoppage, and 60 s after flow stoppage using oxygenated and hypoxic aliquots of the blood samples (Fig. 3). Oxygen partial pressures were 110 ± 10 mmHg and 44 ± 4.5 mmHg for the oxygenated and hypoxic RBC suspensions, respectively. LT at all wavelengths over 500 nm was lower in hypoxic suspensions during flow and immediately after flow stoppage and, hence, prior to the development of RBC aggregation [Fig. 3a]. Following the development of RBC aggregates, the difference of LT through oxygenated and hypoxic suspensions became smaller with increasing wavelength and the two curves approached each other at 900 nm [Fig. 3b]. Fig. 3Light transmittance spectrum of oxygenated and hypoxic blood samples. (a) During flow. (b) Immediately after flow stoppage. (c) Following the development of RBC aggregates at 60 s after flow stoppage. Curves in the three panels represent the mean light transmittance spectrum of 10 experiments with different blood samples (thick solid line for oxygenated and thick broken line for deoxygenated samples) and SE (thin solid line for oxygenated and thin broken line for deoxygenated samples). Light transmittance was normalized to light transmitted through deionized water at wavelengths between 500 to 900 nm.  The time courses of LT of oxygenated and hypoxic blood samples at wavelengths of 500, 600, 700, and 800 nm are presented in Fig. 4a, while Fig. 4b presents the data for 500 nm using an expanded scale to provide better visibility. Inspection of these curves confirms the dependence of LT characteristics of oxygenated and hypoxic blood on wavelength, with this difference being greatest at 600 nm and becoming smaller as the wavelength approached 500 and 800 nm. While the change of LT with time during RBC aggregation exhibited similar patterns at all wavelengths, there are visually detectable differences in the rate of change between oxygenated and hypoxic samples at all wavelengths (Fig. 4). These differences were also reflected in the time constants (T fast) calculated by fitting these curves to a double-exponential equation (see Sec. 3.3 and Table 1 below). Fig. 4(a)–(d) Show light transmittance time course at 500-, 600-, 700-, and 800-nm wavelengths during the 100 s period starting immediately after stopping high shear flow for oxygenated and hypoxic blood. Curves in the four panels represent the mean of 10 experiments with different blood samples (thick solid line for oxygenated and thick broken line for deoxygenated samples) and SE (thin solid line for oxygenated and thin broken line for deoxygenated samples). Note that the data for 500 nm are presented with an expanded transmittance scale (d).  Table 1RBC aggregation parameters in oxygenated and hypoxic WB, calculated using light transmittance time courses at 500, 600, 700, and 800 nm (see Sec. 2.3 for a description of parameters.) (Data are mean ± standard error. Difference from 500 nm; *: p < 0.01, **: p < 0.001. Difference from 600 nm; †: p < 0.05. Statistical significance was tested by one-way ANOVA followed by Newman-Keuls post test. §: Difference from oxygenated; p < 0.05.)
3.3.Red Blood Cell Aggregation ParametersAggregation parameters calculated using LT time courses (i.e., syllectograms) at wavelengths of 500, 600, 700, and 800 nm for oxygenated and hypoxic whole blood samples are presented in Table 1. For both oxygenated and hypoxic samples, statistically significant differences between the parameters calculated using the data at various wavelengths were detected only for those that are sensitive to light intensity [i.e., AMP and area under curve (AUC)]. In contrast, parameters that are independent of transmitted light intensity (i.e., AI, T 1/2, and T fast) did not differ regardless of the wavelength (Table 1). Therefore, time course related parameters AI, T 1/2, and T fast calculated using syllectograms recorded at different wavelengths should be comparable with each other, while the magnitude-related parameters AMP and AUC are not. This sensitivity to light intensity should be considered when comparing RBC aggregation results measured with devices using light sources of different wavelengths. However, it should also be noted that even time-course related parameters may be influenced by other factors such as the geometry of the chamber used for RBC aggregation measurements.12, 13, 15 Table 1 also presents comparisons between oxygenated and hypoxic samples for the parameters calculated using syllectograms at different wavelengths. Parameters calculated using data obtained at 500 nm did not differ between oxygenated and hypoxic samples, obviously due to higher variation of the data but not to smaller mean differences (see Fig. 5). Parameters that are sensitive to the level of LT (i.e., AMP and AUC) were significantly lower in hypoxic samples at 600 nm but not at 800 nm. At wavelengths away from the isobestic points between 600 and 800 nm, deoxyhemoglobin has a higher absorbance, yielding a ∼10-fold difference compared to oxyhemoglobin at ∼650 nm,27 with this difference reflected by parameters sensitive to transmitted light intensity (Table 1). Differences between oxygenated and hypoxic samples decreased with wavelength and were negligible for measurements at 800 nm (i.e., close to the isosbestic point),28, 29 indicating that using a light source of ∼800 nm wavelength may eliminate the influence of oxygenation on these parameters. Fig. 5Difference of calculated aggregation parameters for oxygenated and hypoxic samples expressed as a percentage of oxygenated values: (a) aggregation index (AI); (b) area under curve (AUC); (c) aggregation half time (T1/2); (d) aggregation time constant (T fast). Data are mean ± standard error; n = 10.  Interestingly, parameters reflecting the time course of RBC aggregation (i.e., T 1/2 and T fast) as determined between 600 and 800 nm were affected by the level of oxygenation (Table 1). A detailed analysis of the effect of oxygen partial pressure and, thus, hemoglobin oxygen saturation previously reported, indicates a significant dependence of aggregation time course and related parameters on the oxygenation status of the samples.18 The results of the current study also confirm the dependence of time-course related parameters on oxygenation, with significantly smaller T 1/2 values for hypoxic samples regardless of wavelengths above 500 nm used for recording syllectograms (Table 1). This pattern is also obvious in Fig. 5, where the difference between oxygenated and hypoxic samples are shown as a percentage of the oxygenated value. The difference decreased with increasing wavelength for the AUC parameter [Fig. 5b] but not for time-course dependent parameters [Figs. 5c, 5d]. Alterations in the time-course related aggregation parameters require further attention. Priezzhev reported differential alterations in T fast and T slow in samples from patients with various diseases, with this observation having diagnostic value.30 Mechanisms responsible for the influence of oxygenation on RBC aggregation kinetics are not clear and require further investigation. Nevertheless, our observations indicate that RBC aggregation measurements should include standardization of oxygenation level in the samples (e.g., equilibration of the samples with ambient air to achieve ∼100% hemoglobin oxygen saturation) even if the syllectogram recordings are done using a light source with a wavelength near an isosbestic point (i.e., ∼800 nm).28, 29 Hemoglobin oxygen saturation may significantly differ between samples used for assessing RBC aggregation unless a specific procedure is used for standardization of oxygenation; lack of standardization is expected to contribute to enhanced variance of measured data within a group, thereby influencing the statistical power of a parameter. Note that the dependence of aggregation parameters on oxygenation status has been reported for instruments using light sources in the 600- to 700-nm range, but not for instruments using light sources in the infrared range.18 3.4.Power in Detection of Alterations in Red Blood Cell AggregationThe power of RBC aggregation parameters calculated using syllectograms recorded at different wavelengths was compared by analyzing data obtained using samples with normal, decreased (i.e., 1/3 diluted plasma), and enhanced (i.e., 0.5% dextran 500) aggregation. Aggregation parameters for these samples, as measured by a widely used commercial erythrocyte aggregometer (i.e., LORCA), indicated the expected differences (Table 2). The SA parameter, which corresponds to AUC, was significantly decreased for RBC suspended in 1/3 diluted plasma and was increased for RBC suspended in the 0.5% dextran 500 solution. Significant alterations were also found in T 1/2 for the same RBC suspensions being increased for the 1/3 diluted plasma and decreased for the 0.5% dextran 500 solution. Table 2Aggregation parameters (SA and T 1/2) measured using a LORCA erythrocyte aggregometer for WB and for RBC suspended in 1/3 diluted plasma and in 0.5% dextran 500 solution. Measurements were conducted using oxygenated samples. (Data are presented as mean ± standard error; n = 10. Difference from whole blood; *: p < 0.05, **: p < 0.01.)
Parameters calculated using the data obtained using the rectangular flow channel for 800 nm wavelength revealed similar differences; parameters sensitive to the extent of aggregation (AMP and AUC) and the time course (AI and T 1/2) were significantly modified by 1/3 plasma dilution and, with the exception of AMP, were significantly modified for RBC suspended in 0.5% dextran 500 (Table 3). This pattern was similar for other wavelengths. Table 3Aggregation parameters calculated using syllectograms at 800 nm for WB, RBC in 1/3 diluted plasma or in the 0.5% dextran 500 solution. Measurements were conducted using oxygenated samples. (Data are presented as mean ± standard error; n = 10. Difference from whole blood; *: p < 0.05, **: p < 0.01, ***: p < 0.001.)
The standardized difference for a given parameter is determined by both the mean difference between two groups (i.e., normal and modified aggregation) and the common standard deviation reflecting the variation in both groups, and indicates the statistical power to detect a given experimental alteration using that parameter.31 Standardized differences between whole blood (WB) and RBC suspended in 1/3 diluted plasma were similar for AI and AUC parameters at wavelengths of 600 to 800 nm, but lower for 500 nm for both hypoxic and oxygenated samples [Figs. 6a, 6b]. The T 1/2 parameter had lower standardized differences compared to the other two parameters [Fig. 6a]. Fig. 6Standardized differences from whole blood (WB) for RBC suspended in [(a) and (b)] 1/3 diluted plasma or in [(c) and (d)] 0.5% dextran 500 for oxygenated [(a) and (c)] and hypoxic [panels (b) and (d)] samples. The data are for the three parameters (t1/2, AI, and AUC) calculated using data at 500-, 600-, 700-, and 800-nm wavelengths. See Sec. 3.4 for discussion. 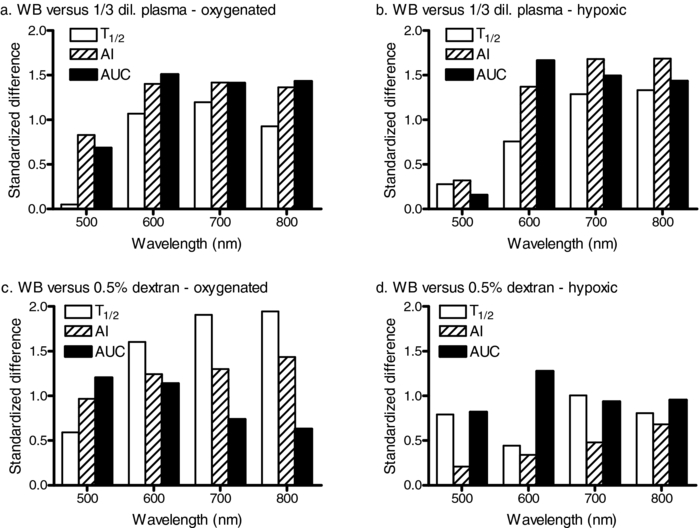 The power of the aggregation parameters to detect a given alteration of RBC aggregation was also more dependent on the wavelength for the 0.5% dextran 500 suspensions with enhanced aggregation [Fig. 6c]. However, standardized differences for T 1/2 and AUC between whole blood and RBC in 0.5% dextran 500 differed in their dependence on wavelength for oxygenated samples [Fig. 6c]: standardized differences decreased with increasing wavelength for AUC while increasing with wavelength for T 1/2 [Fig. 6c]. This pattern was not obvious with the hypoxic samples [Fig. 6d], although a slight decrease in standardized difference with increasing wavelength was detected. The decreased power of AUC at higher wavelengths is related to increased within-group variance paralleling the higher level of LT. Standardized differences for time-course dependent parameters under hypoxic conditions were significantly smaller than corresponding values for oxygenated samples, apparently related to the reduction of the time constants for hypoxic samples (Table 1). 4.ConclusionBased on the data presented above, use of a light source having a wavelength of ∼800 nm is recommended when recording syllectograms for assessment of RBC aggregation. Further, even if a light source near this wavelength is being used, it is recommended that the oxygenation status should be standardized for blood samples and RBC suspensions since kinetic parameters are influenced by the level of oxygenation. AcknowledgmentsThis study supported by NIH Research Grant Nos. HL15722, HL 70595, and HL 090511, and by the Akdeniz University Research Projects Unit. ReferencesO. K. Baskurt,
B. Neu, and
H. J. Meiselman, Red Blood Cell Aggregation, 1
–328 Chemical Rubber, Boca Raton
(2011). Google Scholar
B. Neu and
H. J. Meiselman,
“Red blood cell aggregation,”
Handbook of Hemorheology and Hemodynamics, 114
–136 IOS Press, Amsterdam,
(2007). Google Scholar
M. W. Rampling,
H. J. Meiselman,
B. Neu, and
O. K. Baskurt,
“Influence of cell-specific factors on red blood cell aggregation,”
Biorheology, 41 91
–112
(2004). Google Scholar
M. W. Rampling,
“Red cell aggregation and yield stress,”
Clinical Blood Rheology, 45
–64 Chemical Rubber, Boca Raton
(1988). Google Scholar
R. Ben Ami,
G. Barshtein,
D. Zeltser,
Y. Goldberg,
I. Shapira,
A. Roth,
G. Keren,
H. Miller,
V. Prochorov,
A. Eldor,
S. Berliner, and
S. Yedgar,
“Parameters of red blood cell aggregation as correlates of the inflammatory state,”
Am. J. Physiol. Heart Circ. Physiol., 280 H1982
–H1988
(2001). Google Scholar
S. Berliner,
O. Rogowski,
S. Aharonov,
T. Mardi,
T. Tolshinsky,
M. Rozenblat,
D. Justo,
V. Deutsch,
J. Serov,
I. Shapira, and
D. Zeltzer,
“Erythrocyte adhesiveness/aggregation; A novel biomarker for the detection of low-grade internal inflammation in individuals with atherothrombotic risk factors and proven vascular disease,”
Am. Heart J., 149 260
–267
(2005). https://doi.org/10.1016/j.ahj.2004.05.058 Google Scholar
N. Maharshak,
I. Shapira,
R. Rotstein,
J. Serov,
S. Aharonov,
T. Mardi,
A. Twig,
A. Rubinstein,
M. Kofler,
S. Berliner, and
D. Zeltser,
“The erythrocyte adhesiveness/aggregation test for the detection of an acute phase response and for the assessment of its intensity,”
Clin. Lab. Haematol., 24 205
–210
(2002). Google Scholar
J. Stuart,
“Rheological methods for monitoring the acute-phase response,”
Rev. Port. Hemorrh., 5 57
–62
(1991). Google Scholar
O. K. Baskurt,
M. Uyuklu,
P. Ulker,
M. Cengiz,
N. Nemeth,
T. Alexy,
S. Shin,
M. R. Hardeman, and
H. J. Meiselman,
“Comparison of three instruments for measuring red blood cell aggregation,”
Clin. Hemorheol. Microcirc., 43 283
–298
(2009). https://doi.org/10.3233/CH-2009-1240 Google Scholar
W. G. Zijlstra,
“Syllectometry, a new method for studying rouleaux formation of red blood cells,”
Acta Phys. Pharmacol. Neerl, 7 153
–154
(1958). Google Scholar
M. R. Hardeman,
P. T. Goedhart, and
S. Shin,
“Methods in hemorheology,”
Handbook Hemorheology and Hemodynamics, 242
–266 IOS Press, Amsterdam,
(2007). Google Scholar
J. G. G. Dobbe,
G. J. Streekstra,
J. Strackee,
M. C. M. Rutten,
J. M. A. Stijnen, and
C. A. Grimbergen,
“Syllectometry: the effect of aggregometer geometry in the assessment of red blood cell shape recovery and aggregation,”
IEEE Trans. Biomed. Eng., 50 97
–106
(2003). https://doi.org/10.1109/TBME.2002.807319 Google Scholar
A. Gaspar-Rosas and
G. B. Thurston,
“Erythrocyte aggregate rheology by transmitted and reflected light,”
Biorheology, 25 471
–487
(1988). Google Scholar
J. H. Nam,
Y. Yang,
S. Chung, and
S. Shin,
“Comparison of light transmission and backscattering methods in the measurement of RBC aggregation,”
J. Biomed. Opt., 15 027003
(2010). https://doi.org/10.1117/1.3365951 Google Scholar
S. Shin,
Y. Yang, and
J. S. Suh,
“Measurement of erythrocyte aggregation in a microchip-based stirring system by light transmission,”
Clin. Hemorheol. Microcirc., 41 197
–207
(2009). Google Scholar
O. K. Baskurt,
M. Uyuklu,
M. R. Hardeman, and
H. J. Meiselman,
“Photometric measurements of red blood cell aggregation: light transmission versus light reflectance,”
J. Biomed. Opt., 14 54044/1
–54044/6
(2009). https://doi.org/10.1117/1.3251050 Google Scholar
A. Roggan,
M. Friebel,
K. Dirschel,
A. Hahn, and
G. Muller,
“Optical properties of circulating human blood in the wavelength range 400–2500 nm,”
J. Biomed. Opt., 4 36
–46
(1999). https://doi.org/10.1117/1.429919 Google Scholar
M. Uyuklu,
H. J. Meiselman, and
O. K. Baskurt,
“Effect of hemoglobin oxygenation level on red blood cell deformability and aggregation parameters,”
Clin. Hemorheol. Microcirc., 41 179
–188
(2009). https://doi.org/10.3233/CH-2009-1168 Google Scholar
O. K. Baskurt,
M. Boynard,
G. R. Cokelet,
P. Connes,
B. M. Cooke,
S. Forconi,
F. Liao,
M. R. Hardeman,
F. Jung,
H. J. Meiselman,
G. B. Nash,
N. Nemeth,
B. Neu,
B. Sandhagen,
S. Shin,
G. B. Thurston, and
J. L. Wautier,
“New guidelines for hemorheological laboratory techniques,”
Clin. Hemorheol. Microcirc., 42 75
–97
(2009). https://doi.org/10.3233/CH-2009-1202 Google Scholar
O. K. Baskurt,
M. Uyuklu, and
H. J. Meiselman,
“Time course of electrical impedance during red blood cell aggregation in a glass tube: comparison with light transmittance,”
IEEE Trans. Biomed. Eng., 57 969
–978
(2010). https://doi.org/10.1109/TBME.2009.2036598 Google Scholar
O. K. Baskurt,
H. J. Meiselman, and
E. Kayar,
“Measurement of red blood cell aggregation in a ‘plate-plate’ shearing system by analysis of light transmission,”
Clin. Hemorheol. Microcirc., 19 307
–314
(1998). Google Scholar
M. R. Hardeman,
J. G. G. Dobbe, and
C. Ince,
“The laser-assisted optical rotational cell analyzer (LORCA) as red blood cell aggregometer,”
Clin. Hemorheol. Microcirc., 25 1
–11
(2001). Google Scholar
J. Cohen, Statistical Power Analysis for the Behavioral Sciences, 2nd ed.Earlbaum, Hillsdale, NJ
(1988). Google Scholar
J. Stuart,
P. C. W. Stone,
G. Freyburger,
M. R. Boisseau, and
D. G. Altman,
“Instrument precision and biological variability determine the number of patients required for rheological studies,”
Clin. Hemorheol., 9 181
–197
(1989). Google Scholar
L. D. Shvartsman and
I. Fine,
“Optical transmission of blood: Effect of erythrocyte aggregation,”
IEEE Trans. Biomed. Eng., 50 1026
–1033
(2003). https://doi.org/10.1109/TBME.2003.814532 Google Scholar
M. Friebel,
J. Helfmann,
G. Muller, and
M. Meinke,
“Influence of shear rate on the optical properties of human blood in the spectral range 250 to 1100 nm,”
J. Biomed. Opt., 12 054005
(2007). https://doi.org/10.1117/1.2799154 Google Scholar
M. Friebel,
J. Helfmann,
U. Netz, and
M. Meinke,
“Influence of oxygen saturation on the optical scattering properties of human red blood cells in the spectral range 250 to 2000 nm,”
J. Biomed. Opt., 14 034001
(2009). https://doi.org/10.1117/1.3127200 Google Scholar
G. S. Dubova,
A. Ya. Khairullina, and
S. F. Shumilina,
“The recovery of the absorption spectra of oxy- and deoxyhemoglobin from the coefficients of diffuse transmission and reflection of whole blood,”
J. Appl. Spectrosc., 36 66
–71
(1982). https://doi.org/10.1007/BF00618424 Google Scholar
O. Hazeki and
M. Tamura,
“Quantitative analysis of hemoglobin oxygenation state of rat brain in situ by near-infrared spectrophotometry,”
J. Appl. Physiol., 64 796
–802
(1988). Google Scholar
A. V. Priezzhev,
O. M. Ryaboshapka,
N. N. Firsov, and
I. V. Sirko,
“Aggregation and disaggregation of erythrocytes in whole blood: study by backscattering technique,”
J. Biomed. Opt., 4 76
–84
(1999). https://doi.org/10.1117/1.429923 Google Scholar
J. Stuart,
P. C. W. Stone,
G. Freyburger,
M. R. Boisseau, and
D. G. Altman,
“Instrument precision and biological variability determine the number of patients required for rheological studies,”
Clin. Hemorheol., 9 181
–197
(1989). Google Scholar
|


