|
|
1.IntroductionA recent technological innovation provides focused neural stimulation using optical radiation. It has been demonstrated that auditory neurons can be stimulated with infrared radiation.1, 2, 3 This type of stimulation has been termed infrared neural stimulation (INS) and does not require the transgenic induction or exogenous application of chromophores.4, 5, 6 The use of lasers to evoke neural responses has several appealing features when compared to electrical stimulation: no direct contact is necessary between the stimulating source and the tissue (i.e., INS can be delivered through air), a finer spatial resolution of stimulation can be achieved, and no stimulation artifact is generated to deter simultaneous recordings of electrical responses from the neurons.7, 8 At many of the wavelengths used for optical stimulation, the radiation can be easily coupled to an optical fiber. Appropriate laser parameters will significantly affect the success of stimulation; e.g., wavelength dictates light scatter and absorption in the tissue. During INS, the stimulated area is confined to only the tissue along the optical path.9 Thereby, more spatially discrete populations of neurons should be stimulated as compared to electrical stimulation.10 Previous work has demonstrated that optical stimulation is spatially selective in motor nerves and the cochlea. For the sciatic nerve, single fascicles could be activated during irradiation of the nerve trunk.8, 11 The selectivity of optical stimulation in the cochlea was studied with an immunohistochemical method.12 Results showed more spatially confined areas of neural stimulation with INS as compared to electrical current. However, the method was biased because staining could only be achieved after exposure to high-level stimuli, tone pips, electrical current, or optical radiation. High-level stimuli likely activated larger populations of spiral ganglion cells, leading to a poorer spatial selectivity of stimulation. Therefore, to fully understand the benefits and limitations of optical stimulation, it would be important to determine the selectivity for low-level optical stimuli as well. In this manuscript, spatial selectivity of cochlear INS has been measured using a real-time electrophysiological masking method. Masking refers to the ability of a masker stimulus (presented simultaneously or in short sequence with a probe stimulus) to reduce the response evoked by the probe stimulus alone. Dallos and Cheatham have, for example, shown that the cochlear compound action potential (CAP) amplitude evoked by a pure tone (probe) could be reduced by another pure tone (masker).13 At the level of the single neuron, simultaneous masking is manifested by a suppression of neural firing evoked by the probe alone. Resulting masker level-frequency curves (masker tuning curves or MTCs) showed a tuned response with a minimum masker level at the probe's frequency. Tone-on-tone MTCs reflect the activation of a local population of neurons along the cochlea, when using low-to-moderate probe tone levels. Thus, the MTCs provide a measure of cochlear frequency selectivity at the site of stimulation. The recordings occur directly at the site of stimulation and do not reflect any upstream processing that may be reflected in neural responses recorded from the brain. Here, “tone-on-light” MTCs were generated using a probe response evoked by INS and masked by a continuous acoustic masker. These experiments provide electrophysiological measurements that determine the cochlear region(s) stimulated by the laser. Since the cochlea has a tonotopic arrangement (high frequencies are encoded at the cochlear base, low frequencies at the cochlear apex), the physical location of the optical fiber along the cochlea can be translated into a corresponding frequency location of stimulation. Tone-on-light MTCs measure the spread of excitation during INS and can be compared with tone-on-tone MTCs. 2.MethodsAll measurements were made in vivo using adult gerbils (Meriones unguiculatus). Animal care and use in this study was carried out in accordance with the NIH guidelines for the Care and Use of Laboratory Animals and was approved by the Northwestern University Animal Care and Use Committee. Eight animals were used for the tone-on-light masking experiments, and seven animals were used for tone-on-tone masking experiments. In some instances, multiple data sets, for both tone-on-light MTCs and tone-on-tone MTCs, were recorded in one animal. 2.1.SurgeryAnimal surgery was performed as described previously.14 Briefly, gerbils were anesthetized by an initial intraperitoneal injection of sodium pentobarbital (80 mg/kg body weight). Maintenance doses were 17 mg/kg body weight and were given throughout an experiment whenever the animal showed signs of increasing arousal. Depth of anesthesia was assessed every 30 min by a paw withdrawal reflex. After the animal was fully anesthetized, breathing was facilitated by performing a tracheotomy and securing a length of PE90 tubing into the opening in the trachea. To maintain body temperature at 38°C, the animal was placed on a heating pad. Its head was stabilized in a heated head holder. The cochlea was accessed using a ventral approach. The animal was positioned belly up and a dermal incision was made from the lower right jaw to the right shoulder in order to expose the right submandibular gland, which was subsequently ligated and removed. The muscles attached to the bulla and to the styloid bone were carefully dissected. Next, the bulla was opened, allowing access to the cochlea. A silver recording electrode was hooked onto the bony rim of the round window of the cochlea, and a ground electrode was placed under the skin at the left jaw. After cutting the cartilaginous outer ear canal, a speculum (to connect the sound delivery system) was cemented to the bony part of the outer ear canal. The surgical platform containing the animal was then moved onto a vibration isolation table in a soundproof booth. Two chest electrodes were attached to monitor heart rate, and a speaker (DT770Pro, Beyerdynamic) was coupled to the speculum at the ear canal. 2.2.Monitoring Cochlear FunctionVoltage commands for acoustic stimuli were generated using a computer I/O board (KPCI 3110, Keithley) inserted into a PC and were used to drive the speaker. The sound pressure out of the speaker was calibrated with a 1/8 in. Bruel and Kjaer microphone. All data are presented as calibrated sound pressure level in decibels (dB). 2.2.1.Compound action potentialsA series of auditory nerve CAP threshold curves were obtained across frequencies in order to determine baseline cochlear function and verify a normal hearing animal. Acoustically evoked compound action potentials were measured using a modified tracking procedure.15, 16, 17 CAPs were measured between 2 and 50 kHz, with a resolution of 6 steps/octave. The acoustic stimuli were 12 ms tone bursts (including 1 ms rise/fall), which were presented in opposite phase. Thirty-two cochlear responses to the tone bursts were averaged for a single measurement. CAP threshold was defined as 30 ± 3 μV (N1/P1 amplitude). Acoustic CAP threshold curves that were acquired after the tone-on-light masking experiments showed no systematic shift in threshold, indicating that the cochlear preparation remained stable throughout the length of the experiment. 2.3.Masking Procedures2.3.1.Tone-on-tone maskingStimuli consisted of a probe tone and a masker tone. The probe tone (12 ms duration, including a 1 ms rise/fall) was simultaneously overlapped by a masker tone (34 ms duration including a 5 ms rise/fall). Stimuli were presented at a rate of 4 Hz. Tone-on-tone masking data were acquired using CAPs. To measure tone-on-tone MTCs, the frequency of the probe tone was fixed and was presented at a given sound level such that the probe-evoked CAP was approximately 40 to 50 μV. The data were averaged for 32 presentations of the tone. Next, the variable-frequency masker was presented in addition to the probe, and the probe-evoked CAP was recorded again. The sound level at each masker frequency was adjusted to reduce the probe-evoked CAP by 6 dB, or 20 to 25 μV. The resulting level of the masker was then plotted versus the masker frequency. A tuned frequency-level masking curve resulted, termed MTC. 2.3.2.Tone-on-light maskingMasking experiments were conducted with laser pulses as the probe stimulus, and continuous acoustic tones as the masker. The placement of the optical fiber in the cochlea determined the “frequency” of stimulation. The energy level of the laser (probe) was fixed for each experiment. The acoustic masker was varied in frequency and in level, as described previously for tone-on-tone masking experiments. A pulsed diode laser (wavelength = 1.86 μm, pulse duration = 20 μs, repetition rate = 2 Hz; Research Infrared Nerve Stimulator, Lockheed-Martin Aculight Corp.) was used to generate the probe stimulus. Previous work has examined the wavelength variability of INS in the sciatic nerve8 and in the cochlea.3, 18 The current wavelength was selected based on data that showed an optimal margin of safety between stimulation and ablation in the sciatic nerve at wavelengths with a similar penetration depth. In contrast to earlier studies that used a shorter penetrating wavelength that required the optical fiber to be placed at the modiolus to evoke cochlear responses,18 the wavelength used in this study had a longer penetration depth and, therefore, the optical fiber could be placed such that the tip was approximately 0.5 mm from the spiral ganglion cells and was in contact with the fluids on the round window membrane. The laser was coupled to a 200-μm core diameter optical fiber (FIP series, Polymicro), which was inserted through the opening in the bulla and abutted to the round window membrane (Fig. 1). The optical fiber was mounted on an x-y-z translator (MMW-203, Narishge) attached to a micromanipulator to control the fine position. The optical fiber was in contact with the round window membrane, but did not penetrate it. The fiber was visually oriented toward the spiral ganglion cells in Rosenthal's canal in the upper basal turn, which is approximately 2.5 mm along the length of the basilar membrane from the most basal end of the cochlea. At the wavelength used here, the ∼10 μm thick round window membrane likely has a negligible effect on the optical beam and can be modeled by water absorption, to a first approximation.19, 20, 21 Our in vitro measurements have documented that the beam exiting an optical fiber immersed in saline will diverge approximately 3 deg from collimated (unpublished). As previously shown,11 the exiting beam had a radial Gaussian profile. Radiant exposures at the tip of the fiber were between 10 and 20 mJ/cm2 as measured by an energy sensor (J50LP-1A, Coherent-Molectron). The radiant energies evoked a CAP of 40 to 50 μV, moderately above threshold. The noise level of the recording system was ∼6 μV and the INS-evoked CAP amplitude was typically 250 μV at saturation.3 Fig. 1Placement of the optical fiber for tone-on-light masking experiments. An ex vivo image of the 200-μm diameter optical fiber inserted into the gerbil cochlea. The optical fiber was abutted to the round window membrane, but did not puncture it. The orientation was toward the lateral position of the round window (left in this picture). Various tuning curves were acquired with the optical fiber in different positions in the round window along the trajectory from lateral to medial (left to right). The fiber was mounted on an x-y-z translator coupled with a micromanipulator. (See also Ref. 18 for optical fiber placement.) 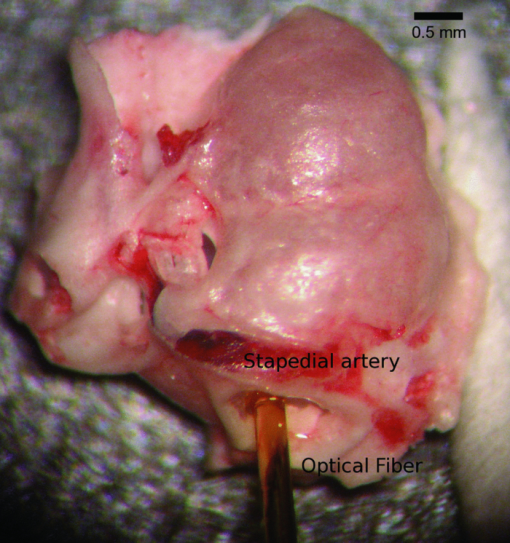 An unmasked optically-evoked CAP was recorded to determine the baseline response. The responses to 10 stimulus presentations were averaged. Next, the continuous acoustic masker tone was presented in addition to the laser pulse. The acoustic masker was on for 2 to 3 s prior to the 10 repetitions of the laser pulse being presented. For each masker frequency and level, the INS-evoked CAP was measured. Similar to the tone-on-tone experiments, the masker level that was needed to decrease the INS-evoked CAP by 6 dB was recorded. Experiments began with the masker at 32 kHz, decreasing by 6 steps/octave, to 1 kHz. The sound level at each acoustic frequency began with the maximum output from the speaker and was decreased in steps of 5 dB until the criterion was reached, a decrease of the probe's response by 6 dB. The resulting level of the masker was then plotted versus the corresponding frequency. A tuned frequency-level curve resulted. To document any changes in cochlear function due to laser irradiation, acoustic CAP threshold measurements were conducted at the conclusion of the experiments. 2.4.Data AnalysisResultant tone-on-tone and tone-on-light MTCs were analyzed with Igor Pro software (WaveMetrics). Each data set was interpolated to 100 points using a smoothing cubic spline function based on the nearest 3 points.22 All measurements were made on the interpolated data. For tone-on-tone masking paradigms, the frequency at which the MTC shows the lowest masker sound level is termed the best frequency (BF). The BF of the tuning curve corresponds to the frequency of the probe tone (Fig. 2). The sharpness of tuning describes the selectivity of the neural response. One method of characterizing the sharpness of tuning at the BF is by the bandwidth (BW) of the tuning curve at 10 dB above the MTC tip level. The sharpness of tuning (Q 10dB) was calculated as follows:
[TeX:]
\documentclass[12pt]{minimal}\begin{document}\begin{eqnarray*}
Q_{10{\rm dB}} = \frac{{{\rm BF}}}{{{\rm BW}_{10{\rm dB}} }}
\end{eqnarray*}\end{document}
(see Fig. 2 for a graphical representation of tuning curve calculations). In addition to sharpness of tuning, the slope of the high-frequency side of the MTCs was calculated. The slope (in dB/octave) was measured between 20 and 50 dB above the BF masker level on the high frequency side of the MTC. The tip-to-tail ratio was measured as the ratio between the masker level at the BF to the masker level at one octave below the BF. Statistical significance was calculated with a two-tailed Student's t-test at α = 0.5.
Fig. 2Representative tone-on-tone MTC with calculations for data analysis. This tone-on-tone MTC shows the best frequency (tip of the tuning curve) and the sharpness of tuning, Q 10dB, which was determined by the ratio of BF to the MTC width at 10 dB sound level above BF level. For the tuning curve shown, BF = 10 kHz and the level at BF is 50 dB. At a sound level of 60 dB, or 10 dB above the BF level, the width of the curve extends from 9.4 to 10.4 kHz, giving Q 10dB = 10/(10.4 to 9.4) = 10. The slope was measured as the rise/run between 20 and 50 dB above the BF level. When the high frequency side of a curve did not extend 50 dB above the BF level, we calculated the slope to the highest masker level. At 20 dB above the BF level, or 70 dB, the frequency is 11.2 kHz, and at 50 dB above the BF level, the frequency is 13.4 kHz. Therefore, the slope = (100 to 70 dB)/log2(13.4kHz/11.2kHz) = 115.9 dB/octave. The tip-to-tail ratio was measured as the ratio between the masker level at the BF to the masker level one octave below the BF. For this tuning curve, one octave below the BF occurs at 5 kHz, however, the data do not extend to quite this low of a frequency. When the low frequency tail did not extend one full octave below the best frequency, as is the case with this curve, the masker level at the lowest frequency of the tail was used. At this frequency, we measured a sound level of 97 dB, giving a tip-to-tail ratio = 50/97 = 0.51. 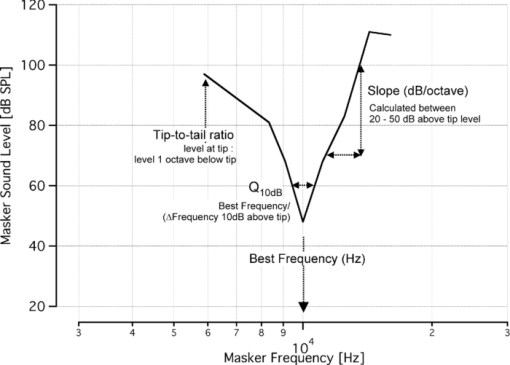 3.ResultsA masking method was used to determine the spatial selectivity of acoustic and infrared neural stimulation in the gerbil cochlea. MTCs were measured and compared for an acoustic probe and for a laser probe. The resulting tone-on-light MTCs exhibit a tuned response, with a characteristic tip at the best frequency and sloped sides (Fig. 3). The tone-on-light MTCs exhibit more variability in the shape of the MTC, as compared to the tone-on-tone MTCs. When irradiating the spiral ganglion through the round window, tone-on-light MTCs had BFs between 5.3 and 11.4 kHz (n = 9). Comparative tone-on-tone MTCs were recorded and had BFs ranging from 4.9 to 11.4 kHz. Tone-on-tone and tone-on-light MTCs with similar best frequencies are shown in Fig. 3 for comparison. Figure 4a shows all tone-on-light MTCs that were recorded. The graphs have been normalized across the frequency axis and the BF occurs at 0. While there are minor differences in the shapes of each individual MTC, no systematic trends in size, shape, or slopes are apparent with respect to BF for tone-on-light MTCs. The average tone-on-light MTC has been computed and exhibits a tuned response [Fig. 4b]. Fig. 3Tone-on-light MTCs demonstrate spatially selective infrared neural stimulation. Several examples of tone-on-light MTCs, shown in solid lines, are compared with the tone-on-tone MTCs, shown in dotted lines. The data are presented on three separate graphs, grouped according to BF, for clarity of presentation. Each tone-on-light MTC shows the raw data measured from one trial in one animal with a fixed optical fiber position and fixed laser energy/pulse. Each tone-on-tone MTC shows the raw data measured from one masking trial in one animal at one fixed probe frequency and level. Optical fiber locations were varied between trials, therefore leading to MTCs with different BFs. Both optical and acoustic probe levels were selected that a 40 to 50 μV CAP resulted when the probe was presented alone. 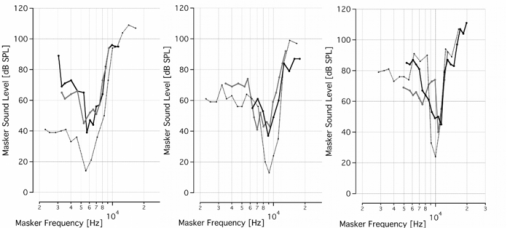 Fig. 4Normalized tone-on-light MTCs. (a) The graph shows nine tone-on-light MTCs that have been normalized on the frequency axis, represented in octaves. The zero point corresponds to the BF of the MTC. All tone-on-light MTCs exhibit a tuned response. Most MTCs extend over a ∼1.5 octave range. The legend shows the BF of the MTC. (b) This graph presents the averaged data from (a) with error bars representing the standard deviation. Some data points reflect the average and standard deviation of fewer than nine measurements due to the variation in bandwidth of the individual MTCs. Note that the octave is a log2 representation of frequency, in contrast to the log10 abscissa shown in Fig. 3. 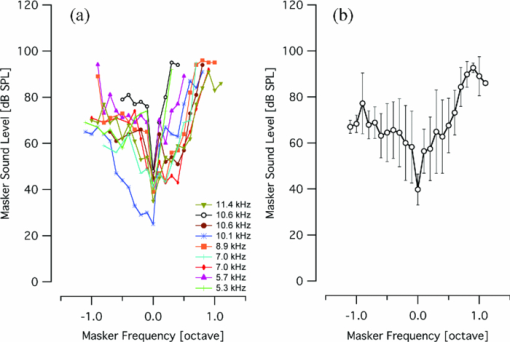 Tone-on-light MTCs had Q 10dB ratios that ranged from 1.9 to 7, with an average value of 3.4 ± 2.0 (mean ± s.d.; n = 9) and a median value of 2.4 (Fig. 5). These values are similar to the tone-on-tone MTCs, which ranged from 1.8 to 5.8 (mean: 3.2 ± 1.5; median 3.2; n = 8). A two-tailed t-test showed no statistical difference between these two populations in terms of this measure of spatial selectivity (p > 0.5). The other measurements used to characterize MTCs were the slope of the high-frequency side of the tuning curve and the tip-to-tail ratio. Most of the data that were calculated from the tone-on-light MTCs fell within the range of the data calculated from tone-on-tone MTCs. Slopes ranged between 11 and 203 dB/octave (mean: 87 ± 54 dB/octave; median: 81 dB/octave) for tone-on-light data [Fig. 6a]. Note, all but one data set had a slope greater than 50 dB/octave. Slopes measured for acoustic MTCs ranged from 75 to 219 dB/octave (mean: 130 ± 56 dB/octave; median: 112 dB/octave). Slopes derived from tone-on-light MTCs were not statistically significantly different from slopes derived from tone-on-tone MTCs (p > 0.1). The tip-to-tail ratios for the tone-on-light MTCs were also similar to those measured from tone-on-tone MTCs [Fig. 6b]. Ratios for tone-on-light MTCs were 0.58 to 0.82 (mean: 0.70 ± 0.08; median: 0.69) and ratios for tone-on-tone MTCs were 0.33 to 0.84 (mean: 0.56 ± 0.19; median: 0.50). Tip-to-tail ratios derived from tone-on-light MTCs were not statistically significantly different from ratios from tone-on-tone MTCs (p = 0.07). Fig. 5Selectivity and quantification of tone-on-tone and tone-on-light MTCs. Q 10dB values indicate the sharpness of tuning for tone-on-tone and tone-on-light MTCs. The tone-on-light MTCs have similar Q 10dB values to the tone-on-tone MTCs, with a larger Q 10dB ratio signifying a more selective stimulation. Data from tone-on-light MTCs are represented by filled circles and tone-on-tone MTCs are represented in open triangles. Tone-on-light MTCs had Q 10dB ratios that ranged from 1.9 to 7, with an average value of 3.4 ± 2.0 (mean ± s.d.; n = 9) and a median value of 2.4. These values are similar to the tone-on-tone MTCs, which ranged from 1.8 to 5.8 (mean: 3.2 ± 1.5; median 3.2; n = 8). A Q 10dB ratio could not be calculated for the acoustic CAP tuning curve with a BF at 5.3 kHz because the low frequency side of the curve did not increase 10 dB. 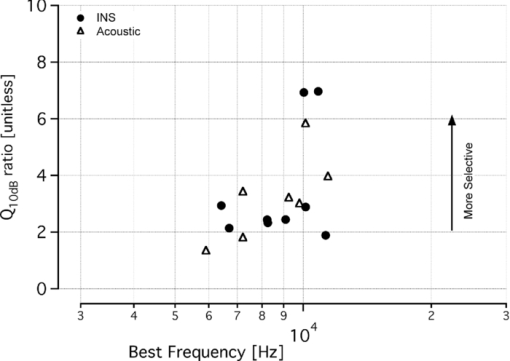 Fig. 6MTC slope and tip-to-tail calculations. Calculations of the slope of the high frequency side of the MTCs and the tip-to-tail ratio show tone-on-light MTCs exhibit similar values to tone-on-tone MTCs, though they vary over a larger range. Data from tone-on-light MTCs are represented by filled circles and tone-on-tone MTCs are represented in open triangles. (a) Slopes ranged between 11 and 203 dB/octave (mean: 87 ± 54 dB/octave; median: 81 dB/octave) for tone-on-light data. Note, all but one data set had a slope greater than 50 dB/octave. Slopes measured for acoustic MTCs ranged from 75 to 219 dB/octave (mean: 130 ± 56 dB/octave; median: 112 dB/octave). (b) Tip-to-tail ratios of tone-on-light and tone-on-tone tuning curves have similar values and ranges. Ratios for tone-on-light MTCs were 0.58 to 0.82 (mean: 0.7 ± 0.08; median: 0.69) and ratios for tone-on-tone MTCs were 0.33 to 0.84 (mean: 0.56 ± 0.19; median: 0.50). 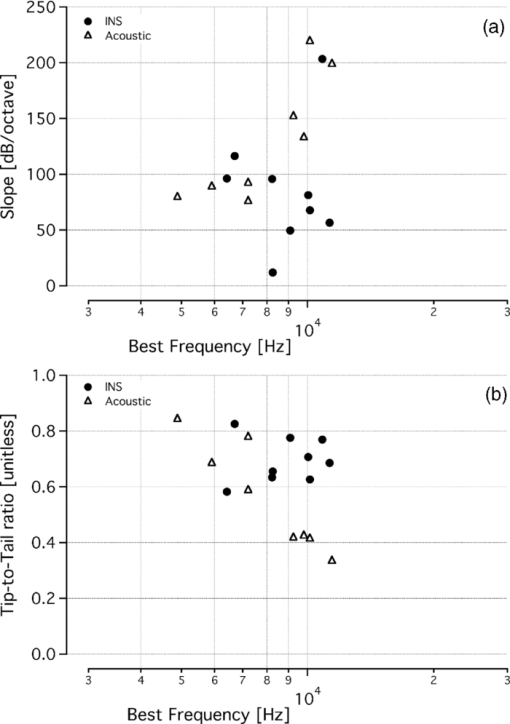 When the optical fiber was moved from a more apical irradiation orientation to a more basal irradiation one, the resulting tone-on-light MTCs had different BFs. Figure 7 shows one example of that behavior. The BFs of these curves were 5.3 and 10.8 kHz, which is in close agreement with the amount of frequency change expected for an ∼1 mm translation, based on a 1.4 mm/octave frequency-place slope of the gerbil.23, 24 In other animals, when the optical fiber was translated 200 to 500 μm within the round window, MTCs shifted BFs from 9.4 to 8.3 kHz and from 8.6 to 6.1 kHz. Fig. 7Best frequency of tone-on-light tuning curves depends on optical fiber position. Two tone-on-light MTCs were recorded from the same animal, with the optical fiber at a different location along the cochlea for each curve. The optical fiber was translated from a more apical irradiation orientation to a more basal orientation within the round window. The best frequencies of the tone-on-light tuning curves are 5.3 and 10.8 kHz. 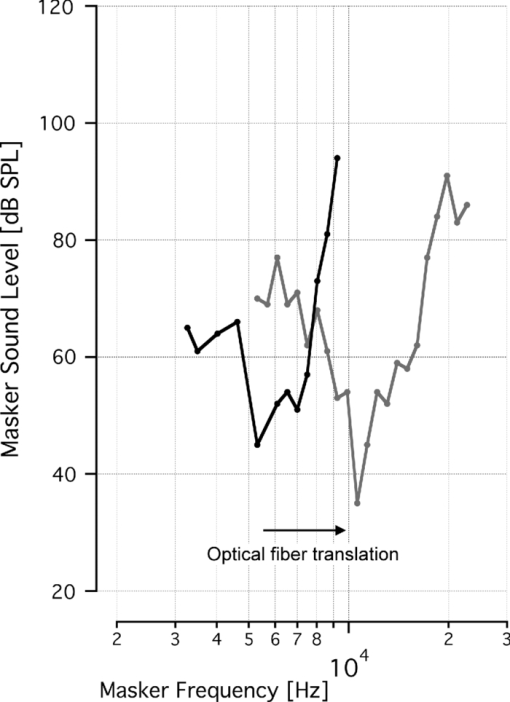 4.DiscussionTo assess the spatial spread of optical stimulation in the gerbil cochlea, tone-on-light masking experiments were conducted. Here, the response to a laser pulse was masked with continuous acoustic tones. The resulting tone-on-light MTCs were qualitatively and quantitatively similar to the tone-on-tone MTCs. Tone-on-light MTCs had BFs between 5.3 and 11.4 kHz. The BFs correspond to the irradiation location of optical fiber along the spiral ganglion. Previous experiments using the same optical fiber orientation delivering high-level optical stimuli have shown neural activation in the upper basal portion of the cochlea, about one turn above the tip of the optical fiber.12 In addition, the beam path of INS was measured in the guinea pig cochlea.25 These data demonstrated that, due to the surgical access obtained and the orientation of the optical fiber, it was extremely difficult to target neurons in the very base of the cochlea. Most often, neurons ½ to 1 full turn more apical from the surgical access were targeted. Given that the length of the gerbil basilar membrane is ∼11.4 mm in total and the hearing range of the gerbil is between 0.14 and 63 kHz, the gerbil frequency-place map has a slope of ∼1.4 mm/octave.23, 24 Hence, the frequency of the neurons opposite to the optical fiber in the upper basal turn of the gerbil cochlea should be centered around the 7 kHz location. Indeed, the range of BFs measured for the tone-on-light MTCs, from 5.3 to 11.4 kHz, include this calculated location. However, keep in mind that 7 kHz is an approximate location because the above data are calculated based on the frequency-place map of the basilar membrane, and not for the spiral ganglion, the likely location of INS depolarization. It is known that the spiral ganglion can have a compressed and/or shifted frequency-place map relative to that of the basilar membrane.26 The corresponding change in best frequency, as shown in Fig. 6, demonstrates that the placement of the optical fiber determines the location of stimulation in the cochlea and thus the frequency. The most important information that can be gained from the tone-on-light MTCs is the spatial confinement of INS. Here, the measure of the spatial spread of stimulation is expressed by the Q 10dB ratio. With increasing Q 10dB values, the stimulated area decreases. The tone-on-light Q 10dB ratios were statistically the same as the tone-on-tone Q 10dB ratios. Therefore, with a 200-μm diameter optical fiber, the results suggest that the areas of optical and acoustic neural stimulation are approximately the same at low stimulus levels. It is likely that a decrease in the optical fiber diameter would decrease the area of neural stimulation, which would be reflected as a narrower tuning curve (higher Q 10dB). Data measuring the spatial extent of cochlear INS using inferior colliculus recordings also indicated spatially restricted areas of stimulation with similar BFs.27 The advantage of the inferior colliculus (IC) recordings is that they can be achieved in an acutely deafened animal model and multiple locations in the IC can be probed simultaneously. These data, however, were recorded from the auditory midbrain and potentially reflect processing of the neural signals upstream from the cochlea. The experiments presented here are a direct measurement of the evoked cochlear responses at the site of stimulation. Tone-on-tone MTCs measured in this study are comparable to published data. Q 10dB values for acoustic MTCs previously recorded from the gerbil CAP ranged from ∼2 to 7, which overlaps with the range of values reported here.28, 29, 30 It has been shown that continuous acoustic MTCs and simultaneous pulsed acoustic MTCs show similar sharpness of tuning.13 Therefore, the data collected with continuous acoustic masking of pulsed optical radiation can be compared to simultaneous pulsed tone-on-tone MTCs. INS is likely mediated by a photothermal mechanism. The radiation is primarily absorbed by water in the tissue and this energy is dissipated as heat.9 Recent evidence indicates that secondary to the transient temperature rise, a change in the capacitance of the lipid occurs (Homma, K., personal communication). However, the presence of a temperature-dependent capacitance change does not preclude the existence of additional mechanisms mediating INS. It is unlikely that a primary photomechanical mechanism causes the neural depolarization given that the optical parameters here operate outside of stress confinement. Nevertheless, we have examined INS in acute and chronic deafened animals and shown that they do not have significantly elevated optical stimulation thresholds at short pulse durations when compared to normal hearing animals.31 In the chronic deafened animals, there were no remaining hair cells, negating the possibility that INS in the cochlea is mediated by a laser-induced pressure wave in the perilymph. However, there were remaining spiral ganglion neurons, the likely location for INS action. For the experiments presented here, deafening the animals would have abolished the ability to achieve acoustic masking and rendered the experiments unfeasible. One might speculate on the benefits of this method of neural stimulation for neural interfaces, in particular cochlear implants. Cochlear implants are one of the most successful clinical neuroprostheses, restoring sound perception to severely deaf individuals by electrically stimulating auditory neurons in the inner ear. However, electrical stimulation can suffer from electric current spread in tissue, preventing spatially localized stimulation of the neural tissue.32, 33, 34, 35, 36, 37 It has been argued that the performance of neural interfaces, including cochlear implants, could be improved significantly if more discrete locations of neurons could be stimulated simultaneously. Various modifications to traditional electrical stimulation paradigms are under investigation to increase the spatial selectivity of stimulation and the performance of cochlear implant users.38, 39, 40, 41 A more spatially selective stimulation paradigm using INS may also allow for more independent stimulation channels to be presented simultaneously. Here, we demonstrated that cochlear INS activates a selective portion of the cochlea, on the order of a low level tone. Before designing an optical cochlear implant, though, studies on chronic stimulation and safety of INS will be conducted, particularly at high rates of stimulation that are relevant to the cochlea and cochlear implants. Acute studies of high repetition rate stimulation demonstrate no change in CAP amplitude while stimulating up to 200 Hz for up to 8 h.3, 42, 43 Other parameters, such as placement of optical sources, will be examined and optimized for an optical cochlear implants. In summary, the results provided in this paper support the view that optical radiation can provide spatial selectivity of stimulation similar to acoustic stimulation of the cochlea. Optical radiation can be directed and confined to a small volume of tissue, can stimulate small populations of neurons, and can be deployed in a noncontact fashion (through air) or in a fluid interface, which leads to little divergence of the optical radiation beam. AcknowledgmentsThis project has been funded in whole or in part with federal funds from the National Institute on Deafness and Other Communication Disorders, National Institutes of Health, Department of Health and Human Services, under Contract No. HHSN260-2006-00006-C/NIH No. N01-DC-6-0006, by NIH Grant Nos. R41 DC008515-01 and F31 DC008246-01, and the E. R. Capita Foundation. The authors would like to thank Aculight Corporation for lending the laser that was used for these experiments. ReferencesA. Izzo,
C.-P. Richter,
J. Walsh, and
D. Jansen,
“Safe ranges for optical cochlear neurons stimulation,”
Abstr. Assoc. Res. Otolaryngol., 28 1013
(2005). Google Scholar
A. D. Izzo,
C.-P. Richter,
E. D. Jansen, and
J. T. Walsh,
“Laser stimulation of the auditory nerve,”
Laser Surg. Med., 38
(8), 745
–753
(2006). https://doi.org/10.1002/lsm.20358 Google Scholar
A. D. Izzo,
J. Joseph T. Walsh,
E. D. Jansen,
M. Bendett,
J. Webb,
H. Ralph, and
C.-P. Richter,
“Optical parameter variability in laser nerve stimulation: a study of pulse duration, repetition rate, and wavelength,”
IEEE Trans. Biomed. Eng., 54
(6 Pt 1), 1108
–1114
(2007). https://doi.org/10.1109/TBME.2007.892925 Google Scholar
M. Banghart,
K. Borges,
E. Isacoff,
D. Trauner, and
R. Kramer,
“Light-activated ion channels for remote control neuronal firing,”
Nat. Neurosci., 7
(12), 1381
–1386
(2004). https://doi.org/10.1038/nn1356 Google Scholar
S. Q. Lima and
G. Miesenböck,
“Remote control of behavior through genetically targeted photostimulation of neurons,”
Cell, 121 141
–152
(2005). https://doi.org/10.1016/j.cell.2005.02.004 Google Scholar
H. Wang,
J. Peca,
M. Matsuzaki,
K. Matsuzaki,
J. Noguchi,
L. Qiu,
D. Wang,
F. Zhang,
E. Boyden,
K. Deisseroth,
H. Kasai,
W. Hall,
G. Feng, and
G. Augustine,
“High-speed mapping of synaptic connectivity using photostimulation in Channelrhodopsin-2 transgenic mice,”
Proc. Natl. Acad. Sci. U.S.A., 104
(19), 8143
–8148
(2007). https://doi.org/10.1073/pnas.0700384104 Google Scholar
J. Wells,
C. Kao,
K. Mariappan,
J. Albea,
E. D. Jansen,
P. Konrad, and
A. Mahadevan-Jansen,
“Optical stimulation of neural tissue in vivo,”
Opt. Lett., 30
(5), 504
–506
(2005). https://doi.org/10.1364/OL.30.000504 Google Scholar
J. Wells,
C. Kao,
E. D. Jansen,
P. Konrad, and
A. Mahadevan-Jansen,
“Application of infrared light for in vivo neural stimulation,”
J. Biomed. Opt., 10
(6), 064003
(2005). https://doi.org/10.1117/1.2121772 Google Scholar
J. Wells,
C. Kao,
P. Konrad,
T. E. Milner,
J. Kim,
A. Mahadevan-Jansen, and
E. D. Jansen,
“Biophysical mechanisms of transient optical stimulation of peripheral nerve,”
Biophys. J., 93
(7), 2567
–2580
(2007). https://doi.org/10.1529/biophysj.107.104786 Google Scholar
Optical-Thermal Response of Laser-Irradiated Tissue, Plenum Press, New York
(1995). Google Scholar
I. Teudt,
A. Nevel,
A. D. Izzo,
J. T. Walsh, and
C.-P. Richter,
“Optical stimulation of the facial nerve: a new monitoring technique,”
Laryngoscope, 117
(9), 1641
–1647
(2007). https://doi.org/10.1097/MLG.0b013e318074ec00 Google Scholar
A. D. Izzo,
E. Suh,
J. Pathria,
D. S. Whitlon,
J. T. Walsh, and
C.-P. Richter,
“Selectivity of neural stimulation in the auditory system: a comparison of optic and electric stimuli,”
J. Biomed. Opt., 12
(2), 021008
(2007). https://doi.org/10.1117/1.2714296 Google Scholar
P. Dallos and
M. A. Cheatham,
“Compound action potential (AP) tuning curves,”
J. Acoust. Soc. Am., 59
(3), 591
–597
(1976). https://doi.org/10.1121/1.380903 Google Scholar
G. Emadi,
C. P. Richter, and
P. Dallos,
“Stiffness of the gerbil basilar membrane: radial and longitudinal variations,”
J. Neurophysiol., 91
(1), 474
–488
(2004). https://doi.org/10.1152/jn.00446.2003 Google Scholar
M. M. Taylor and
C. D. Creelman,
“PEST: Efficient estimates on probability functions,”
J. Acoust. Soc. Am., 41 782
–787
(1967). https://doi.org/10.1121/1.1910407 Google Scholar
A. W. Gummer,
J. W. Smolders, and
R. Klinke,
“Basilar membrane motion in the pigeon measured with the Mossbauer technique,”
Hear. Res., 29
(1), 63
–92
(1987). https://doi.org/10.1016/0378-5955(87)90206-1 Google Scholar
M. Pearce,
C. P. Richter, and
M. A. Cheatham,
“A reconsideration of sound calibration in the mouse,”
J. Neurosci. Methods, 106
(1), 57
–67
(2001). https://doi.org/10.1016/S0165-0270(01)00329-6 Google Scholar
A. D. Izzo,
J. T. Walsh,
H. Ralph,
J. Webb,
M. Bendett,
J. Wells, and
C.-P. Richter,
“Laser stimulation of auditory neurons at shorter pulse durations and penetration depths,”
Biophys. J., 94
(8), 3159
–3166
(2008). https://doi.org/10.1529/biophysj.107.117150 Google Scholar
G. M. Hale and
M. R. Querry,
“Optical constants of water in the 200-nm to 200-μm wavelength range,”
Appl. Opt., 12
(3), 555
–563
(1973). https://doi.org/10.1364/AO.12.000555 Google Scholar
H. F. Rosenberg and
J. T. Gunner,
“Sodium, potassium and water contents of various components (intact, desheathed nerve, and epineurium) of fresh (untreated) medullated (sciatic) nerve of R. ridibunda (and some comparative data on cat sciatic),”
Pflügers Arch., 269
(3), 270
–273
(1959). https://doi.org/10.1007/BF00362930 Google Scholar
M. V. Goycoolea and
L. Lundman,
“Round window membrane. Structure, function and permeability: a review,”
Microsc. Res. Tech., 36 201
–211
(1997). https://doi.org/10.1002/(SICI)1097-0029(19970201)36:3<201::AID-JEMT8>3.0.CO;2-R Google Scholar
C. H. Reinsch,
“Smoothing by spline functions,”
Numer. Math., 10 177
–183
(1967). https://doi.org/10.1007/BF02162161 Google Scholar
M. Müller,
“The cochlear place-frequency map of the adult and developing Mongolian gerbil,”
Hear. Res., 94
(1-2), 148
–156
(1996). https://doi.org/10.1016/0378-5955(95)00230-8 Google Scholar
C.-P. Richter,
R. Edge,
D. Z. He, and
P. Dallos,
“Development of the gerbil inner ear observed in the hemicochlea,”
JARO, 1
(3), 195
–210
(2000). https://doi.org/10.1007/s101620010019 Google Scholar
L. E. Moreno,
S. M. Rajguru,
A. I. Matic,
N. Yerram,
A. M. Robinson,
M. Hwang,
S. Stock, and
C.-P. Richter,
“Infrared neural stimulation: beam path in the guinea pig cochlea,”
Hear. Res., Google Scholar
O. Stakhovskaya,
D. Sridhar,
B. H. Bonham, and
P. A. Leake,
“Frequency map for the human cochlear spiral ganglion: implications for cochlear implants,”
JARO, 8 220
–233
(2007). https://doi.org/10.1007/s10162-007-0076-9 Google Scholar
C.-P. Richter,
S. M. Rajguru,
A. I. Matic,
L. E. Moreno,
A. Fishman,
A. J. Robinson,
E. Suh, and
J. Joseph T Walsh,
“Spread of cochlear excitation during stimulation with optical radiation: Inferior colliculus measurements,”
J. Neural Eng., 8
(5), 056006
(2011). https://doi.org/10.1088/1741-2560/8/5/056006 Google Scholar
T. G. Dolan,
J. H. Mills, and
R. A. Schmiedt,
“A comparison of brainstem, whole-nerve AP and single-fiber tuning curves in the gerbil: Normative data,”
Hear. Res., 17 259
–266
(1985). https://doi.org/10.1016/0378-5955(85)90070-X Google Scholar
K. R. Henry,
J. M. Price, and
R. J. Sweet,
“Hypothermia differentially affects tuning curves generated by forward and simultaneous masking,”
Acta Otolaryngol., 111 842
–847
(1991). https://doi.org/10.3109/00016489109138420 Google Scholar
L. I. Hellstrom and
R. A. Schmiedt,
“Measures of tuning and supression in single-fiber and whole nerve responses in young and quiet-aged gerbils,”
J. Acoust. Soc. Am., 100
(5), 3275
–3285
(1996). https://doi.org/10.1121/1.417211 Google Scholar
C.-P. Richter,
R. Bayon,
A. D. Izzo,
M. Otting,
E. Suh,
S. Goyal,
J. Hotaling, and
J. T. Walsh Jr.,
“Optical stimulation of auditory neurons: effects of acute and chronic deafening,”
Hear. Res., 242
(1-2), 42
–51
(2008). https://doi.org/10.1016/j.heares.2008.01.011 Google Scholar
M. Chatterjee and
R. V. Shannon,
“Forward masked excitation patterns in multielectrode electrical stimulation,”
J. Acoust. Soc. Am., 103 2565
–2572
(1998). https://doi.org/10.1121/1.422777 Google Scholar
D. A. Nelson and
G. S. Donaldson,
“Psychophysical recovery from pulse-train forward masking in electrical hearing,”
J. Acoust. Soc. Am., 112
(6), 2932
–2947
(2002). https://doi.org/10.1121/1.1514935 Google Scholar
C. S. Throckmorton and
L. M. Collins,
“The effect of channel interactions on speech reognition in cochlear implant subjects: Predictions from an acoustic model,”
J. Acoust. Soc. Am., 112
(1), 285
–296
(2002). https://doi.org/10.1121/1.1482073 Google Scholar
C. van den Honert and
P. H. Stypulkowski,
“Single fiber mapping of spatial excitation patterns in the electrically stimulated auditory nerve,”
Hear. Res., 29
(2–3), 195
–206
(1987). https://doi.org/10.1016/0378-5955(87)90167-5 Google Scholar
R. C. Black,
G. M. Clark, and
J. F. Patrick,
“Current distribution measurements within the human cochlea,”
IEEE Trans. Biomed. Eng., 28
(10), 721
–725
(1981). https://doi.org/10.1109/TBME.1981.324668 Google Scholar
B. M. Clopton and
F. A. Spelman,
“Electrode configuration and spread of neural excitation: compartmental models of spiral ganglion cells,”
Ann. Otol. Rhinol. Laryngol. Suppl., 166 115
–118
(1995). Google Scholar
J. A. Bierer and
J. C. Middlebrooks,
“Auditory cortical images of cochlear-implant stimuli: dependence on electrode configuration,”
J. Neurophysiol., 87 478
–492
(2002). https://doi.org/10.1152/jn.00212.2001 Google Scholar
R. L. Snyder,
J. A. Bierer, and
J. C. Middlebrooks,
“Topographic spread of inferior colliculus activation in response to acoustic and intracochlear electric stimulation,”
JARO, 5 305
–322
(2004). https://doi.org/10.1007/s10162-004-4026-5 Google Scholar
J. C. Middlebrooks and
R. L. Snyder,
“Auditory prosthesis with a penetrating nerve array,”
JARO, 8 258
–279
(2007). https://doi.org/10.1007/s10162-007-0070-2 Google Scholar
D. B. Koch,
M. Downing,
M. J. Osberger, and
L. Litvak,
“Using current steering to increase spectral resolution in CII and HiRes 90K users,”
Ear Hear., 28
(2, Supp), 38s
–41s
(2007). https://doi.org/10.1097/AUD.0b013e31803150de Google Scholar
A. D. Izzo,
P. Littlefield,
J. Joseph T Walsh,
J. Webb,
H. Ralph,
M. Bendett,
E. D. Jansen, and
C.-P. Richter,
“Laser stimulation of auditory neurons at high repetition rate,”
Proc. SPIE, 6435 64350R
(2007). https://doi.org/10.1117/12.700846 Google Scholar
S. R. Rajguru,
A. I. Matic,
A. M. Robinson,
A. J. Fishman,
L. E. Moreno,
A. Bradley,
I. Vujanovic,
J. Breen,
J. D. Wells,
M. Bendett, and
C.-P. Richter,
“Optical cochlear implants: evaluation of surgical approach and laser parameters in cats,”
Hear. Res., 269
(1–2), 102
–111
(2010). https://doi.org/10.1016/j.heares.2010.06.021 Google Scholar
|

