|
|
|
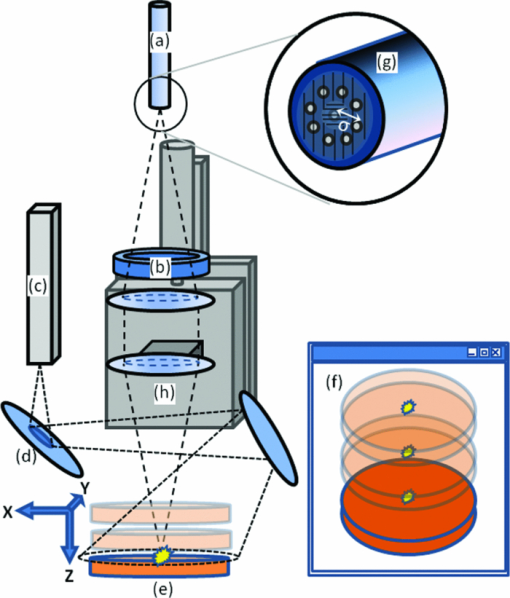
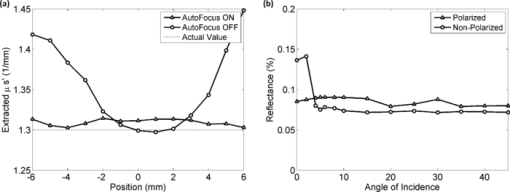
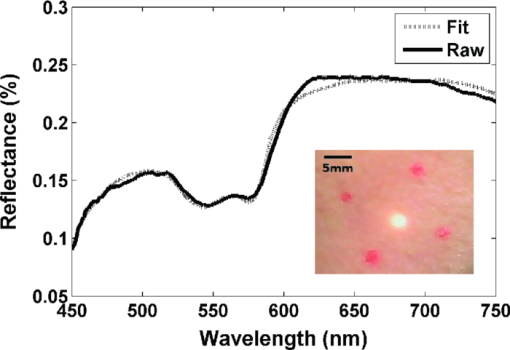
Diffuse optical spectroscopy (DOS) provides a sensitive means to measure the absorption and scattering properties of biological tissues and has been used to diagnose and monitor disease in a number of clinical situations including breast cancer,1 ovarian cancer,2 Barrett's esophagus,3 lung cancer,4 cervical cancer,5 and skin cancer.6 The instrumentation for DOS typically uses a combination of optical fiber probes to deliver and collect light from the tissue surface. The application of a standard optical fiber probe requires applied pressure in order to make contact with the tissue, which has been shown to introduce errors in the extracted optical properties.7 In addition, the distal end of a contact probe can obscure the exact measurement location on the tissue surface. In this paper, we report the development of a handheld noncontact DOS device that removes the effects of probe pressure and documents the measurement site by imaging the distal end of a standard contact fiber probe onto the tissue with lenses. To mitigate the effects of specular reflection and limited depth of focus, we used cross polarization and a custom autofocus mechanism, respectively. We demonstrate the quantitative performance of this device with tissue simulating phantoms and demonstrate its use in measuring the optical properties of human tissue. Figure 1 illustrates the design of the handheld noncontact DOS system. A 6.35-mm diameter steel reflectance probe ferrule used for tissue contact reflectance measurements contains a group of 200 μm (0.22 NA) diameter optical fibers (Fibertech Optica, Kitchener Ontario, Canada). The source and collection fibers are separated by 740 μm, which will be referred to as the source-detector separation (σ). On the ferrule tip, a cross polarizer was cut from pieces of linear polarizing film (Edmund Optics, Barrington, New Jersey) to ensure that the light emitted from the source fiber was orthogonally polarized with respect to the light entering the collection fibers for all visible wavelengths. The ferrule tip was imaged onto the sample surface for a 1-to-1 magnification using two 1 in. diameter achromatic 100 mm lenses (Thorlabs, Newton, New Jersey). The lenses and probe were mechanically stabilized with a 30 mm cage assembly (Thorlabs, Newton, New Jersey). Because the depth of focus is limited to approximately 1 to 4 mm, we employed a custom autofocusing scheme to ensure that the sample surface remained within the image plane. An attached camera (1800 endoscope) is used along with a motorized stage attached to the objective lens as part of the autofocusing feedback mechanism. A tungsten-halogen lamp (LS-1 Ocean Optics, Dunedin, Florida) was used to provide white light illumination, while a spectrometer (USB4000 Ocean Optics) collected reflectance light for post-processing. Integration times for the noncontact probe are approximately 100 ms. Fig. 1Noncontact diffuse optical reflectance probe shown from two angles. (a) Original probe ferrule. (b) Iris limiting the beam aperture to the collimating lens. (c) Compact camera that snaps images of the probing region for reference and streams for the autofocusing scheme. (d) Mirror. (e) Sample to be imaged. (f) Camera's perspective of the sample demonstrating the autofocus calibration scheme. Darker and lighter spots represent higher and lower axial sample positions, respectively. (g) Single illumination, multiple collection ferrule with small polarizers for cross polarization. The “σ” symbol represents the source-detector separation. (h) Servo motor.  The noncontact probe performance was validated using tissue simulating liquid phantoms with 1 μm diameter polystyrene beads (Polysciences, Warrington, Pennsylvania) for scattering and ferrous stabilized hemoglobin for absorption (Sigma-Aldrich, St. Louis, Missouri). In this validation, an array of liquid phantoms was used containing an array of reduced scattering (μs ′) and absorption (μ a). DOS measurements were acquired from all phantoms with the noncontact probe and the reflectance spectra were fit for the optical and physical properties of μ s ′ and hemoglobin concentration ([HbO2]) using an iterative inverse algorithm utilizing a look-up table (LUT) method.8 Cross polarization has no effect on our spectral fitting results since both the phantoms used to generate the LUT and the phantoms used to validate it were all optically probed using the cross polarizing noncontact probe. Without cross polarization, reflectance signals from multiple scattering photons are partially buried underneath that of shallow penetrating photons that are less sensitive to blood absorption. The validation phantom set contained 20 phantoms with reduced scattering coefficients of 0.5, 1, 2, 3, and 4 mm−1, and hemoglobin concentrations of 0 to 3 mg/ml in 1 mg/ml increments. Optical spectra attained with the noncontact probe was fit for μ s ′(λo) (where λo = 630 nm) and [HbO2] with errors of 3.46% and 8.62% for reduced scattering and absorption, respectively, which is comparable to those obtained from contact probes,8, 9 The extracted μ s ′(λo) yielded errors of 7.26%, 2.60%, 3.00%, 1.63%, and 2.81% for 0.5 mm−1, 1 mm−1, 2 mm−1, and 3 mm−1 and 4 mm−1 μ s ′ phantoms, respectively, across all levels of hemoglobin absorption (Fig. 2). Fig. 2Noncontact probe validation. (a) Accuracy of hemoglobin concentration extraction. (b) Accuracy of reduced scattering coefficient extraction over varying levels of hemoglobin absorption. Scattering coefficient [μ s ′(λo)] values extracted from the LUT model: ▸ = 0.5 mm−1, ▲ = 1 mm−1, ◊ = 2 mm−1, ■ = 3 mm−1, ● = 4 mm−1. μ s ′(λo) is diminished with the addition of hemoglobin due to sample dilution. Solid lines represent true values.  The autofocus is based on a system comprised of a camera that images the measurement area, and a servo motor. Due to the oblique imaging angle of the camera, the position of the probe illumination spot within the camera's image field will be sensitive to the axial position of the sample. Conversely, if the camera angle was coincident with the optic axis of the probe, it would be nearly impossible to ascertain the position of the sample because the bright spot would not change from a single position in the field. Once the position of the sample is coded by the position of the bright spot in the camera image, we simply assign the servo motor an axial position that is proportional to the position of the sample surface. Because we wish to keep the sample surface within the depth of field, we performed an experiment to measure this distance with and without autofocus. We set up a z-stage to axially translate a scattering phantom (μ s ′ = 1.3 mm−1) composed of polybead solution through 12 mm while acquiring reflectance measurements at regular intervals. In this manner, the depth of field could be considered the axial distance within which the extracted optical properties achieve errors of less than 10%. The experiment was performed with and without autofocus for comparison. Autofocus validation showed a depth-of-field of approximately 4 and 12 mm (translation stage limited) while the autofocus was off and on, respectively [Fig. 3a]. Fig. 3(a) The noncontact probe depth of field. The beam waist limits the region where extracted reduced scattering accuracy is within low error. (b) Reflectance versus incidence angle for a sample of PDMS with TiO2 scattering agent. Specular reflection causes a sharp increase in signal for incidence angles under 5 deg.  In a clinical situation, specular reflections originating from the diffusely reflective skin surfaces confound the DOS spectra in a way that is not constant from site to site. The degree of surface smoothness will determine the amount of specularly reflected light collected; therefore, it is favorable to eliminate or effectively reduce this signal. To solve this problem, we use polarization-based solutions of reducing specular reflection which relies on the concept that polarized light is depolarized by tissues to a degree that is proportionate to the distribution of refractive indices in the sample.10 To verify the effectiveness of cross polarization, a sample of polydimethylsiloxane (PDMS) with titanium dioxide scattering agent (μ s ′ = 1.4 mm−1) was attached to a vertically aligned rotation stage. This sample was rotated from 0 to 45 deg with respect to the optic axis in 2 deg (from 0 to 10 deg) and 5 deg (10 to 45 deg) increments as reflectance spectra were collected for each angle. Without cross polarization, specular reflection can be seen over any incidence angle under 5 deg. However with cross polarization, there is no noticeable contribution of specular reflection to the reflectance signal throughout the range of incidence angles tested. Since cross polarization rejects specular reflection and single scattering from the outermost epithelium, our reflectance measurements become more sensitive to basal/dermal layer absorption and collagen scattering. Other reported designs rely on an index matching medium between the probe and tissue surface.11 To demonstrate in vivo use of the non-contact probe, a measurement was made on a subject's hand as shown and fit for optical and physiological properties (Fig. 4). This fit took into account oxygen saturation and pigment packaging effects, which are known to be present in biological tissues due to confined volumes of highly concentrated hemoglobin in blood vessels.12 Fitting results yielded a μ s ′(λo) value of 1.32 mm−1, a HbO2 blood volume fraction of 5.57% (assuming 150 mg/ml HbO2 as concentration of whole blood), oxygen saturation value of 0.622, and mean blood vessel diameter of 30 μm. These values are within the normal ranges for skin; however, because we do not know the true values for scattering and absorption, this does not constitute a validation, but instead an in vivo demonstration. Fig. 4Example of a typical skin reflectance measurement with a noncontact probe. Here, the spectra is taken from the back of a subject's hand. The LUT model fit and CCD image of the sampling area are shown. The four red dots on the skin were placed with a marker as a localization reference.  The validation of the noncontact probe as performed in this study was successfully used to show that removing the bare probe from the tissue would not adversely affect performance relative to the original probe. Toward this purpose, 1-μm diameter polystyrene beads were used as a representative scattering agent for tissue due to its size and reproducibility in making phantoms of known reduced scattering. As it relates to the ultimate goal of tissue reflectance measurements, validation should include scatterers of 0.1 to 5 μm in size to account for the relevant distribution of scattering cross sections in tissue. Such a validation is outside of the scope of this letter, but the results of LUT validation across scatterers of various phase functions will be published in the near future. AcknowledgmentsThe funding for this research was provided in part by the National Institutes of Health (Grant Nos. R01CA132032 and R21RR026259) ReferencesN. Shah,
A. E. Cerussi,
D. Jakubowski,
D. Hsiang,
J. Butler, and
B. J. Tromberg,
“The role of diffuse optical spectroscopy in the clinical management of breast cancer,”
Dis. Markers, 19
(2–3), 95
–105
(2003). Google Scholar
U. Utzinger,
M. Brewer,
E. Silva,
D. Gershenson,
R. C. Blast,
M. Follen, and
R. Richards-Kortum,
“Reflectance spectroscopy for in vivo characterization of ovarian tissue,”
Lasers Surg. Med., 28
(1), 56
–66
(2001). https://doi.org/10.1002/1096-9101(2001)28:1<56::AID-LSM1017>3.0.CO;2-L Google Scholar
I. Georgakoudi,
B. C. Jacobson,
J. Van Dam,
V. Backman,
M. B. Wallace,
M. G. Muller,
Q. Zhang,
K. Badizadegan,
D. Sun,
G. A. Thomas,
L. T. Perelman, and
M. S. Feld,
“Fluorescence, reflectance, and light-scattering spectroscopy for evaluating dysplasia in patients with Barrett's esophagus,”
Gastroenterology, 120
(7), 1620
–1629
(2001). https://doi.org/10.1053/gast.2001.24842 Google Scholar
S. C. Kanick,
C. van der Leest,
J. G. J. V. Aerts,
H. C. Hoogsteden,
S. Kascakova,
H. J. C. M. Sterenborg, and
A. Amelink,
“Integration of single-fiber reflectance spectroscopy into ultrasound-guided endoscopic lung cancer staging of mediastinal lymph nodes,”
J. Biomed. Opt., 15 017004
(2010). https://doi.org/10.1117/1.3290822 Google Scholar
J. A. Freeberg,
D. M. Serachitopol,
N. McKinnon,
R. Price,
E. N. Atkinson,
D. D. Cox,
C. MacAulay,
R. Richards-Korturn, and
M. Follen,
“Fluorescence and reflectance device variability throughout the progression of a phase II clinical trial to detect and screen for cervical neoplasia using a fiber optic probe,”
J. Biomed. Opt., 12 034015
(2007). https://doi.org/10.1117/1.2750332 Google Scholar
N. Rajaram,
J. S. Reichenberg,
M. R. Migden,
T. H. Nguyen, and
J. W. Tunnell,
“Pilot clinical study for quantitative spectral diagnosis of non-melanoma skin cancer,”
Lasers Surg. Med., 42
(10), 716
–727
(2010). https://doi.org/10.1002/lsm.21009 Google Scholar
L. A. Lim,
B. Nichols,
N. Rajaram, and
J. W. Tunnell,
“Probe pressure effects on human skin diffuse reflectance and fluorescence spectroscopy measurements,”
J. Biomed. Opt., 16 011012
(2011). https://doi.org/10.1117/1.3525288 Google Scholar
N. Rajaram,
T. H. Nguyen, and
J. W. Tunnell,
“Lookup table-based inverse model for determining optical properties of turbid media,”
J. Biomed. Opt., 13 050501
(2008). https://doi.org/10.1117/1.2981797 Google Scholar
B. Yu,
J. Y. Lo,
T. F. Kuech,
G. M. Palmer,
J. E. Bender, and
N. Ramanujam,
“Cost-effective diffuse reflectance spectroscopy device for quantifying tissue absorption and scattering in vivo,”
J. Biomed. Opt., 13 060505
(2008). https://doi.org/10.1117/1.3041500 Google Scholar
X. Li,
A. Taflove, and
V. Backman,
“Quantitative analysis of depolarization of backscattered light by stochastically inhomogeneous dielectric particles,”
Opt. Lett., 30
(8), 902
–904
(2005). https://doi.org/10.1364/OL.30.000902 Google Scholar
R. A. Schwarz,
W. Gao,
D. Daye,
M. D. Williams,
R. Richards-Kortum, and
A. M. Gillenwater,
“Autofluorescence and diffuse reflectance spectroscopy of oral epithelial tissue using a depth-sensitive fiber-optic probe,”
Appl. Opt., 47
(6), 825
–834
(2008). https://doi.org/10.1364/AO.47.000825 Google Scholar
R. L. P. Van Veen,
W. Verkruysse, and
H. Sterenborg,
“Diffuse-reflectance spectroscopy from 500 to 1060 nm by correction for inhomogeneously distributed absorbers,”
Opt. Lett., 27
(4), 246
–248
(2002). https://doi.org/10.1364/OL.27.000246 Google Scholar
|


