
|
|
|
Shear stress has been recognized as one of the biophysical methods by which to permeabilize plasma membranes of cells.1 In particular, high pressure transient hydrodynamic flows related to cavitation dynamics resulting from laser-induced breakdown have been shown to lead to the uptake of fluorophores2 and plasmid DNA.3 Laser-induced breakdown (LIB) causes a rapid temperature and pressure increase within the plasma followed by the expansion of a cavitation bubble accompanied by a high pressure hydrodynamic flow. During the collapse phase, a bubble close to the substrate forms hydrodynamic jets toward the surface. The subsequent outward flow along the surface collides with the inward moving bubble wall,4 which results in complex flow fields around the bubble. While the mechanism and dynamics of cavitation have been extensively studied using a variety of time-resolved imaging techniques, the cellular response to the cavitation bubble and cavitation induced transient hydrodynamic flows has never been shown in detail. In the past, time-resolved stroboscopic brightfield imaging with nanosecond temporal resolution was used to visualize the lysis zone and cellular deformation under the bubble.5 It was shown that the hydrodynamic shear flow from the expanding bubble is the main factor in cell deformation.6 The extent of cell lysis and molecular injection zones were quantitatively related to the laser parameters and the created hydrodynamic pressure.2 In a similar manner, brightfield stroboscopic imaging has been employed to visualize cavitation dynamics in a microfluidics channel7 and in the rat cornea.8 Also, a fast camera with microsecond temporal resolution was used to quantify red blood cell deformation induced by LIB of water.9 In all these studies, based on brightfield microscopy, the acquired images displayed only the deformation of the cell outline without any more detailed and quantifiable information about the actual changes within the cell's cytoplasm. Stroboscopic pulsed interferometry, realized both with femtosecond and nanosecond lasers, has been previously used to study fast transient processes in various materials upon laser irradiation10 and ablation.11, 12 Typically, only a single interferogram at a predefined time delay is acquired, although a multiexposure modification was also proposed.13 To our knowledge, stroboscopic interferometry or quantitative phase imaging (QPI) has never been used to study fast transient processes in live cells or tissues. In this letter, for the first time we employ stroboscopic QPI to gain a better insight into the transient cellular deformation under conditions of shear stress. We recently proposed a new technique to create localized cavitation bubbles3 that can be used to permeabilize the cellular membrane and introduce plasmid DNA into a small population of surrounding cells. In this approach, a nanosecond laser is focused onto a single nanoparticle held in close proximity to the cells of interest. The breakdown threshold energy is significantly decreased when compared to the LIB of a liquid, providing a more controllable and confined cavitation. The total energy of the system is several orders of magnitude lower than that breakdown of water leading to a lower magnitude of hydrodynamic shear stress. As a result, no cell lysis zone is observed, with the majority of cells remaining viable. This makes this technique particularly suitable for single cell studies. In this experiment a 400 nm polystyrene nanoparticle was optically trapped 15 μm above the substrate and ablated by a focused single pulse from a 532 nm Nd:YAG laser (pulse width ∼1 ns, energy ∼1 μJ) as shown in Fig. 1 and described in detail in Ref. 3. QPI was realized in a typical fiber-based off-axis digital holography microscopy (DHM) setup.14 For time lapse recordings, light from a 635 nm CW laser diode was coupled into a single mode optical fiber splitter. Alternatively, in the microsecond stroboscopic imaging a second identical 532 nm Nd:YAG laser was used in place of the CW laser diode. In that case both nanosecond lasers were triggered by a delay pulse generator (Directed Energy, Inc., PDG-2515) where the illumination laser was triggered at a desired time delay (50 ns to 20 μs) after the LIB event. Off-axis holograms were recorded by a CCD camera (Imaging Source, DMK31BU03) running either at the full frame rate of 25 fps or triggered for single frame stroboscopic imaging. In the latter case, one stroboscopic hologram was captured for each triggered LIB event. In addition, a hologram was acquired 1 s before and after the breakdown event. The complex wavefront in the object plane was reconstructed from the off-axis holograms using a Fourier space filtering technique either in real time using LABVIEW or in MATLAB post-processing. When necessary, the reconstructed phase was unwrapped and the quadratic curvature of the background was fitted and subtracted. Fig. 1Experimental setup. For a detailed description see text and Ref. 3. LIB and trapping beams are coupled into the microscope using dichroic mirrors. MO is a 100×1.25NA/Oil NIKON microscope objective. 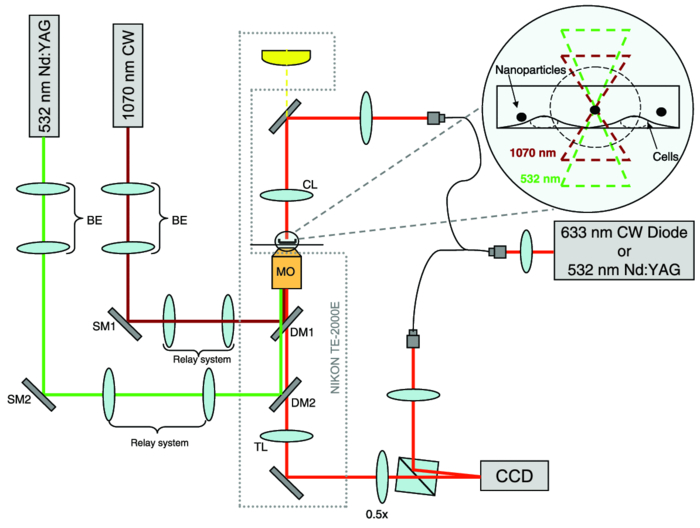 CHO-K1 cells were seeded onto glass-bottomed Petri dishes 48 h prior to experiments and incubated at 37 °C and with 5% CO2 to assure complete cell attachment. For the experiment the culture medium was replaced with OptiMEM® (Invitrogen) containing nanoparticles. Figure 2 shows three typical reactions of cells observed over a few minutes after the LIB of a trapped nanoparticle. In contrast to the previous study with the LIB of a liquid,5 we observed no cell lysis in the vicinity of a cavitation bubble. This can be attributed to the lower breakdown threshold of the nanoparticle, which in turn leads to a less violent cavitation event; hence, a lower hydrodynamic pressure is created in the system. The most common response is the initial mechanical displacement of the part of the cell facing the cavitation bubble by a few micrometers away from the center of cavitation as shown in Fig. 2b (the dark pattern in the phase difference map). Typically, over the time of a few seconds, cells start to retract further and round up in response to the transient stress as shown by the frames taken at 1 and 2 min after the LIB event. This is also clearly visible in the time trace of the area of the cell [Fig. 2e]. Interestingly, in some cases the stress response starts to be well pronounced after 1 to 2 s even when no initial noticeable cell deformation or displacement can be observed immediately after the LIB [Figs. 2f, 2g, 2h, 2i, 2j]. This suggests a more subtle and transient form of cell interaction with the expanding bubble and hydrodynamic flow. Comparison of the changes in optical thickness [Figs. 2b, 2c, 2d, 2g, 2h, 2i], as well as time traces of cell area [Figs. 2e, 2j] clearly show that the side of the cell facing the hydrodynamic flow is being quickly retracted and the cytoplasm from this part is transported toward the center of the cell leading to a gradual increase in thickness. At the same time no change in the cell footprint is observed in areas not directly facing the direction of the shear stress. Importantly, no or minimal loss of total optical thickness, which is proportional to the total cellular dry mass,15 is observed in these two cases [Figs. 2e, 2j]. Fig. 2Three examples of typical cellular reactions to transient shear stress. LIB sites are marked with ‘x’. (a), (f), and (k) show phase maps while all other images show the difference in phase between a given moment and the state before. Time traces in (e), (j), and (o) show the respective cellular dry mass (red, dashed) and area (blue, solid) normalized to the state before LIB. Video 1, Video 2, and Video 3 show the temporal changes in phase maps of cells in (a), (f), and (k), respectively. LIB occurs at time T = 0. All phase maps in radians. Scale bar 20 μm common to all figures. Video 1 (QuickTime, 2.8 MB); Video 2 (QuickTime, 2.8 MB)  In rare cases a significant gradual loss of dry mass is observed as shown in Figs. 2k, 2l, 2m, 2n, 2o. This type of response strongly correlates with appearance of long lasting (<0.5 s) residual gas bubbles on the cellular membrane [Fig. 2l], which most probably cause an irreparable damage and loss of dry mass [Fig. 2o]. Interestingly, these bubbles do not appear in all cases. Moreover, they are typically localized on the cell membrane rather than in the center of cavitation. The formation of residual gas bubbles was also previously reported by Rau following the LIB of a liquid.6 The time-resolved stroboscopic DHM also enables a direct measurement of the evolution of the cavitation. The produced cavitation bubbles had a typical maximum radius of r ≈ 35 μm with a lifetime of t ≈ 12 μs. Using the numerical model proposed in Ref. 6, we can estimate the maximum shear stress related to the radial hydrodynamic flow to be on the order of 10 to 100 kPa. Figure 3 shows quantitative phase maps of the transient deformation of cells at 3 μs [Figs. 3a, 3b, 3c] and 15 μs [Figs. 3d, 3e, 3f] after the LIB of a nanoparticle. In the first case the bubble is in an expansion phase with the hydrodynamic flow directed away from the bubble. Figure 3b shows that the hydrodynamic flow caused by the expanding bubble exerts enough shear stress to push the cell bodies away from the cavitation center with a typical displacement of 2 to 5 μm visible in the profiles in Fig. 3c. Noticeably, these profiles also show that the optical thickness of the cell near the edge exposed to the flow is reduced by upto 80%, indicating that most of the cytoplasm is pushed toward the inside of the cell. Figure 3e shows cells 15 μs after the LIB, in which case the cavitation bubble has fully collapsed. Noticeably, the cells are still deformed, and cell 1 [in Fig. 3e] close to the cavitation center is still pushed away while cell 2 at a larger distance from the center, is pulled toward it. This reveals for the first time that the hydrodynamic flow fields cause the cells to move back and forth during the bubble's expansion and collapse, which can enhance intracellular movement and related stress. As a result, the cells experience a shear stress not only on the membrane but also within the cytoplasm. Importantly, in both cases all the cells return to their initial positions with no change in the footprint or optical thickness 1 s after the LIB event. This indicates that in some cases the produced shear stress from the LIB of a nanoparticle does not affect the adherence of the cells to the substrate. This observation is consistent with the delayed cellular response without any initial deformation shown in Figs. 2f, 2g, 2h, 2i, 2j. Fig. 3Phase maps of cellular deformation during bubble expansion (b) and right after collapse (e). LIB sites are marked with ‘x’. (a) and (d) show phase maps before LIB while (b) and (e) show the difference in phase between a given moment after LIB and the state before. Profiles in (c) and (f) show the cross-section through corresponding phase maps along dashed lines shown in (a) and (d), respectively: the state before (black, solid), during cavitation (blue, dashed), 1 s after (green, dotted); red dash-dotted curves show the difference between the phase map during and before cavitation. All phase maps in radians. Scale bar 40 μm common to all figures. Due to strong light scattering in the area of cavitation bubble, correct reconstruction of the phase map in this region was not possible in (b).  Our findings revealed that both the cavitation bubble and the related hydrodynamic flow exert a considerable shear stress on the cell body leading to transient cytoplasm deformation. For the first time a bi-directional cytoplasm displacement was observed during expansion and collapse of the cavitation bubble. We believe that the presented observations give a valuable insight into cell deformation and reaction to transient external shear stress. The stroboscopic phase images suggest that the mechanism responsible for cellular membrane permeabilization and the previously reported plasmid DNA transfection3 is most probably a combination of a direct interaction with the expanding bubble for the first row of cells and with the transient hydrodynamic flow elsewhere. The presented stroboscopic holographic technique in combination with the creation of controllable cavitation bubbles can be used in further single cell quantitative studies. These may explore cellular elastic deformation under transient shear stress, providing a better understanding of the viscous and elastic properties of adherent cells. AcknowledgmentsWe thank the Scottish Universities Life Sciences Alliance (SULSA) and the UK Engineering and Physical Sciences Research Council (EPSRC) for funding. K.D. is a Royal Society Wolfson-Merit Award Holder. M.A. acknowledges the support of an EPSRC funded University of St Andrews Rising Star fellowship. ReferencesC.-D. Ohl,
M. Arora,
R. Ikink,
N. de Jong,
M. Versluis,
M. Delius, and
D. Lohse,
“Sonoporation from jetting cavitation bubbles,”
Biophys. J., 91
(11), 4285
–4295
(2006). https://doi.org/10.1529/biophysj.105.075366 Google Scholar
A. N. Hellman,
K. R. Rau,
H. H. Yoon, and
V. Venugopalan,
“Biophysical response to pulsed laser microbeam-induced cell lysis and molecular delivery,”
J. Biophotonics, 1
(1), 24
–35
(2008). https://doi.org/10.1002/jbio.200710010 Google Scholar
Y. Arita,
M. L. Torres-Mapa,
W. M. Lee,
T. Cizmar,
P. Campbell,
F. J. Gunn-Moore, and
K. Dholakia,
“Spatially optimized gene transfection by laser-induced breakdown of optically trapped nanoparticles,”
Appl. Phys. Lett., 98
(9), 093702
(2011). https://doi.org/10.1063/1.3554415 Google Scholar
Y. Tomita and
A. Shima,
“Mechanisms of impulsive pressure generation and damage pit formation by bubble collapse,”
J. Fluid Mech., 169 535
–564
(1986). https://doi.org/10.1017/S0022112086000745 Google Scholar
K. R. Rau,
A. Guerra,
A. Vogel, and
V. Venugopalan,
“Investigation of laser-induced cell lysis using time-resolved imaging,”
Appl. Phys. Lett., 84
(15), 2940
–2942
(2004). https://doi.org/10.1063/1.1705728 Google Scholar
K. R. Rau,
P. A. Quinto-Su,
A. N. Hellman, and
V. Venugopalan,
“Pulsed laser microbeam-induced cell lysis: time-resolved imaging and analysis of hydrodynamic effects,”
Biophys. J., 91
(1), 317
–329
(2006). https://doi.org/10.1529/biophysj.105.079921 Google Scholar
P. A. Quinto-Su,
H. H. Lai,
H. H. Yoon,
C. E. Sims,
N. L. Allbritton, and
V. Venugopalan,
“Examination of laser microbeam cell lysis in a PDMS microfluidic channel using time-resolved imaging,”
Lab. Chip, 8
(3), 408
–414
(2008). https://doi.org/10.1039/b715708h Google Scholar
A. V. Cherian and
K. R. Rau,
“Pulsed-laser-induced damage in rat corneas: time-resolved imaging of physical effects and acute biological response,”
J. Biomed. Opt., 13
(2), 024009
(2008). https://doi.org/10.1117/1.2907214 Google Scholar
P. A. Quinto-Su,
C. Kuss,
P. R. Preiser, and
C. D. Ohl,
“Red blood cell rheology using single controlled laser-induced cavitation bubbles,”
Lab. Chip, 11
(4), 672
–678
(2011). https://doi.org/10.1039/c0lc00182a Google Scholar
V. V. Temnov,
K. Sokolowski-Tinten,
P. Zhou, and
D. von der Linde,
“Ultrafast imaging interferometry at femtosecond-laser-excited surfaces,”
J. Opt. Soc. Am. B, 23
(9), 1954
–1964
(2006). https://doi.org/10.1364/JOSAB.23.001954 Google Scholar
H. Furutani,
H. Fukumura, and
H. Masuhara,
“Nanosecond time-resolved interferometric study on morphological dynamics of doped poly(methyl methacrylate) film upon laser-ablation,”
Appl. Phys. Lett., 65
(26), 3413
–3415
(1994). https://doi.org/10.1063/1.112409 Google Scholar
T. Balciunas,
A. Melninkaitis,
G. Tamosauskas, and
V. Sirutkaitis,
“Time-resolved off-axis digital holography for characterization of ultrafast phenomena in water,”
Opt. Lett., 33
(1), 58
–60
(2008). https://doi.org/10.1364/OL.33.000058 Google Scholar
Z. W. Liu,
M. Centurion,
G. Panotopoulos,
J. Hong, and
D. Psaltis,
“Holographic recording of fast events on a CCD camera,”
Opt. Lett., 27
(1), 22
–24
(2002). https://doi.org/10.1364/OL.27.000022 Google Scholar
M. Antkowiak,
M. L. Torres-Mapa,
K. Dholakia, and
F. J. Gunn-Moore,
“Quantitative phase study of the dynamic cellular response in femtosecond laser photoporation,”
Biomed. Opt. Express, 1
(2), 414
–424
(2010). https://doi.org/10.1364/BOE.1.000414 Google Scholar
G. Popescu,
Y. Park,
N. Lue,
C. Best-Popescu,
L. Deflores,
R. R. Dasari,
M. S. Feld, and
K. Badizadegan,
“Optical imaging of cell mass and growth dynamics,”
Am. J. Physiol. Cell Physiol., 295
(2), C538
–C544
(2008). https://doi.org/10.1152/ajpcell.00121.2008 Google Scholar
|


