|
|
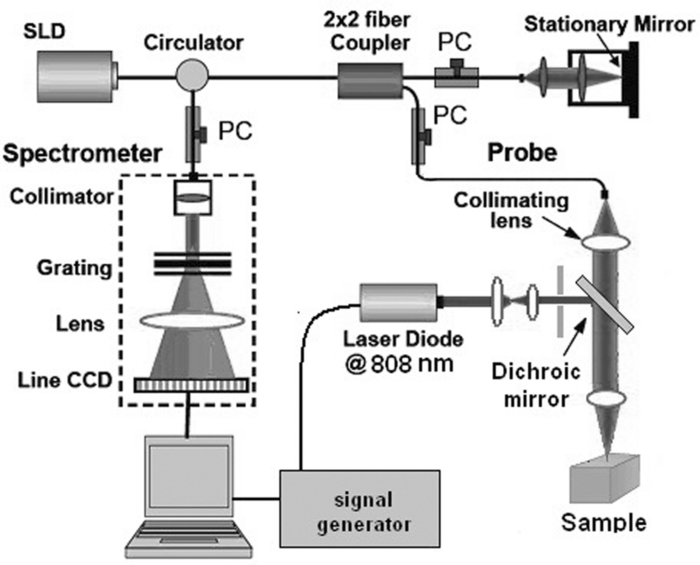
1.IntroductionNoninvasive measurements of the concentration distributions of endogenous (i.e., oxyhemoglobin and deoxyhemoglobin) and exogenous (i.e., chemotherapy and photodynamic therapy) agents in biological tissues may have implications in diagnosing, monitoring, and treating several diseases, such as cancer.1, 2 Several methods have previously been used to determine noninvasively the drug concentration inside biological tissues. These methods include fluorescence,3, 4, 5, 6 reflectance spectroscopy,7, 8 and optical coherence tomography (OCT).9, 10 Optical coherence tomography is an emerging imaging modality that provides a noncontact and noninvasive method of obtaining high spatial resolution three-dimensional images of biological tissues.11, 12, 13 OCT signal detection relies on the intensity of the light backscattered from biological tissues. Phase-sensitive OCT (PhS-OCT)14, 15, 16 is a variation of the OCT system, which allows the detection of optical path length (OPL) changes that are smaller than a wavelength of light. PhS-OCT has previously been used for elastography,17 and for determining nanoscale tissue motion such as in the organ of Corti.18Optically absorbing drugs can absorb light energy from an excitation laser, and convert it into heat. This phenomenon is known as a photothermal effect. The increase in temperature by the drug will change the index of refraction of the surrounding tissue and induce thermal expansion; which changes the OPL of light. If the increase in temperature is high enough, it can also have therapeutic effects.19 Photothermal OCT (PT-OCT) is a new system that combines a PhS-OCT system with a pump-laser. The pump laser light heats the optically absorbing agent and the PhS-OCT detects the OPL changes. The OPL changes on biological tissues will depend on the concentration of the optically absorbing drug. PT-OCT has previously been used in different configurations such as low coherence interferometry,20 using a swept-source PhS-OCT beam,21 using two pump laser wavelengths,22 or having a pump laser located on the opposite side as the PhS-OCT beam.22, 23 Illuminating the sample from the opposite side of the PhS-OCT beam limits the thickness of the sample for which images can be obtained. Most PT-OCT experiments have been carried out in liquid phantoms such as dyes,24 hemoglobin,22 and nanoparticles.21 It is difficult to obtain an accurate phase signal within a liquid due to the Brownian motion of the scattering centers. Therefore, these techniques have been limited to measuring the phase signal at the interface of the liquid. Models for the increase in temperature due to the pump laser have previously been derived;21, 24 however, experimental measurements of the temperature change have been challenging to obtain at different depths. Measurement of the average temperature change of a whole volume has been previously obtained experimentally.25 Applications of photothermal OCT include obtaining phase signal in ex vivo human breast tissues using gold nanoshells,26 obtaining images for targeted molecules in cell cultures,27 determining the concentration of nanoparticles inside sentinel lymph nodes based on a calibration phantom,28 and estimating the concentration of nanorose in thin samples of rabbit arteries.23 In this paper we provide a model that describes the OPL change due to the increase of temperature from a photothermal compound. We demonstrate experimentally the phase (and optical path length) accumulation as a function of depth in homogeneous solid gel phantoms, and use the experimental results to determine the model coefficients. Finally, we validate the model by reconstructing the photothermal compound concentration in single and double layer solid gel phantoms. To our knowledge this is the first demonstration of using a PT-OCT model to reconstruct optically absorbing compound concentrations as a function of depth. The model is used in thick tissue samples (up to 1 mm) and high resolution images are obtained. The design of the system has a pump laser and PS-OCT beam located on the same side, which does not limit the thickness of the tissue sample. 2.Materials and Methods2.1.Photothermal Optical Coherence Tomography SystemA photothermal optical coherence tomography system that consists of a pump laser integrated with a phase sensitive spectral domain optical coherence tomography system has been designed. A superluminecent diode (SLD, Denselight Ltd.) with a central wavelength of 1310 nm and a spectral bandwidth of 56 nm was used as a light source for the OCT system. The light source provides an axial image resolution of ∼13 μm in air. The light from the SLD was coupled into a fiber-based Michelson interferometer via an optical circulator. The light is then split 50/50 through a fiber coupler, where one arm of light was directed toward a stationary mirror in the reference arm, and the other arm was coupled with an 808 nm pump laser, which was collimated by a telescopic system, via a dichroic mirror. The pump laser was modulated with a square wave signal generator and a 50% duty cycle. A lateral resolution of ∼16 μm for the 1310 nm laser is achieved by using a 50 mm focal length objective lens. The beam size of the pump laser was reshaped by using telescopic lenses and an iris. The reflected light from the reference arm and the backscattered light from the sample arm were sent to a home-built high speed spectrometer which is capable of detecting the interference pattern. The spectrometer consisted of a 30 mm focal length collimator, a 1200 lines/mm transmission grating, a 100 mm focal length achromatic lens, and a 14-bit, 1024 pixel InGaAs line scan camera with a maximum acquisition rate of ∼47 kHz. The spectral resolution of the designed spectrometer was 0.141 nm, which provided an imaging depth of ∼3 mm on each side of the zero-delay line in air. The zero-delay line on the sample was set to be ∼0.5 mm above the focal plane. A one-dimensional micropositioning stage was adopted to move the sample in one direction to obtain a cross-sectional image. The system is illustrated in Fig. 1. 2.2.Phantom PreparationSolid gel tissue phantoms that absorb and scatter light were produced to simulate biological tissues. The phantoms contained water and agar (Fisher Scientific) at a concentration of 2 grms/100 ml to produce a solid gel. Agar is known to have very low scattering and absorption properties. Milk29, 30 was used to provide a scattering background, and black India ink29, 31, 32 (Bombay BlackTM, Dr. Ph. Martin's) was used to control the absorption properties of the phantom. When the India ink absorbs light its temperature increases, known as a photothermal effect. The wavelength dependent extinction coefficient of India ink was measured using a spectrophotometer, and its absorption spectrum, normalized at 808 nm, is shown in Fig. 3a. Fig. 3(a) Absorption spectra of black India ink normalized at 808 nm. (b) FFT amplitude of the phase at different depths for phantoms with different ink concentrations. (c) Mean and standard deviation of the slope of the curve a for different ink concentrations with 1% milk and laser power of 50.8 mW. (d) Mean and standard deviation of the slope of the curve a for different laser powers with 1.5% ink and 1% milk. 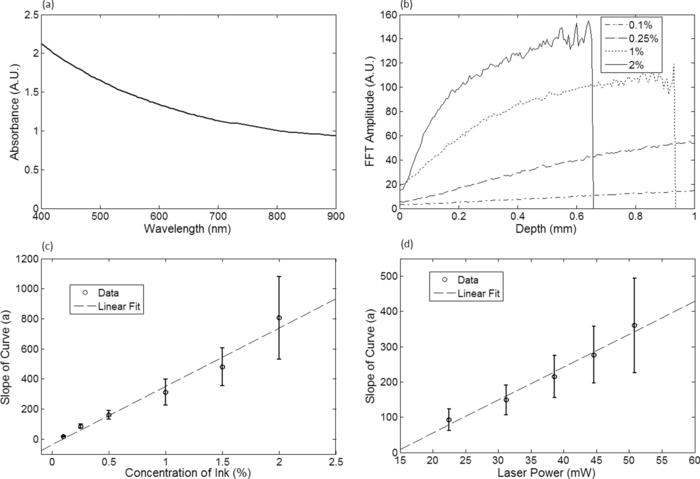 Solid phantoms were created by heating the agar and water solution in a microwave for 1 min. Then, milk and ink were added at the appropriate concentrations, and the liquid was poured in a mold that produced phantoms with a 1-mm thickness. The bottom of the phantom was in contact with a glass slide and the top of the phantom was in contact with a glass cover which has a thickness of ∼225 μm. The phantom solidified within a few minutes. Double layer phantoms were created in two steps. First, the bottom layer was created as previously described for the single layer phantom, but instead of using a glass cover on the top surface, we used a plastic film (saran wrap) which has a thickness of ∼40 μm. The top layer phantom was prepared by heating the agar and water solution in the microwave for 1 min and then mixing in the milk and ink at the appropriate concentrations. The solution was poured over the saran wrap after the bottom layer had solidified, and a mold was used to produce a layer with a thickness of ∼225 μm. The top layer solidified within a few minutes and the top surface was bound by a glass cover. The glass cover placed on the top of the phantom was used as a mold to produce a flat top surface. The cover also prevented evaporated water from escaping and drying the phantom while it was heated by the pump laser. Although the phantoms were bounded on the top and bottom, they were not bounded on the sides. For the double layer phantoms, we placed a plastic film in between the layers. This plastic film was used to avoid ink diffusion between both layers. The plastic film attenuated the laser light by less than 10%, which was considered acceptable for this study. 2.3.Data Acquisition and ProcessingPhotothermal images were obtained by modulating the pump laser at 400 Hz with a square wave (50% duty cycle), and obtaining 1000 A-lines from the same location (also known as an M-scan) at a frequency of 8.717 kHz. It took 115 ms to obtain an M-scan. Figure 2a shows an example of the OCT structural image of an M-scan obtained from a homogeneous solid gel phantom that contain 1% milk and 1.5% ink. The bright spots identify the location of the scattering particles in the tissue at different depths. It can be noted that because we are using solid phantoms, the scattering signal remains constant through time as observed by the horizontal lines in the image. Fig. 2(a) M-scan structure image from a phantom that has a 1.5% concentration of India ink. (b) M-scan of the phase difference obtained from the phantom. (c) Phase difference as a function of time at a depth of 530 μm below the tissue surface [arrow in (b)]. (d) Absolute value of the Fourier transform of the phase difference (c).  At the depth locations where the scattering signal was greater than a predefined threshold value (10 dB above the noise floor), we calculated the phase change between the first and all the other A-lines within an M-scan set (ϕi − ϕ1), where i is a value between 1 and 1000 and ϕ is the phase of the A-line at a specific depth. We can observe that the phase changes at each depth in Fig. 2b. The image presents two interesting characteristics. First, we can see the dark and light bands through time. These bands have a frequency of 400 Hz which is due to the modulation of the pump laser. The second characteristic is that the intensity of the dark and light patches increases through depth. This is due to the phase accumulation which will be discussed in Sec. 2.4. All the data collected in this paper did not contain phase wrapping limitations. Figure 2c shows the phase change through time at a depth of 530 μm from the tissue surface [the depth location is identified with an arrow in Fig. 2b]. Finally, Fig. 2d presents the fast-Fourier transform of the phase difference [FFT(Δϕ)]. A peak at 400 Hz is clearly observed. The amplitude of this peak at each depth, after subtracting the background noise, is used to create the phase image. 2.4.Theoretical ModelThe OPL is defined as the product of the geometric length of the path of light undergoing through a system (L) times the index of refraction of the medium through which it propagates (n): Eq. 1[TeX:] \documentclass[12pt]{minimal}\begin{document}\begin{equation} {\rm OPL}\left({T_0 } \right) = \int_0^L {n\left({T_0 } \right)dl = n\left({T_0 } \right)L}. \end{equation}\end{document}Eq. 2[TeX:] \documentclass[12pt]{minimal}\begin{document}\begin{equation} n\left({T_0 + \Delta T} \right) = n\left({T_0 } \right) + \frac{{dn}}{{dT}}\Delta T, \end{equation}\end{document}Eq. 3[TeX:] \documentclass[12pt]{minimal}\begin{document}\begin{equation} L\left({T_0 + \Delta T} \right) = \left({1 + \beta \Delta T} \right)L\left({T_0 } \right), \end{equation}\end{document}Eq. 4[TeX:] \documentclass[12pt]{minimal}\begin{document}\begin{equation} {\rm OPL}\left({T_0 + \Delta T} \right) = \int_0^L {\left[ {n\left({T_0 } \right) + \frac{{dn}}{{dT}}\Delta T} \right]} \cdot \left({1 + \beta \Delta T} \right)dl. \end{equation}\end{document}Eq. 5[TeX:] \documentclass[12pt]{minimal}\begin{document}\begin{equation} \Delta T = \alpha e^{ - \mu _t l}, \end{equation}\end{document}Eq. 6[TeX:] \documentclass[12pt]{minimal}\begin{document}\begin{eqnarray} \Delta {\text{\it OPL}} &=& {\text{\it OPL}} ({T_0 + \Delta T}) - {\text{\it OPL}} ({T_0 }) \nonumber\\ \displaystyle &=&\int_0^L {\left\{ {\left[ {\frac{{dn}}{{dT}} + n\left({T_0 } \right)\beta } \right]\alpha e^{ - \mu _t l} + \frac{{dn}}{{dT}}\beta \alpha ^2 e^{ - 2\mu _t l} } \right\}} \nonumber\\ \displaystyle dl &=& \left[ {\frac{{dn}}{{dT}} + n\left(T \right)\beta } \right]\frac{\alpha }{{\mu _t }} ({1 - e^{ - \mu _t L} }) \nonumber\\ &&+ \frac{{dn}}{{dT}}\beta \frac{{\alpha ^2 }}{{2\mu _t }} ({1 - e^{ - 2\mu _t L} }). \end{eqnarray}\end{document}Eq. 7[TeX:] \documentclass[12pt]{minimal}\begin{document}\begin{equation} \Delta \phi = \frac{{4\pi \Delta {\text{\it OPL}}}}{{\lambda _0 }}. \end{equation}\end{document}Eq. 8[TeX:] \documentclass[12pt]{minimal}\begin{document}\begin{equation} \Delta {\text {\it OPL}} \approx \frac{{a'}}{{\mu _t }}({1 - e^{ - \mu _t L} }) \to {\rm FFT}\left({\Delta \phi } \right) \approx \frac{a}{{\mu _t }} ({1 - e^{ - \mu _t L} }), \end{equation}\end{document}For small values of the product of the attenuation coefficient times the path length, we can linearize the equation to: Eq. 9[TeX:] \documentclass[12pt]{minimal}\begin{document}\begin{equation} \Delta {\text {\it OPL}} \approx a'L \to {\rm FFT}\left({\Delta \phi } \right) \approx aL. \end{equation}\end{document}The development of this model assumes that the beam of the pump laser is collimated; however, experimentally the system developed has a focused beam with a large Rayleigh length (∼1.28 mm). 3.Results3.1.Photothermal Signal as a Function of the Absorber ConcentrationTo understand the photothermal signal as a function of depth for different absorber concentrations, we created six homogeneous single layer phantoms. Each phantom had the same scattering properties and different absorption properties. Milk was added to each phantom at a concentration of 1% to produce a scattering background similar to what is found in biological tissues. India ink was added as the absorber in each phantom at a concentration of 0.1, 0.25, 0.5, 1, 1.5, or 2%. The pump laser had a power of 50.8 mW at the sample. For each phantom a phase image (B-scan) was obtained, which contained 200 A-lines (lateral positions) separated by a distance of 15 μm. The phase image A-line was calculated by obtaining the amplitude of the fast-Fourier transform of the phase difference of the M-scan at each depth as previously described in Sec. 2.3. Since the phantoms are homogeneous in the lateral direction (and the surface of the phantom is flat), the 200 A-lines of the phase image of each phantom were averaged at each depth, to minimize the noise. Figure 3b shows examples of the averaged phase FFT amplitude signal as a function of depth. At higher ink concentrations (which also contain a higher μ t value) the curve presents an exponential shape; however, for smaller ink concentrations, the shape of the curve is linear. This is expected as described by Eqs. 8, 9. Also, the higher the attenuation coefficient, the less signal is obtained from deeper tissue structures; which explains why the 1% and 2% ink curves have signal up to a depth of ∼0.95 and ∼0.65 mm, respectively. Each of the 200 individual A-lines from each phantom was fitted to Eq. 8 where a and μ t were fitting parameters. The average and standard deviation of the slope of the curve (a) as a function of the ink concentration is presented in Fig. 3c. A linear dependence is observed for the slope of the curve as a function of the concentration of ink. 3.2.Photothermal Signal as a Function of the Laser PowerTo determine the photothermal signal as a function of the laser power, a homogeneous single layer phantom with 1% milk and 1.5% India ink was prepared. Five B-scans were obtained from the phantom with different laser powers with values of 22.5, 31.2, 38.6, 44.6, and 50.8 mW. The laser power was measured using a power meter. Each of the 200 A-lines from each B-scan was fitted to Eq. 8. The average and standard deviation of the slope of the curve (a) is presented as a function of the laser power in Fig. 3d. The slope of the curve is linearly dependent on the power of the laser. 3.3.Photothermal Signal as a Function of the Distance from the Zero-Delay LineThe model developed assumes that the pump laser beam is collimated; however, in reality it is focused and has a beam waist that varies with the axial position. The PT-OCT system design was optimized to have a large depth of focus (∼1.28 mm) such that the beam waist would minimally affect the experimental results. Also, the surface of the tissue samples is not always flat, and it is difficult to guarantee that the focal point of the pump laser will always be located at the same position from the tissue surface. Therefore, it is important to design a system that is minimally sensitive to the location of the surface from the zero-delay line, assuming the focal point is maintained at a fixed position. To experimentally validate the large depth of focus, a homogeneous single layer phantom with 1% milk and 1.5% India ink, was used to obtain phase images. The surface of the phantom was placed at a distance of 70, 350, 630, 910, and 1200 μm from the zero delay line. The mean and standard deviation of curve a was calculated for each A-line obtained from each phantom location, and the percent variation was calculated using as a reference the mean value obtained for the 350 μm location. This location was selected because it was the standard for the experiments in this paper. The results are presented in Fig. 4. For surface distances smaller than ∼1 mm, the variation of the mean of the slope was less than 25%. 3.4.Reconstruction of Single and Double Layer PhantomsEquation 9 is a simplification of the photothermal model that is valid for values of the product of the depth times the attenuation coefficient smaller than 1. The equation states that the photothermal signal is linearly proportional to the depth and the slope of the curve a. The slope of the curve is related to the concentration of the ink and the power of the laser, and minimally dependent on the surface distance from the zero-delay line (for a wide range of distances). To demonstrate the validity of the model, the concentration as a function of depth was reconstructed from single and double layer tissue phantoms. B-scans were obtained from five phantoms. Three homogeneous phantoms were created with 1% milk and 0.1, 0.5 and 1.5% India ink. Also, two double layered phantoms with a top ink concentration of 0.1 and 0.5% and a bottom ink concentration of 0.25% were produced. The pump laser power was 50.8 mW. Each A-line consisted of 512 pixels. Given that in real tissues we will not know a priori the number of tissue layers nor the tissue concentration, we selected a small window of 15 pixels and assume that the concentration of the drug is constant within that range. This window is large enough to minimize the sensitivity to noise but small enough to produce high resolution. The reconstruction algorithm consisted on fitting a linear equation to 15 consecutive pixels, and determining the slope of the linear fit. Therefore, we obtained the slope of pixels 1 through 15, and recorded it on pixel 1; then we obtained the slope of pixels 2 through 16 and recorded it in pixel 2; and so on. We were able to ignore the last 15 pixels, since they belong to deep tissue structures where there is almost no signal. Using the linear fit in Fig. 3c we were able to determine the ink concentration at each pixel based on the slope of the curve. Finally, a median filter was used on the reconstructed concentration image to minimize noise. The structure, phase, and reconstructed concentration images for the single and double layer phantoms are shown in Figs. 5, 6, respectively. Each structure image was normalized to the maximum value within the image. The average of the A-lines in the phase image for the double layer phantom with a top and bottom concentration of 0.5% and 0.25%, respectively, is shown in Fig. 7. Lines with the slope of the 0.5% and 0.25% phantoms obtained from the single layer phantoms are shown. Fig. 5Structure image for a phantom with an ink concentration of (a) 0.1%, (b) 0.5%, and (c) 1.5%. Phase image for a phantom with an ink concentration of (d) 0.1%, (e) 0.5%, and (f) 1.5%. Reconstructed concentration image for a phantom with an ink concentration of (g) 0.1%, (h) 0.5%, and (i) 1.5%.White line of (i): 100 μm. The color bar of the structure image has arbitrary units, the color bar of the phase image has arbitrary units, and the color bar of the concentration image is in ink concentration.  Fig. 6Structure image for a phantom with a top layer ink concentration of (a) 0.1% and (b) 0.5%. Phase image for a phantom with a top layer ink concentration of (c) 0.1% and (d) 0.5%. Reconstructed concentration images for a phantom with a top layer ink concentration of (e) 0.1% and (f) 0.5%. The bottom layer ink concentration for both phantoms was 0.25%. White line of (f): 100 μm. The color bar of the structure image has arbitrary units, the color bar of the phase image has arbitrary units, and the color bar of the concentration image is in ink concentration. 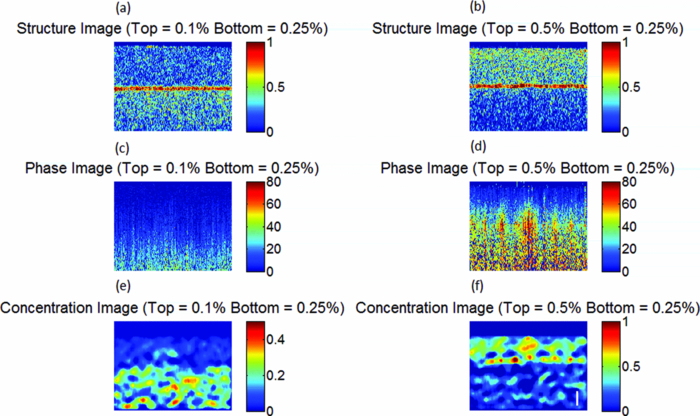 Fig. 7Average A-line from the phase image [Fig. 6d] for a phantom with a top and bottom layer ink concentration of 0.5% and 0.25%, respectively. The image includes a line with the 0.25% and 0.5% ink slope obtained from the homogeneous phantoms.  4.DiscussionFigure 3b presents the amplitude of the FFT of the phase changes at different depths in homogeneous single layer phantoms. This figure demonstrates that Eqs. 8, 9 are valid descriptions of the shape of the curve. Lower ink concentrations (lower attenuation coefficients) present a linear shape and higher ink concentrations (higher attenuation coefficients) present an exponential curve (linear shape for small depths). Also, as the concentration of the ink increases, the OCT signal is weaker in deeper structures and it limits the depth of the signal acquired. This explains the lack of signal for the 1% and 2% ink concentrations at depth greater than ∼0.95 and ∼0.65 mm, respectively. From Figs. 3c, 3d, it is demonstrated that the slope of the curve is linearly proportional to the ink concentration and the power of the laser, respectively. Although the mean values show the linear trend, a large standard deviation is observed at each data point. We attribute the large standard deviations of the data to the lack of stability of the power of the pump laser, which has high intensity fluctuations through time. In future implementations of the system, we expect to minimize these variations by measuring the power of the laser in real-time and properly calibrating the results. Also, although the phantoms prepared were homogeneous, some spots where the dye had accumulated were visually noticeable, which may also be responsible for the large standard deviations. The linear fit obtained in Fig. 3d, for the slope of the curve as a function of the laser power, does not cross the origin. The reason for this is that there needs to be a minimum threshold of laser power for which the increase in temperature by the ink is higher than the heat diffusion from the surrounding medium. Once the threshold is exceeded, the ink will increase its temperature producing changes in the index of refraction and thermal expansion, which can be detected with the PT-OCT system. Due to the long focal length of the system, the surface of the sample can be located at any distance smaller than ∼1 mm from the zero-delay line, producing a variation of the slope of the curve of less than 25%. It is important to determine this range because the surface of biological tissues have curvatures (i.e., they are not flat), and it would be difficult to guarantee that the surface will be located at a fixed position from the zero-delay line as a B-scan is obtained. Also, given that the pump laser is focused, the power per unit area varies with depth. For the range of 350 to 630 μm, the power per unit area is almost constant. From Fig. 5 it is observed that the ink concentration of homogeneous single layer phantoms can properly be reconstructed. The reconstruction is accurate for low ink concentrations. At higher ink concentrations the reconstruction close to the tissue surface is accurate; however, at deeper locations the concentration decreases. This is expected because the linearity of the phase image is only valid for small values of the product of the attenuation coefficient times the depth, and the inverse reconstruction model only works for the linear regions. Also, at higher ink concentrations there is less signal coming from deeper structures as can be observed in the structure OCT image [Fig. 5c]. The reconstruction algorithm uses Eq. 9 instead of Eq. 8 because in real tissues it cannot be assumed that the absorber concentration is homogeneous at all depths. Although the errors between the reconstructed image and the actual concentration values depend on the optical properties of the tissue and the depth, the mean error at a depth of 100 μm has been determined to be less than 20%. Figure 6 shows the concentration image reconstruction from two double layer phantoms where the top ink concentration is higher/lower than the bottom layer ink concentration. Low values of ink concentration (≤ 0.5%) were selected such that the phase image will be linear for large depth range. The structure images show the plastic film that separates both layers [red horizontal line in Figs. 6a, 6b]. If it was known that the concentration within a layer of tissue was constant, the reconstruction algorithm could be modified to find the slope of the curve for the number of pixels within a specified layer. The number of pixels belonging to a layer could be determined by observing the structure image, as shown in Figs. 6a, 6b. However, since it is not possible to know for sure that the concentration is homogeneous within a tissue layer it is imprudent to modify the algorithm. Ideally, the slope of the curve could be determined by using the gradient between each two consecutive pixels of an A-line from a phase image. However, this approach is highly sensitive to noise. In our method, we chose 15 pixels because it offered a balance between too few pixels (which are highly sensitive to noise), and too many pixels, which reduce the resolution of the reconstructed concentration image. It is important to note that the slope of the curve (a) as a function of concentration [Fig. 3c], needs to be determined for each drug that is being used. In order to develop a system that does not require calibration, the photothermal properties of the compounds need to be known a priori, which is difficult to obtain25, 34 and not known for various compounds. Figure 7 shows the average of all the A-lines in the phase image from the top and bottom ink concentration of 0.5 and 0.25% [Fig. 6d]. The figure includes two linear curves that have the 0.5% and 0.25% slope determined from the single homogeneous phantoms [Fig. 3c]. The curve of the top layer agrees with the 0.5% linear curve and the curve of the bottom layer agrees with the 0.25% slope. An artifact is observed at a depth of ∼300 μm which is due to the plastic film that was used to separate both layers. Also, at about ∼700 μm the curve of the bottom layer deviates from its linearity. This is because the sum of the product of the depth times the attenuation coefficient of each layer is no longer smaller than 1; therefore, the reconstruction for these depths becomes less accurate. The experiments presented in this paper were done in solid gel phantoms. These phantoms allowed us to obtain strong signals from the structure inside the phantoms. For liquid phantoms, these experiments are more challenging because the structures inside the liquids are constantly moving due to Brownian motion; therefore, it is difficult to accurately determine the phase of the scattering structure through time. A solution for liquid phantoms has previously been demonstrated by measuring the signal at the interfaces at the surface of the liquid.21, 22, 24 A challenge of this method for measuring hemoglobin in vivo is that OCT structure images present shadow effects underneath the blood vessels, which would reduce the signal obtained at the vessel boundary. A limitation of the system is that it is slow (125 ms for an M-scan). This can be improved by increasing the modulation frequency of the pump laser. However, a higher modulation frequency will mean less time to allow for the drug to increase its temperature; therefore, a lower signal will be obtained. This can be compensated by increasing the laser power. The temperature increase should be carefully monitored to avoid undesired therapeutic effects. This model can be used for imaging absorber concentrations in vivo. It is assumed that the thermal expansion properties and changes of the index of refraction as a function of temperature between the agar gel phantom and biological tissues are similar, since both samples are mostly composed of water. 5.ConclusionsA model that describes the photothermal signal as a function of depth has been developed. The parameters of the model have been empirically derived using homogeneous single layer phantoms, and it has been determined that the slope of the curve of the model is dependent on both the laser power and the ink concentration. The model is also minimally dependent on the distance between the surface of the phantom and the zero-delay line for distances smaller than ∼1 mm. These distances are useful for obtaining the depth profile concentration of different tissue layers, such as the epithelial layer where most cancers originate. We developed a concentration reconstruction algorithm that is limited to small values of the product of the depth times the attenuation coefficient. The algorithm was validated in solid homogeneous single and double layer phantoms. In the future we expect to use the system in biological tissues using exogenous and endogenous contrast agents that are more suitable for medical applications; such as gold nanoparticles, indocyanine green, and hemoglobin. By monitoring the pump laser power and properly calibrating the results, we expect to minimize the noise in the results obtained. An advantage of using photothermal compounds is that they can be multifunctional, where they can be used as contrast agents for imaging and also as a therapeutic drug. Concentration images can be obtained from biological tissues, and when a specific dose is achieved, the temperature of the drug can be properly increased to damage the surrounding tissues. AcknowledgmentsThe authors would like to thank Mr. Zhongwei Zhi, Mr. Lin An, Dr. Guozhong Liu, Dr. Xusheng Zhang, and Professor Yi Wang for their laboratory assistance. This work was supported in part by research grants from the National Institutes of Health (Nos. R01 HL093140, R01 HL093140S, R01EB009682, and R01 DC010201), and the American Heart Association (No. 0855733G). The content of this paper is solely the responsibility of the authors and does not necessarily represent the official views of grant-giving bodies. ReferencesK. Sokolov,
J. Aaron,
N. Nitin,
K. Travis,
S. Kumar,
T. Collier,
S. Y. Park,
M. Jose-Yacaman,
L. Coghlan,
M. Follen, and
R. Richards-Kortum,
“Plasmon resonance coupling of metal nanoparticles for molecular imaging of carcinogenesis in vivo,”
J. Biomed. Opt., 12 034007
(2007). https://doi.org/10.1117/1.2737351 Google Scholar
S. Krishnan,
P. Diagaradjane,
A. Shetty,
J. C. Wang,
A. M. Elliott,
J. Schwartz,
S. Shentu,
H. C. Park,
A. Deorukhkar,
R. J. Stafford,
S. H. Cho,
J. W. Tunnell, and
J. D. Hazle,
“Modulation of in vivo tumor radiation response via gold nanoshell-mediated vascular-focused hyperthermia: Characterizing an integrated antihypoxic and localized vascular disrupting targeting strategy,”
Nano Lett., 8 1492
–1500
(2008). https://doi.org/10.1021/nl080496z Google Scholar
K. R. Diamond,
M. S. Patterson, and
T. J. Farrell,
“Quantification of fluorophore concentration in tissue-simulating media by fluorescence measurements with a single optical fiber,”
Appl. Opt., 42 2436
–2442
(2003). https://doi.org/10.1364/AO.42.002436 Google Scholar
B. W. Pogue and
G. Burke,
“Fiber-optic bundle design for quantitative fluorescence measurement from tissue,”
Appl. Opt., 37 7429
–7436
(1998). https://doi.org/10.1364/AO.37.007429 Google Scholar
M. Canpolat and
J. R. Mourant,
“Monitoring photosensitizer concentration by use of a fiber-optic probe with a small source-detector separation,”
Appl. Opt., 39 6508
–6514
(2000). https://doi.org/10.1364/AO.39.006508 Google Scholar
B. Kruijt,
S. Kascakova,
H. S. de Bruijn,
A. van der Ploeg-van den Heuvel,
H. J. C. M. Sterenborg,
D. J. Robinson, and
A. Amelink,
“In vivo quantification of chromophore concentration using fluorescence differential path length spectroscopy,”
J. Biomed. Opt., 14 034022
(2009). https://doi.org/10.1117/1.3149862 Google Scholar
R. Reif,
M. Wang,
S. Joshi,
O. A’Amar, and
I. J. Bigio,
“Optical method for real-time monitoring of drug concentrations facilitates the development of novel methods for drug delivery to brain tissue,”
J. Biomed. Opt., 12 034036
(2007). https://doi.org/10.1117/1.2744025 Google Scholar
T. C. Zhu,
J. C. Finlay, and
S. M. Hahn,
“Determination of the distribution of light, optical properties, drug concentration, and tissue oxygenation in vivo in human prostate during motexafin lutetium-mediated photodynamic therapy,”
J. Photochem. Photobiol., B, 79 231
–241
(2004). https://doi.org/10.1016/j.jphotobiol.2004.09.013 Google Scholar
M. G. Ghosn,
V. V. Tuchin, and
K. V. Larin,
“Nondestructive quantification of analyte diffusion in cornea and sclera using optical coherence tomography,”
Invest. Ophthalmol. Visual Sci., 48 2726
–2733
(2007). https://doi.org/10.1167/iovs.06-1331 Google Scholar
A. Agrawal,
S. Huang,
A. W. H. Lin,
M. H. Lee,
J. K. Barton,
R. A. Drezek, and
T. J. Pfefer,
“Quantitative evaluation of optical coherence tomography signal enhancement with gold nanoshells,”
J. Biomed. Opt., 11 041121
(2006). https://doi.org/10.1117/1.2339071 Google Scholar
T. M. Lee,
A. L. Oldenburg,
S. Sitafalwalla,
D. L. Marks,
W. Luo,
F. J. J. Toublan,
K. S. Suslick, and
S. A. Boppart,
“Engineered microsphere contrast agents for optical coherence tomography,”
Opt. Lett., 28 1546
–1548
(2003). https://doi.org/10.1364/OL.28.001546 Google Scholar
P. Yu,
M. Mustata,
L. Peng,
J. J. Turek,
M. R. Melloch,
P. M. W. French, and
D. D. Nolte,
“Holographic optical coherence imaging of rat osteogenic sarcoma tumor spheroids,”
Appl. Opt., 43 4862
–4873
(2004). https://doi.org/10.1364/AO.43.004862 Google Scholar
B. Lounis,
L. Cognet,
C. Tardin,
D. Boyer,
D. Choquet, and
P. Tamarat,
“Single metallic nanoparticle imaging for protein detection in cells,”
Proc. Natl. Acad. Sci. U.S.A., 100 11350
–11355
(2003). https://doi.org/10.1073/pnas.1534635100 Google Scholar
Z. P. Chen,
T. E. Milner,
S. Srinivas,
X. J. Wang,
A. Malekafzali,
M. J. C. vanGemert, and
J. S. Nelson,
“Noninvasive imaging of in vivo blood flow velocity using optical Doppler tomography,”
Opt. Lett., 22 1119
–1121
(1997). https://doi.org/10.1364/OL.22.001119 Google Scholar
Y. H. Zhao,
Z. P. Chen,
Z. H. Ding,
H. W. Ren, and
J. S. Nelson,
“Real-time phase-resolved functional optical coherence tomography by use of optical Hilbert transformation,”
Opt. Lett., 27 98
–100
(2002). https://doi.org/10.1364/OL.27.000098 Google Scholar
B. J. Vakoc,
S. H. Yun,
J. F. de Boer,
G. J. Tearney, and
B. E. Bouma,
“Phase-resolved optical frequency domain imaging,”
Opt. Express, 13 5483
–5493
(2005). https://doi.org/10.1364/OPEX.13.005483 Google Scholar
R. K. Wang,
S. Kirkpatrick, and
M. Hinds,
“Phase-sensitive optical coherence elastography for mapping tissue microstrains in real time,”
Appl. Phys. Lett., 90 164105
(2007). https://doi.org/10.1063/1.2724920 Google Scholar
R. K. Wang and
A. L. Nuttall,
“Phase-sensitive optical coherence tomography imaging of the tissue motion within the organ of Corti at a subnanometer scale: a preliminary study,”
J. Biomed. Opt., 15 056005
(2010). https://doi.org/10.1117/1.3486543 Google Scholar
A. M. Gobin,
M. H. Lee,
N. J. Halas,
W. D. James,
R. A. Drezek, and
J. L. West,
“Near-infrared resonant nanoshells for combined optical imaging and photothermal cancer therapy,”
Nano Lett., 7 1929
–1934
(2007). https://doi.org/10.1021/nl070610y Google Scholar
S. A. Telenkov,
D. P. Dave,
S. Sethuraman,
T. Akkin, and
T. E. Milner,
“Differential phase optical coherence probe for depth-resolved detection of photothermal response in tissue,”
Phys. Med. Biol., 49 111
–119
(2004). https://doi.org/10.1088/0031-9155/49/1/008 Google Scholar
D. C. Adler,
S. W. Huang,
R. Huber, and
J. G. Fujimoto,
“Photothermal detection of gold nanoparticles using phase-sensitive optical coherence tomography,”
Opt. Express, 16 4376
–4393
(2008). https://doi.org/10.1364/OE.16.004376 Google Scholar
R. V. Kuranov,
J. Qiu,
A. B. McElroy,
A. Estrada,
A. Salvaggio,
J. Kiel,
A. K. Dunn,
T. Q. Duong, and
T. E. Milner,
“Depth-resolved blood oxygen saturation measurement by dual-wavelength photothermal (DWP) optical coherence tomography,”
Biomed. Opt. Express, 2 491
–504
(2011). https://doi.org/10.1364/BOE.2.000491 Google Scholar
A. S. Paranjape,
R. Kuranov,
S. Baranov,
L. L. Ma,
J. W. Villard,
T. Wang,
K. V. Sokolov,
M. D. Feldman,
K. P. Johnston, and
T. E. Milner,
“Depth resolved photothermal OCT detection of macrophages in tissue using nanorose,”
Biomed. Opt. Express, 1 2
–16
(2010). https://doi.org/10.1364/BOE.1.000002 Google Scholar
J. Kim,
J. Oh, and
T. E. Milner,
“Measurement of optical path length change following pulsed laser irradiation using differential phase optical coherence tomography,”
J. Biomed. Opt., 11 041122
(2006). https://doi.org/10.1117/1.2236289 Google Scholar
H. H. Richardson,
M. T. Carlson,
P. J. Tandler,
P. Hernandez, and
A. O. Govorov,
“Experimental and theoretical studies of light-to-heat conversion and collective heating effects in metal nanoparticle solutions,”
Nano Lett., 9 1139
–1146
(2009). https://doi.org/10.1021/nl8036905 Google Scholar
C. Zhou,
T. H. Tsai,
D. C. Adler,
H. C. Lee,
D. W. Cohen,
A. Mondelblatt,
Y. H. Wang,
J. L. Connolly, and
J. G. Fujimoto,
“Photothermal optical coherence tomography in ex vivo human breast tissues using gold nanoshells,”
Opt. Lett., 35 700
–702
(2010). https://doi.org/10.1364/OL.35.000700 Google Scholar
M. C. Skala,
M. J. Crow,
A. Wax, and
J. A. Izatt,
“Photothermal optical coherence tomography of epidermal growth factor receptor in live cells using immunotargeted gold nanospheres,”
Nano Lett., 8 3461
–3467
(2008). https://doi.org/10.1021/nl802351p Google Scholar
Y. Jung,
R. Reif,
Y. Zeng, and
R. K. Wang,
“Three-dimensional high-resolution imaging of gold nanorods uptake in sentinel lymph nodes,”
Nano Lett., 11 2938
–2943
(2011). https://doi.org/10.1021/nl2014394 Google Scholar
B. W. Pogue and
M. S. Patterson,
“Review of tissue simulating phantoms for optical spectroscopy, imaging and dosimetry,”
J. Biomed. Opt., 11 041102
(2006). https://doi.org/10.1117/1.2335429 Google Scholar
B. C. Wilson and
S. L. Jacques,
“Optical reflectance and transmittance of tissues—principles and applications,”
IEEE J. Quantum Electron., 26 2186
–2199
(1990). https://doi.org/10.1109/3.64355 Google Scholar
P. Di Ninni,
F. Martelli, and
G. Zaccanti,
“The use of India ink in tissue-simulating phantoms,”
Opt. Express, 18 26854
–26865
(2010). https://doi.org/10.1364/OE.18.026854 Google Scholar
S. J. Madsen,
M. S. Patterson, and
B. C. Wilson,
“The use of India ink as an optical absorber in tissue-simulating phantoms,”
Phys. Med. Biol., 37 985
–993
(1992). https://doi.org/10.1088/0031-9155/37/4/012 Google Scholar
P. Schiebener,
J. Straub,
J. M. H. L. Sengers, and
J. S. Gallagher,
“Refractive-index ofwater and steam as function of wavelength, temperature and density,”
J. Phys. Chem. Ref. Data, 19 677
–717
(1990). https://doi.org/10.1063/1.555859 Google Scholar
D. K. Roper,
W. Ahn, and
M. Hoepfner,
“Microscale heat transfer transduced by surface plasmon resonant gold nanoparticles,”
J. Phys. Chem. C, 111 3636
–3641
(2007). https://doi.org/10.1021/jp064341w Google Scholar
|