|
|
1.IntroductionThe relationship between mood and cognition, as well as the neural mechanisms supporting it, has long attracted researchers in psychology and neuroscience.1, 2 Behavioral experiments have shown that even mild variations in mood state influence various cognitive functions such as working memory (WM) and cognitive fluency.1, 3, 4 Recent neuroimaging studies have implicated the prefrontal cortex (PFC) as one of the key regions that converges mood and cognition in the brain.1, 2 For instance, functional magnetic resonance imaging (fMRI) studies have reported that experimentally induced negative moods affect PFC activity during cognitive tasks such as WM and Stroop tasks.5, 6 In addition, near-infrared spectroscopy (NIRS) studies focusing on moods under natural circumstances indicate that people having a high level of fatigue or sleepiness showed decreased PFC activity in response to verbal fluency tasks.7, 8 However, little is known about how PFC activity during cognitive tasks and natural moods, which can vary across days or weeks, are coupled within individuals. Thus, tracking within-individual fluctuations in natural mood and PFC activity during cognitive tasks is necessary to deepen our knowledge about their relationship. In our previous study, we used optical topography (OT), which is a noninvasive functional imaging-technique based on NIRS,9, 10, 11 to show that a variation in the negative mood state across participants is correlated with their PFC activity for a verbal WM task.12 OT measures hemodynamic responses in the cerebral cortex under near-natural situations (e.g., sitting position) and allows us to minimize mood modulation due to the experiment itself. In the previous study, the participants’ natural moods were assessed by using the Profile of Mood States (POMS), a self-reporting questionnaire.13, 14 As the POMS is used to evaluate a responder's typical mood states rather than personality traits,15 one can assume that the observed correlation would reflect a state-dependent effect. However, because of the experimental design used in the previous study, i.e., across-subject design, we could not deny the possibility of the contribution of individual trait factors (e.g., personality traits or dispositional moods) in the results. One solution to dissociate the state-dependent effect found in the previous study12 from certain trait factors is examining whether PFC activity changes in correlation with his/her mood state using a within-individual design. In this study, we repeated three experiment sessions for each participant at 2-week intervals to trace the time-to-time mood fluctuations within individuals, which enabled us to identify the contribution of each participant's depressed mood state to the variations in their PFC activity independent of trait factors. 2.Materials and Methods2.1.ParticipantsSeventeen healthy adults (12 males and 5 females; 25 to 48 years old) participated in the three experimental sessions at 2-week intervals. None of the participants had participated in our previous study.12 This study was approved by the Ethics Committee of Hitachi, Ltd., and all participants provided written informed consent before the experiments. 2.2.Mood AssessmentAt the beginning of each session, the participants’ natural moods were assessed with a short form of the POMS,13 which had been translated and validated for the Japanese general population.14 While the POMS depicts sustained moods, previous studies have shown that it detects mood fluctuations within individuals.16 Moreover, the test–retest reliability of POMS scores is not particularly high (0.65 to 0.74), suggesting that the score reflects a mood state rather than a personality trait.15 The participants rated 30 mood-related adjectives on a 5-point scale ranging from 0 (“not at all”) to 4 (“extremely”) on the basis of how they had been feeling during the past 1 week. The POMS consists of six identifiable mood factors: tension, depression, anger, vigor, fatigue, and confusion. In this study, we focused on the POMS depression score (POMS_D) because it had shown the most significant correlation with PFC activity for the verbal WM task in our previous study.12 2.3.WM TasksImmediately after the mood assessment, we measured the participants’ PFC activity while they performed WM tasks. The tasks were presented through software (Platform of Stimuli and Tasks, developed at Hitachi's Central Research Laboratory), the same as in the previous study.12 Each participant performed two types of WM tasks (verbal and spatial), which had an identical delayed-response paradigm. In both sessions, each task trial started with a 1500-ms presentation of the target stimuli (Target) on the PC display screen, which was followed by a delay of 7000 ms. A probe stimulus (Probe) was then presented for 2000 ms or until the participant responded. The participant responded by pressing a button on a handheld game controller connected to the PC. The system recorded the button pressed and the reaction time. In the verbal WM task, a set of two or four Japanese Hiragana characters were presented as the Target, and a Japanese Katakana character was presented as the Probe. The participants were instructed to judge whether the character presented as the Probe corresponded to any of the Target characters and then press the appropriate button. In the spatial WM task, the Target was the location of two or four white squares out of eight locations, and the Probe was the location of a white square. The participants were instructed to assess if the location of the white square presented as the Probe was identical to any of the locations of the squares presented as the Target. The intervals between the Probe onset and the following Target onset in the next trial were randomized from 16 to 24 s. Only a fixation cross was presented during the interval and delay period. In addition, a visual cue (changing the color of the fixation cross) was presented for 500 ms prior to trial onset. Auditory cues (1000- and 800-Hz pure tones of 100-ms duration) were presented at the onsets of the visual cue and Probe, respectively. We organized the WM tasks into two sessions, one for the verbal WM task and the other for the spatial WM task, with a counterbalanced order across participants. Sixteen trials of one of the tasks were repeated in each session, and the sessions were separated by a short break (approximately 1 min). While in our previous experiment the WM task was intermingled with two additional conditions resulting in only five repetitions for each WM task, these conditions were not used in the present experiment. This modification made it possible to increase the number of repetitions for the WM task. 2.4.OT MeasurementThe PFC activity was measured using an OT system (ETG-7100, Hitachi Medical Corporation, Japan). The system is based on a continuous wave (cw) NIRS technique.9, 10, 11 Although other techniques such as time-resolved and frequency-domain techniques17, 18, 19 are possibly advantageous for accurate estimation of brain tissue oxygenation and for depth-resolved analysis,20, 21, 22 we used the cw NIRS technique because it has proved useful in previous practical studies.23, 24, 25, 26, 27, 28 The OT system light sources were cw laser diodes with a wavelength of 695 or 830 nm. The average power of each source was 2 mW (for both wavelengths), and the two wavelength lights were irradiated on the skin through an incident optical fiber bundle (1.5-mm diameter). The signal intensities of the transmitted light were detected through a detection optical fiber bundle located 30 mm from the incident position at a sampling rate of 100 ms. We used 15 incident optical fiber bundles (sources) and 15 detection optical fiber bundles (detectors), which were arranged alternately, separated by 30 mm, in a 3×10 lattice pattern and embedded in a soft silicon holder. This resulted in a configuration with 47 measurement positions (defined as channels: chs), each corresponding to a midpoint of source-detector pair (Fig. 1). The holder was placed on each participant's forehead, and the optical fiber bundles contacted the skin on the forehead. Although we used a different system (ETG-4000, Hitachi Medical Corporation, Japan) in our previous study,12 the basic specifications were common to both systems. The only difference between the two measurements was the width of the measurement area; the present study measured 47 chs (6 × 27 cm) using a 3×10 optode arrangement while our previous study measured 52 chs (6 × 30 cm) using a 3×11 optode arrangement. The reduced width in the present study was due to a limitation in the system software. In addition, the primary activation areas identified in the previous study12 were in the range of the measurement area of the present study. Fig. 1Arrangement of measurement positions (47 channels) in MNI space, estimated using probabilistic registration method (Ref. 30). 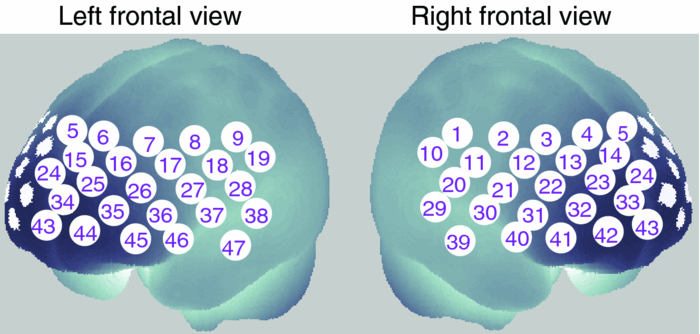 To estimate the locations of the OT channels in the Montreal Neurological Institute (MNI) space, we used the probabilistic registration method.29, 30 Prior to the experiment, we corrected the sample data for the three-dimensional (3D) coordinates of the 30 optode locations and scalp landmarks (in accordance with the international 10 to 20 system: Fp1, Fp2, Fz, T3, T4, C3, C4) for the 11 participants. The data were recorded with a 3D-magnetic space digitizer (3D probe positioning unit for OT system, EZT-DM101, Hitachi Medical Corporation, Japan). 2.5.Data AnalysisAnalysis was performed using the plug-in–based analysis software Platform for Optical Topography Analysis Tools (developed by Hitachi, CRL; run on MATLAB, The MathWorks, Inc., U.S.A.). First, the temporal data detected for the intensity change at each wavelength were used to calculate the products of the effective optical path length and the concentration changes of the independent hemoglobin (Hb) species (ΔC ′ oxy: oxy-Hb signal, and ΔC ′ deoxy: deoxy-Hb signal) for each channel on the basis of the modified Beer–Lambert law31 as follows: Eq. 1[TeX:] \documentclass[12pt]{minimal}\begin{document} \begin{equation} \Delta C'_{{\rm oxy}} {=} L \cdot \Delta C_{{\rm oxy}} {=} \frac{{ - \varepsilon _{{\rm deoxy }(\lambda 2)} \cdot \Delta A_{(\lambda 1)} {\rm } {+} \varepsilon _{{\rm deoxy}}{(\lambda 1)} \cdot \Delta A_{(\lambda 2)} }}{E}, \end{equation}\end{document}Eq. 2[TeX:] \documentclass[12pt]{minimal}\begin{document}\begin{equation} \Delta C'_{{\rm deoxy}} = L \cdot \Delta C_{{\rm deoxy}} = \frac{{\varepsilon _{{\rm oxy}\,(\lambda 2)} \cdot \Delta A_{(\lambda 1)} - \varepsilon _{{\rm oxy}(\lambda 1)} \cdot \Delta A_{(\lambda 2)} }}{E}, \end{equation}\end{document}Eq. 3[TeX:] \documentclass[12pt]{minimal}\begin{document}\begin{equation} E = \varepsilon _{{\rm deoxy}(\lambda 1)} \cdot \varepsilon _{{\rm oxy}(\lambda 2)} - \varepsilon _{{\rm deoxy}\,(\lambda 2)} \cdot \varepsilon _{{\rm oxy}\,(\lambda 1)}. \end{equation}\end{document}The time-continuous data of the oxy-Hb signals for each channel were separated into task blocks, which were defined as 25.5-s periods starting from 1.0 s before Target onset and ending 16.0 s after Probe onset, each containing a WM task trial. We removed blocks contaminated by a motion artifact, which was defined as a raw oxy-Hb signal change larger than 0.4 mM·mm over two successive samples (200-ms duration), as we did in our previous study.12 We selected 0.4 mM · mm as the threshold level because we had found that sharp noises (putatively unphysiological signal changes) identified by a visual inspection of the data from our previous study12 were effectively detected at this level. The remaining data were baseline corrected by linear regression based on the least squares method by using the data for the first second and the final second of each task block. To evaluate PFC activity during the tasks, we defined the “activation period” as the 5-s period starting 5.0 s after Target onset, taking into consideration the delay in hemodynamic changes from neuronal activity mainly related to the encoding process. The mean signal changes during the activation period (x i) were calculated for the oxy-Hb signal for each task block. Using the mean value of x i across task blocks, we calculated within-participant z-values (converted from t-statistics) for each channel, taking intertrial variability into consideration as follows: Eq. 4[TeX:] \documentclass[12pt]{minimal}\begin{document}\begin{equation} z{\rm } = \frac{{\overline x }}{{SD}}, \end{equation}\end{document}Eq. 5[TeX:] \documentclass[12pt]{minimal}\begin{document}\begin{equation} {\rm }\overline x = \displaystyle\frac{1}{n}\sum\limits_{i = 1}^n {x_i }, \end{equation}\end{document}Eq. 6[TeX:] \documentclass[12pt]{minimal}\begin{document}\begin{equation} SD{\rm } = \sqrt {\frac{1}{n} \displaystyle\sum\limits_{i = 1}^n {(x_i - \overline x)^2 } }. \end{equation}\end{document}The z-values are expressed as the mean x i [Eq. 5] divided by the intertrial variability, which is given by the standard deviation of the x i across task trials [Eq. 6]. The z-values were defined as activation values (Act_V and Act_S) and represented the activation strengths for the verbal WM task (Act_V) and spatial WM task (Act_S). For the correlation analysis, we calculated the differences between successive sessions (Δ1st to 2nd and Δ2nd to 3rd) in Act_S (ΔAct_S), in Act_V (ΔAct_V), and in POMS_D (ΔPOMS_D) for each participant. These time-to-time fluctuations by individuals enabled us to identify the contribution of each participant's mood state on their PFC activity independent of trait factors. In the correlation analysis, the Spearman (rank) partial correlation with control variables of age and gender was used. 3.ResultsBehavioral data (accuracy and reaction time: RT) for the WM tasks are listed in Table 1. An analysis of variance (ANOVA) with session order (1st, 2nd, and 3rd) and WM task (verbal and spatial) as within-participant factors revealed that there was no significant main effect of session order for both accuracy (p = 0.47) and RT (p = 0.29). On the other hand, a significant main effect of WM tasks was indicated for RT (p = 0.005), which means that RT for the verbal WM task was longer than that for the spatial WM tasks. However, the verbal WM task tended to show higher accuracy than the spatial WM task, though it was not significant (p = 0.14). The mean and standard deviation (SD) of POMS_D were 2.47±2.67 for the 1st session, 1.88±2.23 for the 2nd session, and 2.65±2.91 for the 3rd session. Table 1Mean accuracy and RT for WM tasks.
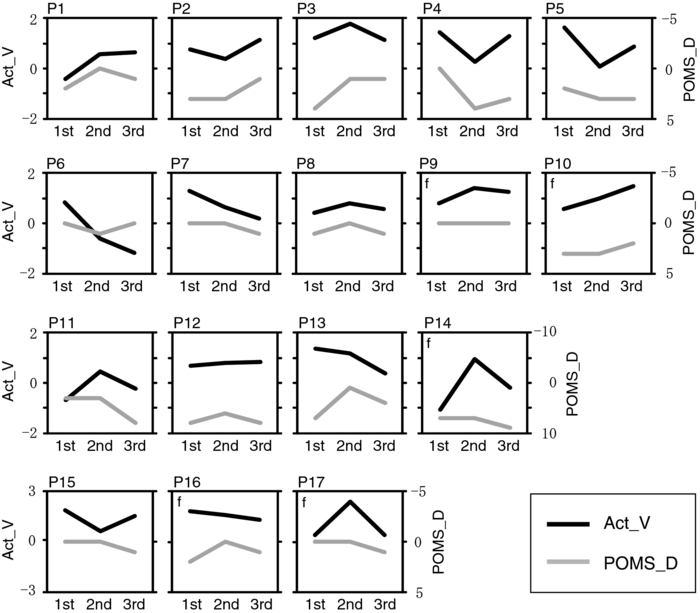
To examine the basic activation pattern during WM tasks, we first conducted across-participants t-test of the activation values (Act_V and Act_S) for each session [Fig. 2a]. Channels in the bilateral dorsolateral PFC showed significantly positive values in all cases (p < 0.05). In particular, ch22 in the right hemisphere and ch26 in the left hemisphere consistently showed prominent activation (p < 0.01) for all sessions for both WM tasks [marked channels in Fig. 2a]. For these main activation channels, a session dependency (order effect) on the activation values was tested using the repeated-measures ANOVA with session order (1st, 2nd, and 3rd) and WM task (verbal and spatial). This analysis showed no main effect of the session order (ch22: p = 0.96, ch26: p = 0.28) with no interaction between session order and WM task (ch22: p = 0.59, ch26: p = 0.76), indicating the same activation pattern was reproduced for all sessions regardless of the WM type. The similarity of the time courses in activation signals among sessions is shown in Fig. 2b. In addition, the main effect of WM tasks indicated no significant effect in the two channels (ch22: p = 0.90, ch26: p = 0.15). Fig. 2Reproducibility of cortical activation for verbal and spatial WM tasks. (a) t-maps of activation values among participants. Channels with significant activation (determined with one-sample t-test against zero) are indicated with color scale shown below (two-tailed, p < 0.05). (b) Mean time courses of reconstructed oxy-Hb signals for representative channel (ch22 in Fig. 1). Yellow bars perpendicular to the x-axis indicate activation period (5-s duration). Error bars indicate standard errors across participants.  To reveal the relationship between within-individual changes in depressed mood state and PFC activation for WM tasks, we calculated the Spearman rank correlation coefficient (ρ) between ΔPOMS_D and ΔAct_V (or ΔAct_S) for each channel. The ρ-maps for Δ1st to 2nd and Δ2nd to 3rd are shown in Fig. 3a. We regarded the channels, in which the p-values were less than 0.05 for both Δ1st to 2nd and Δ2nd to 3rd, as significantly correlated. This result indicated significantly negative correlations between ΔPOMS_D and ΔAct_V for channels mainly located in the left dorsolateral PFC (ch26 and ch35) and around the left pre-motor and supplementary motor cortex (ch8 and ch19). In contrast, the correlation coefficients between ΔAct_S and ΔPOMS_D did not reach statistical significance (the higher p > 0.21). These results were consistent with our previous results.12 The distributions of ρ-values among12 channels are shown with histograms [Fig. 3b] to demonstrate the discrepancy between ΔAct_V and ΔAct_S. Fig. 3Relationship between variations in depressed mood state (POMS_D) and those in activation values for verbal and spatial WM tasks (Act_V and _Act_S). (a) Statistical ρ-maps indicating correlation coefficients (Spearman ρ) between ΔPOMS_D and ΔAct_V (or ΔAct_S). Channels that showed correlation coefficients (p < 0.05) in both Δ1st to 2nd and Δ2nd to 3rd are marked with solid circles. In addition, channels that showed correlation coefficients (p < 0.10) in both Δ1st to 2nd and Δ2nd to 3rd are marked with dashed circles. (b) Histograms illustrating distributions of ρ-values for each WM task. Blue vertical line denotes median ρ-value for verbal WM task, and red vertical line denotes median ρ-value for spatial WM task among 47 channels.  Figure 4 shows the negative correlation between ΔPOMS_D and ΔAct_V in the left dorsolateral PFC (ch26 and ch35), where clear WM-related activity was demonstrated (Fig. 2). The p-values for the correlation coefficients were 0.0315 and 0.0292 for Δ1st to 2nd and Δ2nd to 3rd, respectively. These p-values mean that the probability of obtaining these correlation coefficients is 0.00092 (0.0315×0.0292), which is below the corrected p-value of 0.05 for all 47 channels (0.05/47 = 0.00106). This indicates that decreased depressed mood score (POMS_D) is correlated with increased PFC activity for the verbal WM task (Act_V). Fig. 4Scatter plot showing relationship between ΔPOMS_D and ΔAct_V in left dorsolateral PFC (mean of ch26 and ch35). (a) Regression line of data for Δ1st to 2nd. (b) Regression line of data for Δ2nd to 3rd.  The within-individual fluctuations of POMS_D and Act_V (mean of ch26 and ch35) are shown in Fig. 5 for all participants, where the POMS_D is denoted on the reversed Y-axis. Although the sensitivities might be different, the basic change pattern for Act_V and reversed POMS_D across sessions appears to be similar in most participants. 4.DiscussionWe used OT to show that fluctuations in the depressed mood state within individuals are correlated with their PFC activity during a verbal WM task. The results are consistent with those of our previous study12 and confirm the state-dependent feature of PFC activity, which cannot be explained by the effects of certain trait differences among individuals. The mean activation patterns for WM tasks were well reproduced, as shown in Fig. 2. The central channels of the activation were located in the dorsolateral PFC, which is consistent with other fMRI studies.36 Moreover, the strong similarity between the activation patterns found in the present study with those found in our previous study12 suggests that OT measurement is highly reliable for detecting cortical activity for these WM tasks. We found no main effect of session order for the PFC activity, suggesting that there was no simple order effect in our measurements. In addition, the oxy-Hb signals in a representative channel demonstrated overlapped time courses among three sessions. These results support that relevant cortical activity for WM functions can be extracted using ICA.35 Regarding differences between verbal and spatial WM tasks, the activation regions for the verbal WM task appeared to be larger than those for the spatial WM task. However, no significant main-effect of WM tasks was found in the channels that showed significant correlation coefficients between ΔPOMS_D and ΔAct_V (ch8: p = 0.94, ch19: p = 0.12, ch26: p = 0.15, ch35: p = 0.07). In addition, the behavioral data did not reveal significant differences between the two tasks in terms of difficulty. The RT for the verbal WM task was longer than that for the spatial WM tasks, which was possibly due to a difference in the task strategy, as participants showed higher accuracy for the verbal WM task than for the spatial WM task. The basic activation patterns were thus similar in both WM tasks, but the correlation analysis revealed a contrast between tasks in relation to the depressed mood state (POMS_D). The negative correlation between ΔPOMS_D and ΔAct_V were well reproduced in the two independent differences between successive sessions (Δ1st to 2nd and Δ2nd to 3rd), while there were consistently no significant correlations between ΔPOMS_D and ΔAct_S. This result suggests that the PFC activity induced by a verbal WM task is selectively related to an individual's depressed mood state. In addition, the significant channels were mainly located in the left dorsolateral PFC, which is consistent with previous results.12 Thus, we found that the interindividual variation in PFC activity during a verbal WM task12 is not simply an indirect reflection of individual differences in trait factors; it actually reflects time-to-time fluctuations in the depressed mood state of an individual. Although the inherent limitation of transcranial NIRS requires that we consider the effect of hemodynamic changes in the extracerebral tissue, such as changes in skin blood flow,37, 38 our task paradigm did not impose intense physical or psychological demands, which could induce systemic changes. Moreover, the effect of extracerebral hemodynamic changes could not account for our finding that there is selective negative correlation between ΔPOMS_D and ΔAct_V in a localized area. We plotted the within-individual fluctuations of POMS_D and Act_V (Fig. 5) to indicate the feasibility of using OT signals for assessing the depressed mood state of healthy participants. While Act_V apparently fluctuated in parallel with POMS_D within individuals, we could not estimate its effectiveness or validity because the depressed mood state is a psychological construct and difficult to define. To uncover new ways of using optical topography to obtain a potential state marker for an individual's mood state, we need to further clarify the interactions between the depressed mood state and PFC activity on the basis of neurophysiology, such as by using a pharmacological approach.39, 40, 41 5.ConclusionWe demonstrated that prefrontal cortex activity during a verbal working memory task varies depending on the participant's depressed mood state, independent of trait factors. This suggests that using optical topography to measure PFC activity during a verbal WM task can be used as a potential state marker for an individual's depressed mood state. AcknowledgmentsWe thank Dr. Masashi Kiguchi, Dr. Atsushi Maki, and Dr. Kisou Kubota for their insightful comments and constructive suggestions during our discussions with them. We also thank Dr. Akiko N. Obata, Dr. Hirokazu Atsumori, Ms. Yukari Yamamoto, and Mr. Tsukasa Funane for their helpful support. ReferencesR. L. Mitchell and
L. H. Phillips,
“The psychological, neurochemical and functional neuroanatomical mediators of the effects of positive and negative mood on executive functions,”
Neuropsychologia, 45
(4), 617
–629
(2007). https://doi.org/10.1016/j.neuropsychologia.2006.06.030 Google Scholar
L. Pessoa,
“On the relationship between emotion and cognition,”
Nat. Rev. Neurosci., 9
(2), 148
–158
(2008). https://doi.org/10.1038/nrn2317 Google Scholar
E. I. Bartolic,
M. R. Basso,
B. K. Schefft,
T. Glauser, and
M. Titanic-Schefft,
“Effects of experimentally-induced emotional states on frontal lobe cognitive task performance,”
Neuropsychologia, 37
(6), 677
–683
(1999). https://doi.org/10.1016/S0028-3932(98)00123-7 Google Scholar
M. R. Basso,
B. K. Schefft,
M. D. Ris, and
W. N. Dember,
“Mood and global-local visual processing,”
J. Int. Neuropsychol. Soc., 2
(3), 249
–255
(1996). https://doi.org/10.1017/S1355617700001193 Google Scholar
N. A. Harrison,
L. Brydon,
C. Walker,
M. A. Gray,
A. Steptoe,
R. J. Dolan, and
H. D. Critchley,
“Neural origins of human sickness in interoceptive responses to inflammation,”
Biol Psychiatry, 66
(5), 415
–422
(2009). https://doi.org/10.1016/j.biopsych.2009.03.007 Google Scholar
S. Qin,
E. J. Hermans,
H. J. van Marle,
J. Luo, and
G. Fernandez,
“Acute psychological stress reduces working memory-related activity in the dorsolateral prefrontal cortex,”
Biol. Psychiatry, 66
(1), 25
–32
(2009). https://doi.org/10.1016/j.biopsych.2009.03.006 Google Scholar
M. Suda,
M. Fukuda,
T. Sato,
S. Iwata,
M. Song,
M. Kameyama, and
M. Mikuni,
“Subjective feeling of psychological fatigue is related to decreased reactivity in ventrolateral prefrontal cortex,”
Brain Res., 1252 152
–160
(2009). https://doi.org/10.1016/j.brainres.2008.11.077 Google Scholar
M. Suda,
T. Sato,
M. Kameyama,
M. Ito,
T. Suto,
Y. Yamagishi,
T. Uehara,
M. Fukuda, and
M. Mikuni,
“Decreased cortical reactivity underlies subjective daytime light sleepiness in healthy subjects: a multichannel near-infrared spectroscopy study,”
Neurosci. Res., 60
(3), 319
–326
(2008). https://doi.org/10.1016/j.neures.2007.12.001 Google Scholar
A. Maki,
Y. Yamashita,
Y. Ito,
E. Watanabe,
Y. Mayanagi, and
H. Koizumi,
“Spatial and temporal analysis of human motor activity using noninvasive NIR topography,”
Med. Phys., 22
(12), 1997
–2005
(1995). https://doi.org/10.1118/1.597496 Google Scholar
Y. Yamashita,
A. Maki,
Y. Ito,
E. Watanabe,
H. Mayanagi, and
H. Koizumi,
“Noninvasive near-infrared topography of human brain activity using intensity modulation spectroscopy,”
Opt. Eng., 35 1046
–1099
(1996). https://doi.org/10.1117/1.600721 Google Scholar
Y. Yamashita,
A. Maki, and
H. Koizumi,
“Measurement system for noninvasive dynamic optical topography,”
J. Biomed. Opt., 4
(4), 414
–417
(1999). https://doi.org/10.1117/1.429940 Google Scholar
R. Aoki,
H. Sato,
T. Katura,
K. Utsugi,
H. Koizumi,
R. Matsuda, and
A. Maki,
“Relationship of negative mood with prefrontal cortex activity during working memory tasks: An optical topography study,”
Neurosci. Res., 70 189
–196
(2011). https://doi.org/10.1016/j.neures.2011.02.011 Google Scholar
P. M. McNair,
M. Lorr, and
L. F. Dropplemen,
(1971). Google Scholar
K. Yokoyama,
S. Araki,
N. Kawakami, and
T. Takeshita,
“[Production of the Japanese edition of profile of mood states (POMS): assessment of reliability and validity],”
Nippon Koshu Eisei Zasshi, 37
(11), 913
–918
(1990). Google Scholar
D. M. McNair and
J. P. Heuchert, Profile of Mood States Technical Update, Multi-Health Systems, New York
(2003). Google Scholar
B. G. Berger and
R. W. Motl,
“Exercise and mood: a selective review and synthesis of research employing the Profile of Mood States,”
J. Appl. Sport Psychol., 12
(1), 69
–92
(2000). https://doi.org/10.1080/10413200008404214 Google Scholar
A. Duncan,
J. H. Meek,
M. Clemence,
C. E. Elwell,
L. Tyszczuk,
M. Cope, and
D. T. Delpy,
“Optical pathlength measurements on adult head, calf and forearm and the head of the newborn infant using phase resolved optical spectroscopy,”
Phys. Med. Biol., 40
(2), 295
–304
(1995). https://doi.org/10.1088/0031-9155/40/2/007 Google Scholar
M. S. Patterson,
B. Chance, and
B. C. Wilson,
“Time resolved reflectance and transmittance for the non-invasive measurement of tissue optical properties,”
Appl. Opt., 28
(12), 2331
–2336
(1989). https://doi.org/10.1364/AO.28.002331 Google Scholar
M. S. Patterson,
J. D. Moulton,
B. C. Wilson,
K. W. Berndt, and
J. R. Lakowicz,
“Frequency-domain reflectance for the determination of the scattering and absorption properties of tissue,”
Appl. Opt., 30
(31), 4474
–4476
(1991). https://doi.org/10.1364/AO.30.004474 Google Scholar
D. Contini,
A. Torricelli,
A. Pifferi,
L. Spinelli,
F. Paglia, and
R. Cubeddu,
“Multi-channel time-resolved system for functional near infrared spectroscopy,”
Opt. Express, 14
(12), 5418
–5432
(2006). https://doi.org/10.1364/OE.14.005418 Google Scholar
M. Kacprzak,
A. Liebert,
P. Sawosz,
N. Zolek, and
R. Maniewski,
“Time-resolved optical imager for assessment of cerebral oxygenation,”
J. Biomed. Opt., 12
(3), 034019
(2007). https://doi.org/10.1117/1.2743964 Google Scholar
H. Wabnitz,
M. Moeller,
A. Liebert,
H. Obrig,
J. Steinbrink, and
R. Macdonald,
“Time-resolved near-infrared spectroscopy and imaging of the adult human brain,”
Adv. Exp. Med. Biol., 662 143
–148
(2010). https://doi.org/10.1007/978-1-4419-1241-1 Google Scholar
T. Grossmann,
R. Oberecker,
S. P. Koch, and
A. D. Friederici,
“The developmental origins of voice processing in the human brain,”
Neuron, 65
(6), 852
–858
(2010). https://doi.org/10.1016/j.neuron.2010.03.001 Google Scholar
Y. Minagawa-Kawai,
H. van der Lely,
F. Ramus,
Y. Sato,
R. Mazuka, and
E. Dupoux,
“Optical brain imaging reveals general auditory and language-specific processing in early infant development,”
Cereb. Cortex, 21
(2), 254
–261
(2011). https://doi.org/10.1093/cercor/bhq082 Google Scholar
M. Pena,
A. Maki,
D. Kovacic,
G. Dehaene-Lambertz,
H. Koizumi,
F. Bouquet, and
J. Mehler,
“Sounds and silence: an optical topography study of language recognition at birth,”
Proc. Natl. Acad. Sci. U.S.A., 100
(20), 11702
–11705
(2003). https://doi.org/10.1073/pnas.1934290100 Google Scholar
H. Sato,
T. Takeuchi, and
K. L. Sakai,
“Temporal cortex activation during speech recognition: an optical topography study,”
Cognition, 73
(3), B55
–B66
(1999). https://doi.org/10.1016/S0010-0277(99)00060-8 Google Scholar
S. Tsujimoto,
T. Yamamoto,
H. Kawaguchi,
H. Koizumi, and
T. Sawaguchi,
“Prefrontal cortical activation associated with working memory in adults and preschool children: an event-related optical topography study,”
Cereb. Cortex, 14
(7), 703
–712
(2004). https://doi.org/10.1093/cercor/bhh030 Google Scholar
E. Watanabe,
A. Maki,
F. Kawaguchi,
K. Takashiro,
Y. Yamashita,
H. Koizumi, and
Y. Mayanagi,
“Non-invasive assessment of language dominance with near-infrared spectroscopic mapping,”
Neurosci. Lett., 256
(1), 49
–52
(1998). https://doi.org/10.1016/S0304-3940(98)00754-X Google Scholar
M. Okamoto and
I. Dan,
“Automated cortical projection of head-surface locations for transcranial functional brain mapping,”
Neuroimage, 26
(1), 18
–28
(2005). https://doi.org/10.1016/j.neuroimage.2005.01.018 Google Scholar
A. K. Singh,
M. Okamoto,
H. Dan,
V. Jurcak, and
I. Dan,
“Spatial registration of multichannel multi-subject fNIRS data to MNI space without MRI,”
Neuroimage, 27
(4), 842
–851
(2005). https://doi.org/10.1016/j.neuroimage.2005.05.019 Google Scholar
D. T. Delpy,
M. Cope,
P. van der Zee,
S. Arridge,
S. Wray, and
J. Wyatt,
“Estimation of optical pathlength through tissue from direct time of flight measurement,”
Phys. Med. Biol., 33
(12), 1433
–1442
(1988). https://doi.org/10.1088/0031-9155/33/12/008 Google Scholar
H. Sato,
M. Kiguchi,
F. Kawaguchi, and
A. Maki,
“Practicality of wavelength selection to improve signal-to-noise ratio in near-infrared spectroscopy,”
Neuroimage, 21
(4), 1554
–1562
(2004). https://doi.org/10.1016/j.neuroimage.2003.12.017 Google Scholar
H. Sato,
Y. Fuchino,
M. Kiguchi,
T. Katura,
A. Maki,
T. Yoro, and
H. Koizumi,
“Intersubject variability of near-infrared spectroscopy signals during sensorimotor cortex activation,”
J. Biomed. Opt., 10 044001
(2005). https://doi.org/10.1117/1.1960907 Google Scholar
H. Sato,
M. Kiguchi,
A. Maki,
Y. Fuchino,
A. Obata,
T. Yoro, and
H. Koizumi,
“Within-subject reproducibility of near-infrared spectroscopy signals in sensorimotor activation after 6 months,”
J. Biomed. Opt., 11
(1), 014021
(2006). https://doi.org/10.1117/1.2166632 Google Scholar
T. Katura,
H. Sato,
Y. Fuchino,
T. Yoshida,
H. Atsumori,
M. Kiguchi,
A. Maki,
M. Abe, and
N. Tanaka,
“Extracting task-related activation components from optical topography measurement using independent components analysis,”
J. Biomed. Opt., 13
(5), 054008
(2008). https://doi.org/10.1117/1.2981829 Google Scholar
E. E. Smith and
J. Jonides,
“Storage and executive processes in the frontal lobes,”
Science, 283
(5408), 1657
–1661
(1999). https://doi.org/10.1126/science.283.5408.1657 Google Scholar
S. Boden,
H. Obrig,
C. Kohncke,
H. Benav,
S. P. Koch, and
J. Steinbrink,
“The oxygenation response to functional stimulation: is there a physiological meaning to the lag between parameters?,”
Neuroimage, 36
(1), 100
–107
(2007). https://doi.org/10.1016/j.neuroimage.2007.01.045 Google Scholar
T. Takahashi,
Y. Takikawa,
R. Kawagoe,
S. Shibuya,
T. Iwano, and
S. Kitazawa,
“Influence of skin blood flow on near-infrared spectroscopy signals measured on the forehead during a verbal fluency task,”
Neuroimage, 57
(3), 991
–1002
(2011). https://doi.org/10.1016/j.neuroimage.2011.05.012 Google Scholar
F. G. Ashby,
A. M. Isen, and
A. U. Turken,
“A neuropsychological theory of positive affect and its influence on cognition,”
Psychol. Rev., 106
(3), 529
–550
(1999). https://doi.org/10.1037/0033-295X.106.3.529 Google Scholar
D. M. Barch,
“Pharmacological manipulation of human working memory,”
Psychopharmacology (Berlin), 174
(1), 126
–135
(2004). https://doi.org/10.1007/s00213-003-1732-3 Google Scholar
M. Luciana,
P. F. Collins, and
R. A. Depue,
“Opposing roles for dopamine and serotonin in the modulation of human spatial working memory functions,”
Cereb. Cortex, 8
(3), 218
–226
(1998). https://doi.org/10.1093/cercor/8.3.218 Google Scholar
|
||||||||||||||||||||||||||||||||||||||||||