|
|
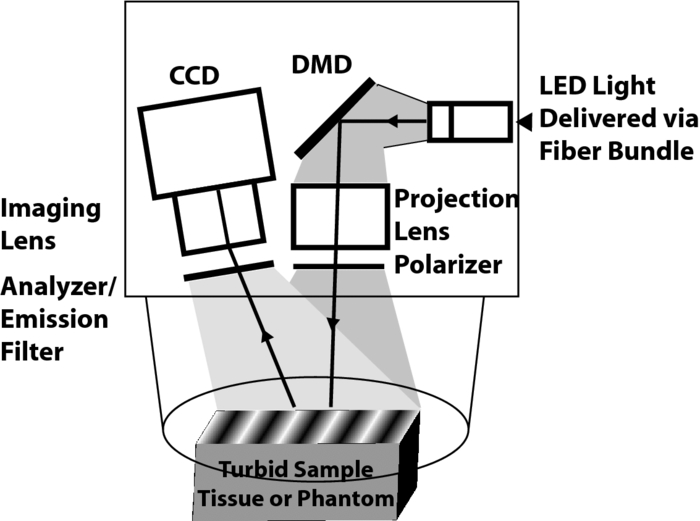
1.IntroductionIn typical bulk, epi-fluorescence imaging modalities, the magnitude of the fluorescence detected is inherently a function of the fluorophore concentration; however, it is also dependent on the optical properties of the tissue, namely absorption and reduced scattering. This optical property dependence occurs at both excitation and emission wavelengths. In general, the optical properties of the tissue at the excitation wavelength will influence the depth and distribution of the source within the tissue. This will determine the distribution of fluorescence generated within the tissue volume. Once fluorescence emission has been generated, the optical properties within the tissue at the emission wavelengths describe the likelihood of those photons exiting the tissue to be detected by the imaging system. To mitigate the potential variances introduced in the fluorescence signal by native tissue optical properties, ratiometric methods have been deployed;1, 2 however, these approaches remain most effective within a limited range of optical properties and/or in special cases.3, 4 One limiting factor to these approaches is the fact that they do not independently determine the optical properties of the tissue, but rather rely on either referential reflectance or autofluorescence measurements to compensate for native tissue effects. These approaches cannot decouple the effects of absorption and scattering and hence remain limited to only a small range where the relative contributions of these two independent factors do not stray from the basis set from which these methods have been either modeled or calibrated. Considerable effort from many researchers has led to approaches to decouple the effects of absorption and scattering in the time domain, frequency domain, and spatial domain.5 Recently, a time domain approach has been directly applied to address the issue of quantitative fluorescence imaging.6 Though this particular approach had to assume that all tissue in the field of view images maintained spatially homogeneous optical properties, strong correlations between the corrected fluorescence images and the bulk fluorophore concentration were produced. Spatial frequency domain imaging (SFDI) is another technique that enables quantitation of tissue optical properties. One distinct advantage of this approach, in terms of in vivo tissue imaging, is that it can be easily implemented in reflectance mode. It is capable of determining quantitative absorption and reduced scattering values on a pixel-by-pixel basis by measuring the response of tissue reflectance as a function of the sinusoidal spatial frequency encoded in the planar illumination projected onto tissue over the entire field of view of the imaging detector. This methodology has been described in detail elsewhere7 and has been implemented in studies in vivo (e.g., Refs. 8 and 9). With this particular approach, optical property images can be generated at the same resolution as the fluorescence images. Spatial heterogeneities in the tissue can hence be accounted for, further refining the accuracy of quantitative fluorescence imaging. It is our intent to 1. present experimental data from liquid phantoms of known, yet varying optical properties to validate the accuracy of a quantitative fluorescence imaging method that exploits SFDI's ability to spatially resolve quantitative optical properties of turbid media, and then 2. present an in vivo example to demonstrate its feasibility in a clinical setting. 2.Methods2.1.InstrumentationAn LED-based, digital micromirror device (Texas Instruments) projection system (Fig. 1) was used to provide both structured illumination at discrete wavelengths (630, 730, and 850 nm) for the determination of optical properties and provide planar illumination for fluorescence over a 30×40 mm field of view. A 12 bit CCD camera (Lumenera) is used to capture reflectance and fluorescence signals from the tissue. For SFDI, a cross polarization scheme blocks specular reflections. For fluorescence, the analyzer is replaced with a long-pass filter with a cut-off at 650 nm. The image plane of the CCD is matched to the same field of view of the projection. For SFDI measurements, six spatial frequencies (0 to 0.5 mm−1), are projected at three spatially shifted phases (0, 120, and 240 deg) per wavelength. Total acquisition times take approximately 4 s, but are allowed to vary in order to utilize the full dynamic range of the camera. A preset exposure of 2 s is used to acquire fluorescence images as a practical measure, though the full dynamic range of the camera was not exploited. 2.2.ModelWhile there are a variety of models available to render quantitative fluorescence information (e.g., Durkin 10), we decided to explore the model developed by Gardner for reasons that will be discussed.11 This model is an empirical approach for planar excitation fluorescence that accounts for the presence of tissue absorption and reduced scattering based off of semi-infinite, homogeneous Monte Carlo simulations. Assuming planar illumination, this model is simplified and reduced to a one-dimensional (1D) problem. Since SFDI is also based on planar illumination, these two models are easily integrated and can be applied to each image pixel. SFDI provides the μa and μs ′ at both excitation and emission wavelengths as inputs to Gardner's model that use these to correct the generation and existence of the fluorescence. In this model, the fluorescence correction factor, X 1D, is determined by the following: Eq. 1[TeX:] \documentclass[12pt]{minimal}\begin{document}\begin{eqnarray} \hspace*{-10pt}X_{{\rm 1D}} \left({\lambda _{{\rm ex}},\lambda _{{\rm em}} } \right) &=& \frac{{C_1 \left({\lambda _{{\rm ex}} } \right)C_{\rm 3} \left({\lambda _{{\rm em}} } \right)}}{{{{k_1 \left({\lambda _{{\rm ex}} } \right)} \mathord{/ {\vphantom {{k_1 \left({\lambda _{{\rm ex}} } \right)} {\delta \left({\lambda _{{\rm ex}} } \right) + {{k_3 \left({\lambda _{{\rm em}} } \right)} \mathord{/ {\vphantom {{k_3 \left({\lambda _{{\rm em}} } \right)} {\delta \left({\lambda _{{\rm em}} } \right)}}}\kern-\nulldelimiterspace} {\delta \left({\lambda _{{\rm em}} } \right)}}}}} \kern-\nulldelimiterspace} {\delta \left({\lambda _{{\rm ex}} } \right) + {{k_3 \left({\lambda _{{\rm em}} } \right)} \mathord{/ {\vphantom {{k_3 \left({\lambda _{{\rm em}} } \right)} {\delta \left({\lambda _{{\rm em}} } \right)}}} \kern-\nulldelimiterspace} {\delta \left({\lambda _{{\rm em}} } \right)}}}}}}\nonumber\\ && - \frac{{C_2 \left({\lambda _{{\rm ex}} } \right)C_3 \left({\lambda _{{\rm em}} } \right)}}{{{{k_2 \left({\lambda _{{\rm ex}} } \right)} \mathord{/ {\vphantom {{k_2 \left({\lambda _{{\rm ex}} } \right)} {\delta \left({\lambda _{{\rm ex}} } \right) + {{k_3 \left({\lambda _{{\rm em}} } \right)} \mathord{/ {\vphantom {{k_3 \left({\lambda _{{\rm em}} } \right)} {\delta \left({\lambda _{{\rm em}} } \right)}}} \kern-\nulldelimiterspace} {\delta \left({\lambda _{{\rm em}} } \right)}}}}} \kern-\nulldelimiterspace} {\delta \left({\lambda _{{\rm ex}} } \right) + {{k_3 \left({\lambda _{{\rm em}} } \right)} \mathord{/ {\vphantom {{k_3 \left({\lambda _{{\rm em}} } \right)} {\delta \left({\lambda _{{\rm em}} } \right)}}} \kern-\nulldelimiterspace} {\delta \left({\lambda _{{\rm em}} } \right)}}}}}}.\hspace*{10pt} \end{eqnarray}\end{document}The empirical coefficients, C n and k n are defined in Table 1 of the Gardner paper;11 however, they are dependent on the diffuse reflectance, R d. Since R d is a function of μ a, μ s ′ and index of refraction, it can be calculated from the values determined by SFDI using a Monte Carlo simulation. δ refers to optical penetration depth, which can be calculated directly: [TeX:] $\delta (\lambda) = {1 \mathord{/ {\vphantom {1 {\sqrt {3\mu _a \left(\lambda \right)\left[ {\mu _a \left(\lambda \right) + \mu _s ^\prime \left(\lambda \right)} \right]} }}} \kern-\nulldelimiterspace} {\sqrt {3\mu _a \left(\lambda \right)[ {\mu _a \left(\lambda \right) + \mu _s ^\prime \left(\lambda \right)}]} }}$ . In the validation study, coefficients were determined under the condition where n sample/n air = 1.33. In the in vivo study, an index condition of n sample/n air = 1.38 was employed. For the determination of the optical properties at the excitation wavelength (μa _ex, μs _ex ′), the SFDI results calculated at 630 nm can be plugged directly into this equation [Eq. 1]. The fluorescence emission detected by this instrument, however, is integrated across all wavelengths in the spectral emission band. To properly account for this, the emission spectrum-weighted average of both absorption and scattering would have to be determined. With a long pass filter at 650 nm in the system, we consider our signal detects emissions spanning 650 to 750 nm. Assuming that melanin, oxy-, and deoxy hemoglobin are the primary chromophores in skin tissue, we use the absorption results from all three wavelengths to determine chromophore concentration and subsequently estimate the average absorption value (〈μa〉em) within the 650 to 750 nm range. To estimate the average reduced scattering (〈μs ′〉em) in that range, we assume that it can be interpolated from the three measured wavelengths, as has been done by others.12 We have independently verified that tissue autofluorescence at 630 nm excitation does not contribute significantly to the spectrally integrated signal by measuring tissue fluorescence prior to the application of the photosensitizer. In fact, the autofluorescence was below the detection threshold of our instrument at 630 nm excitation, given the sensitivity and exposure times employed in our study. 3.Data Analysis and Results3.1.Liquid Phantom StudyA series of 16 liquid phantoms were prepared, varying concentrations of India ink (ProArt) as absorber, Intralipid® (20%, Fresenius Kabi) as scatterer, and PpIX (Spectrum Labs) as fluorescing agent. At each of the four concentrations of fluorophore (1, 3, 5, and 10 μg/ml), four combinations of India ink and intralipid concentrations were employed to provide a range of background optical properties in the presence of the PpIX. Table 1 shows the measured properties from differing concentrations of India ink and Intralipid for each concentration of PpIX. These phantoms were prepared from recipes developed by Kepshire 13 Each phantom was poured into a 10 × 8 mm deep cylindrical well surrounded by a diffuse silicone phantom and imaged in both SFDI and fluorescence modes. Since the absorption of India ink is relatively flat over the emission band of PpIX, 〈μa 〉em is assumed to be equivalent to the μ a calculated at 730 nm; 〈μs ′〉em, however, was calculated in the same manner as described above. Table 1Optical properties of phantoms for fluorescence correction method validation.
Figure 2a shows the average fluorescence signal detected from the phantom well. The error bars represent the variance of the signal as a result of the different optical properties. As expected, the total fluorescence signal exhibited a strong dependence on the optical properties present within the sample. Upon applying the empirical correction, the optical property dependence of the fluorescence signal is dramatically reduced. Figure 2b shows linear correlation between PpIX concentration and the corrected signal. By fitting a linear model to these results, this method can estimate PpIX concentration to ∼0.2 μg/ml across a relevant range in the context of topical ALA uptake in dermatological applications.13 Fig. 2(a) Raw fluorescence signals detected from liquid phantoms with differing concentrations of both absorber (India ink) and scatterers (Intralipid) present. (b) Corrected fluorescence signals based on measured optical properties at excitation and emission wavelengths.  It is worth noting that this method does begin to deviate from a linear response at high fluorophore concentration. This is a consequence of cross-talk in reflectance signal from the fluorescence generated. This instrument does not block fluorescence from contributing to the reflectance signal detected at the excitation wavelength. Given that the fluorescence signal is typically orders of magnitude weaker than the reflectance signal, for most concentrations of fluorophores, this contribution to the reflectance signal is within the noise of the measurement. At concentrations of 10 μg/ml, however, the fluorescence signal contributes ∼1% to 0.5% of the reflectance signal. In terms of SFDI, this detectable contribution will bias the absorption coefficient toward a smaller value. When the detected fluorescence is corrected by these biased optical properties, the model estimates a lower concentration of fluorophore. 3.2.In Vivo MeasurementTo demonstrate the viability of this method in vivo, one healthy subject was consented under an IRB approved study protocol (UCI HS# 2008-6439). In this study, topical ALA (Levulan Kerastick, DUSA Pharmaceuticals), was applied to a 2-cm diameter region of skin in the volar forearm [Fig. 3a]. The subject was imaged 7 hours after the application of the drug. Figure 3b shows the raw fluorescence image of the affected tissue and Fig. 3d shows that the same image corrected for the native tissue optical properties as well as calibrated for the instrument function provided by the liquid phantom validation study. Whereas the image map from the raw fluorescence is presented in terms of arbitrary units, the corrected image map is presented on a scale of μg/ml. This represents an image of drug concentration and distribution. In this particular case study, the drug concentration was determined to be ∼1.6 μg/ml. Fig. 3In vivo example. (a) Image of skin tissue (volar forearm) prior to application of topical ALA, (b) raw fluorescence image, 7 h after application of ALA, (scale bar: arbitrary units). (c) Correction map (1/X 1D) based on measured optical properties and (d) corrected fluorescence image (scale bar units: μg/ml). 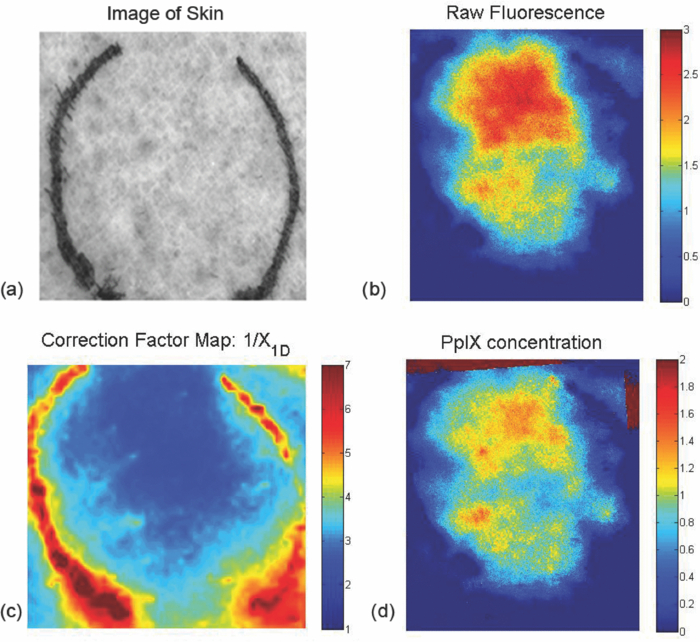 4.DiscussionIn phantom studies, we demonstrated the quantification of PpXI in the presence of range of optical properties without any a priori knowledge of optical properties or chromophore present. The calibration method begins to break down at PpIX concentrations of 10 μg/ml and higher; however, this is not a fundamental limitation of the computational method, but rather a limitation of the current instrument design. When imaging reflectance for the determination of optical properties, this instrument does not explicitly filter for fluorescence. While the instrument design can be improved to better isolate reflectance from fluorescence, literature has suggested that physiologically relevant concentrations of PpXI in skin (for cancerous and healthy tissue) remain within the range of 1 to 10 μg/ml.13 Though we do not have the means to independently confirm the concentration of PpIX in vivo, the results are consistent with expected values cited in literature.13 We also operate under the assumption that the quantum yield of PpIX in vivo is equivalent to the calibration set measured in intralipid, though it has been suggested that it may not be exactly the same.14 In this particular case, the addition of a spatially resolved optical property correction method did not yield dramatically different results from the raw image, since the normal skin imaged for this case study was not substantially heterogeneous. The correction factor image shows the native optical properties produced corrections that varied only ±15% [Fig. 3c]. Without accounting for this spatial variance in this seemingly benign case, the errors associated with this quantitative method would triple. Optical properties of a cancerous lesion may be more spatially heterogeneous. Through this spatially resolved, quantitative fluorescence imaging method, there is the opportunity to provide a more rigorous method to monitor the uptake of ALA and the spatial distribution of the drug. 5.ConclusionIn conclusion, we have presented an experimental method and instrumentation capable of determining spatially resolved, quantitative optical properties that can be used to describe light transport at both excitation and emission wavelengths, in addition to collecting fluorescence images over a 30 × 40 mm field of view. Using existing empirical models, raw fluorescence signals can be corrected by the intrinsic optical properties measured on a pixel by pixel basis. By decoupling fluorescence from other optical influences in tissue, this imaging modality can lead to improved identification of tumor margins in photodynamic detection techniques for surgical resection, as well as the assessment and monitoring of PpIX uptake for ALA-based PDT. AcknowledgmentsWe acknowledge funding and support from U.S. Army Medical Research, Award No. W81XWH-08-1-0086, Apogen Technologies, Inc., San Diego, California, NIH NCRR Biomedical Technology Research Center (LAMMP: 5P-41RR01192), Beckman Foundation. ReferencesA. Bogaards,
H. Sterenborg, and
B. Wilson,
“In vivo quantification of fluorescent molecular markers in real-time: A review to evaluate the performance of five existing methods,”
Photodiagn. Photodyn. Ther., 4
(3), 170
–178
(2007). https://doi.org/10.1016/j.pdpdt.2007.02.003 Google Scholar
A. Bogaards,
H. Sterenborg,
J. Trachtenberg,
B. Wilson, and
L. Lilge,
“In vivo quantification of fluorescent molecular markers in real-time by ratio imaging for diagnostic screening and image-guided surgery,”
Lasers Surg. Med., 39
(7), 605
–613
(2007). https://doi.org/10.1002/lsm.20525 Google Scholar
J. Svensson,
A. Johannson,
S. Gräfe,
B. Gitter,
T. Trebst,
N. Bendsoe,
S. Andersson-Engels, and
K. Svandberg,
“Tumor selectivity at short times following systemic administration of a liposomal temoporfin formulation in a murine tumor model,”
Photochem. Photobiol., 83
(5), 1211
–1219
(2007). https://doi.org/10.1111/j.1751-1097.2007.00146.x Google Scholar
G. Themelis,
J. S. Yoo,
K. S. Soh,
R. Schultz, and
V. Ntziachristos,
“Real-time intraoperative fluorescence imaging system using light-absorption correction,”
J. Biomed. Opt., 14
(6), 064012
(2009). https://doi.org/10.1117/1.3259362 Google Scholar
H. Xie,
H. Liu,
P. Svenmarker,
J. Axelsson,
C. T. Xu,
S. Gräfe,
J. H. Lundeman,
H. P. H. Cheng,
S. Svanberg,
N. Bendsoe,
P. E. Andersen,
K. Svanberg, and
S. Andersson-Engels,
“Drug quantification in turbid media by fluorescence imaging combined with light-absorption correction using white Monte Carlo simulations,”
J. Biomed. Opt., 16 066002
(2011). https://doi.org/10.1117/1.3585675 Google Scholar
A. P. Gibson,
J. C. Hebden, and
S. R. Arridge,
“Recent advances in diffuse optical imaging,”
Phys. Med. Biol., 50 R1
–R43
(2005). https://doi.org/10.1088/0031-9155/50/4/R01 Google Scholar
D. J. Cuccia,
F. Bevilacqua,
A. J. Durkin,
F. R. Ayers, and
B. J. Tromberg,
“Quantitation and mapping of tissue optical properties using modulated imaging,”
J. Biomed. Opt., 14
(2), 024012
(2009). https://doi.org/10.1117/1.3088140 Google Scholar
A. Mazhar,
S. Dell,
D. J. Cuccia,
S. Gioux,
A. J. Durkin,
J. V. Frangioni, and
B. J. Tromberg,
“Wavelength optimization for rapid chromophore mapping using spatial frequency domain imaging,”
J. Biomed. Opt., 15
(6), 061716
(2010). https://doi.org/10.1117/1.3523373 Google Scholar
A. Yafi,
T. Vetter,
T. Scholz,
S. Patel,
R. B. Saager,
D. J. Cuccia,
G. R. Evans, and
A. J. Durkin,
“Postoperative quantitative assessment of reconstructive tissue status in a cutaneous flap model using spatial frequency domain imaging,”
Plastic Recon. Surg., 127
(1), 117
–130
(2011). https://doi.org/10.1097/PRS.0b013e3181f959cc Google Scholar
A. J. Durkin,
S. Jaikumar,
N. Ramanujam, and
R. Richards-Kortum,
“Relation between fluorescence spectra of dilute and turbid samples,”
Appl. Opt., 33 414
–423
(1994). https://doi.org/10.1364/AO.33.000414 Google Scholar
C. Gardner,
S. Jacques, and
A. Welch,
“Fluorescence spectroscopy of tissue: recovery of intrinsic fluorescence from measured fluorescence,”
Appl. Opt., 35 1780
–1792
(1996). https://doi.org/10.1364/AO.35.001780 Google Scholar
F. Bevilacqua,
A. Berger,
A. Cerussi,
D. Jakubowski, and
B. Tromberg,
“Broadband absorption spectroscopy in turbid media by combined frequency-domain and steady-state methods,”
Appl. Opt., 39 6498
–6507
(2000). https://doi.org/10.1364/AO.39.006498 Google Scholar
D. Kepshire,
S. C. Davis,
H. Dehghani,
K. D. Paulsen, and
B. W. Pogue,
“Fluorescence tomography characterization for sub-surface imaging with protoporphyrin IX,”
Opt. Express, 16
(12), 8581
–8593
(2008). https://doi.org/10.1364/OE.16.008581 Google Scholar
A. Kim,
M. Khurana,
Y. Moriyama, and
B. C. Wilson,
“Quantification of in vivo fluorescence decoupled from the effects of tissue optical properties using fiber-optic spectroscopy measurements,”
J. Biomed. Opt., 15
(6), 067006
(2010). https://doi.org/10.1117/1.3523616 Google Scholar
|
||||||||||||||||||||||||||||||