
|
|
1.Introduction-ATP synthases are the ubiquitous enzymes that catalyze the formation of adenosine triphosphate (ATP) from adenosine diphosphate (ADP) and phosphate. The molecular machines are found in the inner membrane of mitochondria, in the thylakoid membrane of chloroplasts, and in the plasma membrane of bacteria.1,2 The multisubunit enzyme consists of two major parts, a membrane-bound and a hydrophilic . In Escherichia coli, the part consists of the - and dimeric -subunits and a ring of 10 -subunits.3,4 The hydrophilic part comprises five different subunits with stoichiometry .5 It contains three catalytic and three non-catalytic nucleotide binding sites resulting in an apparently threefold symmetry as shown in Fig. 1. Fig. 1(a) Model of the membrane-embedded -ATP synthase with the static subunits in light grey and the rotor subunits in dark grey. The position of the FRET donor EGFP on the nonrotating -subunit is indicated as a blue square, of Alexa532 on as a green dot and of Cy5 on one -subunit as a red dot. (b) Enlarged model of the internal distance changes in the rotor with respect to the reference EGFP. Stepwise elastic deformations are highlighted by orange arrows between a selected -position indicated by green 1 and three -positions shown in red. (c) Measurement principle with three overlayed laser foci and a freely diffusing liposome containing the triple-labeled -ATP synthase. 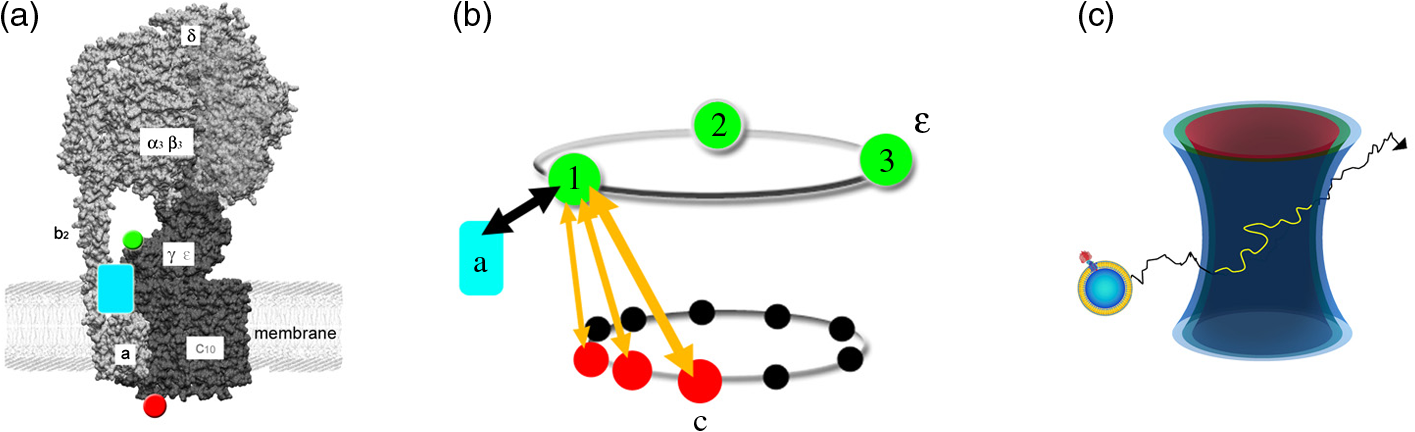 -ATP synthase acts as a coupled rotary double motor which transforms electrochemical into chemical energy by mechanical rotation of subunits.6,7 In E. coli, a proton concentration gradient across the membrane in combination with an electric potential drives the rotation of the -ring.8 Briefly, protons are translocated from the periplasma to the cytoplasma using a entry half-channel in the -subunit to bind to an empty binding site on an adjacent -subunit.9 Neutralizing and reforming the electric charges on the -subunits induce the rotation of the -ring, whereas, at the exit half-channel of the -subunit, proton release from the -subunit regenerates the negative charge.10 Stepwise rotary motion of the -ring has been demonstrated for ATP hydrolysis and synthesis by biochemical methods11,12 and, recently, by single-molecule microscopy approaches.8,13–16 Rotation of the -ring is transmitted to the connected central stalk comprising the and subunits of the part. Due to the asymmetric structure of rotation causes large conformational changes in the three pairs of subunits which open and close the nucleotide binding sites located at the interface. Each of the pairs is in one of three conformations and rotation of is thought to trigger conformational transitions of all three pairs simultaneously during catalysis.17,18 A single binding site sequentially changes its conformation or nucleotide binding affinity in the order of ‘open’ to ‘tight’ to ‘loose’ in the case of ATP synthesis.19 The diameter of the part is about 10 nm and the conformational changes in the pairs are large enough to be measured as a change in hydrodynamic radius upon nucleotide binding.20,21 Strong positive cooperativities for both nucleotide binding and catalytic rates initiated the concept of the binding change mechanism, driven and tightly controlled by the rotation of the -subunit in . Following biochemical and spectroscopy experiments,22 the first single-molecule experiments with the isolated parts provided unequivocal evidence for -subunit rotation during ATP hydrolysis.23 Therefore, a fluorescent actin filament was attached to the -subunit with the part immobilized to a glass surface. Video microscopy showed the rotation of the actin filament in discrete 120 deg steps. Lower ATP concentrations and a smaller marker on allowed the resolution of two substeps of 80 and 40 deg during ATP hydrolysis by laser dark-field microscopy.24,25 To monitor subunit rotation in the holoenzyme -ATP synthase during ATP synthesis conditions, reconstitution into a lipid bilayer or a lipid vesicle known as a liposome is required. Mixing buffers with different pH and concentrations can be used to generate the appropriate proton motive force to drive ATP synthesis.26,27 Thus, an alternative approach was developed to observe subunit rotation and conformational changes in single -ATP synthases in liposomes. The rotation measurement is based on Förster-type resonance energy transfer between two fluorophores covalently attached to specific positions.28–30 Rotation is associated with distance changes between the two fluorophores resulting in characteristic fluctuations of the FRET efficiency. In the first experiments, the two fluorophores acting as FRET donor and acceptor were attached to the static -subunits and the rotating -subunit of -ATP synthase.31 Single enzymes reconstituted in liposomes freely diffused through a confocal laser excitation volume and generated a burst of photons. Within an individual photon burst, FRET efficiency fluctuations indicated three-stepped rotation of and at high driving forces, the opposite direction of rotation for ATP hydrolysis and synthesis, and asymmetry of catalytic activities or dwell times of the three nucleotide binding sites. Using a similar approach, the step size of the -ring rotation in was determined to 36 deg in ATP synthesis direction.8 These experiments have shown that the step sizes of the two motors in -ATP synthase have an intrinsic mismatch. It is necessary to answer the questions where and how the enzyme stores elastic deformation energy to accommodate this mismatch.32–34 In a first model, it was assumed that the free energy of nucleotide binding is converted into elastic strain with a mechanical efficiency of almost 100 percent. The torque produced in the part was estimated to . The -subunit, with its intertwined helices, acts as a torsional spring within and couples both parts of the enzyme. The spring is loaded in four steps by rotation of the -ring and releases the tension by liberation of one synthesized ATP molecule. Thus, elastic deformations within the rotor domain are predicted. To study both rotary motions within a single enzyme simultaneously, we present a new FRET approach with triple-labeled -ATP synthases. To map the elastic deformations by FRET, one fluorophore was attached to the rotary -subunit in and the other to one rotary -subunit of the part. To ensure the overall operation of the two motors during catalysis, a third reference label at the static -subunit was used. Thus, we could resolve the 120 deg rotation in as well as the 36 deg steps in in one experiment. Conformational changes were expected to result in a sequence of distance changes between these three fluorophores. We developed a duty cycle-optimized alternating laser excitation scheme35 with pulsed and switched lasers36,37 and resolved the degree of elastic deformations within -ATP synthases during ATP hydrolysis and ATP synthesis. 2.Materials and MethodsFor the triple-FRET measurements, three different fluorophores had to be attached specifically to each -ATP synthase. We used genetically introduced reactive cysteines and a fusion of an autofluorescent protein for the labeling procedures. Descriptions of plasmid constructions for the two E. coli -ATP synthase mutants, as well as cell growth conditions, purification and labeling of the enzymes have been published previously.8,38,39 The triple-labeled -ATP synthase has been obtained as follows. Initially, a double mutant with two fluorophores in the membrane-bound part comprised a genetic fusion of enhanced green fluorescent protein, referred to as EGFP, to the C terminus of the -subunit. Thus, each enzyme contained the fluorophore EGFP. At the -subunit, the double mutant included a reactive cysteine near the N terminus as residue -cys, which was labeled with the FRET acceptor Cy5-monomaleimide. Labeling of the -ring with Cy5 was accomplished with detergent-solubilized -ATP synthase. Labeling efficiency of 7.4% was determined by UV-Vis absorption spectroscopy using EGFP absorbance as an internal protein concentration reference. The double-labeled enzymes were reconstituted to an excess of pre-formed liposomes consisting of 90% phosphatidylcholine and 10% phosphatidic acid with a mean diameter of about 150 nm.8 Secondly, a different -ATP synthase mutant with a reactive cysteine in the -subunit had to be used to introduce the third fluorophore specifically. The hydrophilic soluble part was prepared separately as described.38 The rotating -subunit in was labeled at residue position 56 with Alexa532-maleimide. Finally, the unlabeled part of the reconstituted double mutant was replaced by an Alexa532-labeled part. parts were stripped off in a buffer without and in the presence of EDTA. Alexa532-labeled was rebound to in liposomes in the presence of .31 To control the replacement of , ATP synthesis rates were measured after every preparation step. The triple-labeled enzymes achieved ATP synthesis rates up to at 23°C. Aliquots of 2 μl of the reconstituted triple-labeled -ATP synthases were shockfrozen in liquid nitrogen and stored at until use. A custom-made confocal microscope setup based on an Olympus IX 71 was used40,41 for the triple-FRET measurements with single -ATP synthases. Three different lasers were applied: two fiber coupled picosecond pulsed lasers with arbitrary repetition rates up to 80 MHz at 488 nm (PicoTa 490, Picoquant) and 635 nm (LDH-P-635B, Picoquant) were used, and the third, continuous wave laser at 532 nm (compass 315, Coherent) was switched by a fast acusto optical modulator (AOM type 335-192, Crystal Technologies). All three laser sources were externally triggered and synchronized by an arbitrary waveform generator (AWG 2041, Tektronix) in order to get the required duty cycle-optimized alternating laser excitation scheme as shown in Fig. 2. The three laser beams were combined to provide a common confocal excitation volume, as illustrated in Fig. 1, using two dichroic beam splitters (DCXR 488 and DC 540, AHF Tübingen). To determine and adjust the exact position of each of the confocal laser spots, a sample of polychromatic polystyrene beads (transfluospheres 488–635, Molecular Probes) embedded in a thin poly-vinyl-alcohol (PVA) film was used. After scanning an area of using a piezo-driven scan stage (P-517.2CD and PiFoc P-725.1CD, Physik Instrumente), the center of one polystyrene bead was determined with a fit algorithm using Gaussians to an accuracy of 20 nm. Subsequently, the alignment of the laser foci was improved. However, for the triple-FRET analysis, the three dimensional laser foci alignment was not very critical (in contrast to quantitative fluorescence cross correlation spectroscopy), because we probed the FRET changes for enzyme activity with 488 nm excitation qualitatively. If FRET is successfully detected within a photon burst, the FRET-based twisting of the rotor was analyzed quantitatively following 532 nm excitation. Start and end of a photon burst were defined by fluorescence intensity thresholds upon 532 nm excitation. Fig. 2(a) Scheme of the experimental confocal setup with up to three lasers operated in a duty cycle-optimized alternating mode. (b) Generation of two synchronized time trajectories with 2 ms time resolution based on the respective exciting lasers in a 96 ns pulse sequence. Left panel: three pulses at 488 nm in the micro time window from 0 to 43 ns for FRET donor EGFP are followed by a single AOM-switched excitation with 532 nm in the micro time window from 43 to 96 ns for FRET donor Alexa532. The upper panel to the right shows the micro time assigned photons for the FRET distance measurement within the rotor. FRET donor Alexa532 was excited with 532 nm and is shown in cyan plus FRET acceptor Cy5 in red. The lower panel shows the overall rotation test with respect to the external EGFP position. EGFP fluorescence was excited by the 488 nm laser pulses and is shown as blue trace, plus Alexa532/Cy5 as green trace.  The confocal volumes were enlarged in order to prolong the observation time of single enzymes by compressing all three laser beam diameters with pairs of lenses. The epi-fluorescent port was used to enter the confocal microscope. Beams were reflected by a dichroic beam splitter (triple-band 488/532/633, AHF Tübingen) and focused into the buffer droplet by a water immersion objective (UPlanSApo 60×W, 1.2 N.A., Olympus). Fluorescence passed a 150 μm pinhole and was split into three different detection channels by two consecutive dichroic beam splitters (DCXR 532 and DCXR 630, AHF Tübingen). Photons were simultaneously detected by three avalanche photodiodes (AQR-14, Perkin Elmer). In the first channel, EGFP fluorescence was detected between 504 and 532 nm (HQ 513/17, AHF). In the second channel, Alexa532 fluorescence was detected between 545 and 625 nm (HQ 585/80, AHF). In the third channel, Cy5 fluorescence was detected between 663 and 737 nm (HQ 700/75, AHF). Single photons were recorded with three synchronized TCSPC cards (SPC 153, Becker & Hickl) and in parallel by a multichannel counter card for imaging (NI-PCI 6602, National Instruments). The three different photon time trajectories were analyzed and recombined by the software package “Burst_Analyzer” which was written by Zarrabi.42 With this program, it was possible to sort the photons into the correct time window associated with the applied excitation laser pulse as shown in Fig. 2. Photon bursts of triple-labeled -ATP synthases were identified automatically based on intensity thresholds and analyzed manually to identify FRET efficiency fluctuations. 3.Results3.1.Preparation of the Triple-labeled -ATP SynthaseTo map the elastic conformational deformations within the rotary double motor of -ATP synthase, two amino acids were specifically labeled with the fluorophores Alexa532 and Cy5 for intramolecular FRET distance measurements. Alexa532 was attached to the -subunit of the part using a genetically introduced cysteine at residue position . The position within the enzyme is marked as a green dot in Figs. 1(a) and 1(b). The cysteine mutation in had been used previously for single-molecule FRET studies38,39,42 and did not affect the catalytic activity of the enzyme. In our experiments, specificity of labeling was achieved by labeling the part separately with a labeling efficiency of about 35% according to UV-Vis absorbance measurements. The FRET acceptor Cy5 was attached to one -subunit in the part using the same maleimide-cysteine chemistry. Thus, Cy5 labeling required a different -ATP synthase mutant without reactive cysteines in . We used our recently described double mutant8 comprising a cysteine mutation to the -subunits at residue and the fusion of the EGFP to the C terminus of the proton translocating -subunit of the part. This double mutant exhibited good catalytic activities. Careful substoichiometric labeling conditions with a Cy5: enzyme ratio of about were applied to avoid labeling of multiple -subunits in a single part. The positions of Cy5 in the model of E. coli -ATP synthase are shown as red dots in Figs. 1(a) and 1(b). Importantly, a variety of distances between the Alexa532 position on and Cy5 on are to be expected because we cannot control which of the 10 -subunits will be labeled. To obtain the triple-labeled -ATP synthase, the non-labeled part of the EGFP-Cy5-labeled had to be exchanged by the separately prepared Alexa532-labeled . Therefore, the EGFP-Cy5-labeled enzymes were reconstituted into liposomes, so that could be removed through reversible dissociation in the absence of ions in the buffer. Subsequently, Alexa532-labeled was re-attached to in the presence of .31,38 Unbound excess Alexa532-labeled was separated and removed by several consecutive ultracentrifugation steps. 3.2.Confocal Duty Cycle-optimized Alternating Laser Excitation Scheme for Triple-FRETEach -ATP synthase contained an EGFP fluorophore. However, only a small fraction of all reconstituted proteins were triple-labeled enzymes. This was limited by the labeling efficiencies for Alexa532 on and for Cy5 on . It was necessary to identify appropriately labeled enzymes in the time trajectories of freely diffusing single proteoliposomes in buffer solution. This was accomplished by alternating laser excitation for each fluorophore in the same confocal volume as shown in Fig. 1(c). A picosecond pulsed laser diode at 488 nm was used to excite EGFP, an 532 nm laser was switched by an acousto optical modulator to excite Alexa532, and a pulsed laserdiode at 635 nm excited Cy5. The use of two consecutive dichroic beam splitters in the excitation pathway enabled the alignment of all three laser beams. The three-laser approach was applied in initial experiments to identify the fraction of triple-labeled -ATP synthases as shown in Fig. 2(a).35 For the triple-FRET experiments in the presence of ATP and during ATP synthesis, it was revealed that optimized alternating excitation with two lasers at 488 and 532 nm was sufficient to identify the triple-labeled enzymes. Triggering one laser and switching one acousto optical modulator, referred to as AOM, was accomplished by a programmable arbitrary waveform generator with 1 ns time resolution and 8 output channels for synchronization. Sequences of three 488 nm pulses, each delayed by 12 ns, proceeded one AOM switching cycle of the 532 nm laser for 60 ns. The overall cycle time was 96 ns as shown in Fig. 2(b). With this excitation scheme, the number of photons detected in the EGFP channel could be maximized while maintaining a separated and long on-time for 532 nm excitation. The excitation optimization was necessary because the narrow interference filter in the EGFP channel resulted in a reduced detection efficiency of only in contrast to our previous FRET measurements with a different filter .39 In single molecule detection, increasing the excitation power causes increased photobleaching probabilities and populates the non-fluorescent dark triplet state of the fluorophore.43 Therefore, peak powers of pulsed lasers must be low, but repetition rates can be high. Switching a cw-laser on and off is limited by the switching times of the AOM and, for the off-switching, by the fluorescence lifetime of the dye. Accordingly, fluorescence intensities of single fluorophores are maximized by long continuous on-times of the laser. Because we were searching for fluctuations in the FRET distance measurement between Alexa532 and Cy5 as the important information, we could reduce the duty cycle for the FRET measurement of the catalytic turnover or overall rotor motion in -ATP synthases, i.e., between EGFP on the static -subunit and the two other dyes being the combined FRET acceptors on the rotary subunits. Briefly, about an 1-to-2 excitation ratio for the FRET measurement of rotation, versus , and the FRET measurement of associated elastic deformations within the rotor, versus was found to be a good compromise with high photon count rates for both FRET measurements. 3.3.Generating the Two Synchronized Time Trajectories for Elastic Deformation AnalysisThe duty cycle-optimized alternating excitation scheme allowed to sort the detected photons with respect to the exciting laser. The arbitrary waveform generator not only triggered the two lasers but also set the time base of 96 ns cycle time for the synchronized TCSPC electronics. All photons detected in the first 43 ns of the cycle were attributed to 488 nm excitation for EGFP fluorescence in the FRET donor channel 1 and Alexa532 in channel 2 plus Cy5 in channel 3. Photons in the three detection channels were binned to 1 ms time intervals to generate the time trajectories for FRET analysis as shown by the blue and green traces in Fig. 2(b). Due to the filter characteristics for the Alexa532 detection channel 2, a large Raman scattering signal dominated the photon count rate following 488 nm excitation pulses. Therefore, we cut off the Raman scatter using micro time windows after the 488 nm pulse. For the FRET acceptor time trajectory, mainly Cy5 photons in channel 3 could be used in addition to few photons from Alexa532. Because of a mixed contribution of both fluorophores acting as FRET acceptors for EGFP, a distance calculation based on corrected FRET efficiencies was not possible. Instead we used an apparent proximity factor with fluorescence intensities in the three detection channels corrected for remaining background. A stepwise proximity factor change within a single photon burst could be used to unequivocally indicate a catalytically active rotary -ATP synthases at work. Similarly, photons in the micro time window between 43 and 96 ns in the 532 nm excitation cycle were binned to 1 ms time intervals. Initially, FRET time trajectories were calculated using background subtraction of 2 kHz for the FRET donor Alexa532 and of 1 kHz for the FRET acceptor Cy5. Given the fluorescence quantum yields of the dyes ( for Alexa532, for Cy5) and the detection efficiencies of our microscope setup ( for Alexa532; for Cy5), cross talk of donor fluorescence detected in the acceptor channel of 2.26% and vice versa of 0.01% was compensated. Detection efficiencies of the fluorophores were computed by multiplying the spectral filter characteristics of beam splitters, dichroics, interference filters and the spectral sensitivity of the APDs with the fluorescence spectra of the dyes as described previously.31,40 The correction factor comprises both detection efficiencies and quantum yields. Thus, we determined the FRET efficiency quantitatively using the calculated correction factor . Next, we calculated the actual distance as a distance time trajectory based on the software “FRET TRACE” which was developed by Schröder and Grubmüller,44 and implemented in our software “Burst_Analyzer.” This probability calculation of distance changes enabled us to increase the apparent time resolution from 1 ms binning to 100 μs shown in the upper panels in Figs. 3 and 4 and, therefore, to identify the distance changes more convincingly in a manual analysis. Fig. 3(a–e) Photon bursts of triple-labeled -ATP synthases during ATP hydrolysis with 1 ms binning. In the lowest panel overall rotation is controlled by changes of the relative intensities of FRET donor EGFP upon 488 nm excitation, indicated by a blue trace, and Alexa532/Cy5 as green trace. In the penultimate panel the calculated proximity factor trace is shown in grey. The panel with Alexa532 and Cy5 traces shows the corresponding fluorescence intensities upon 532 nm excitation. The upper panel depicts the calculated FRET distance between Alexa532 and Cy5 using the program “FRET_Trace.”44 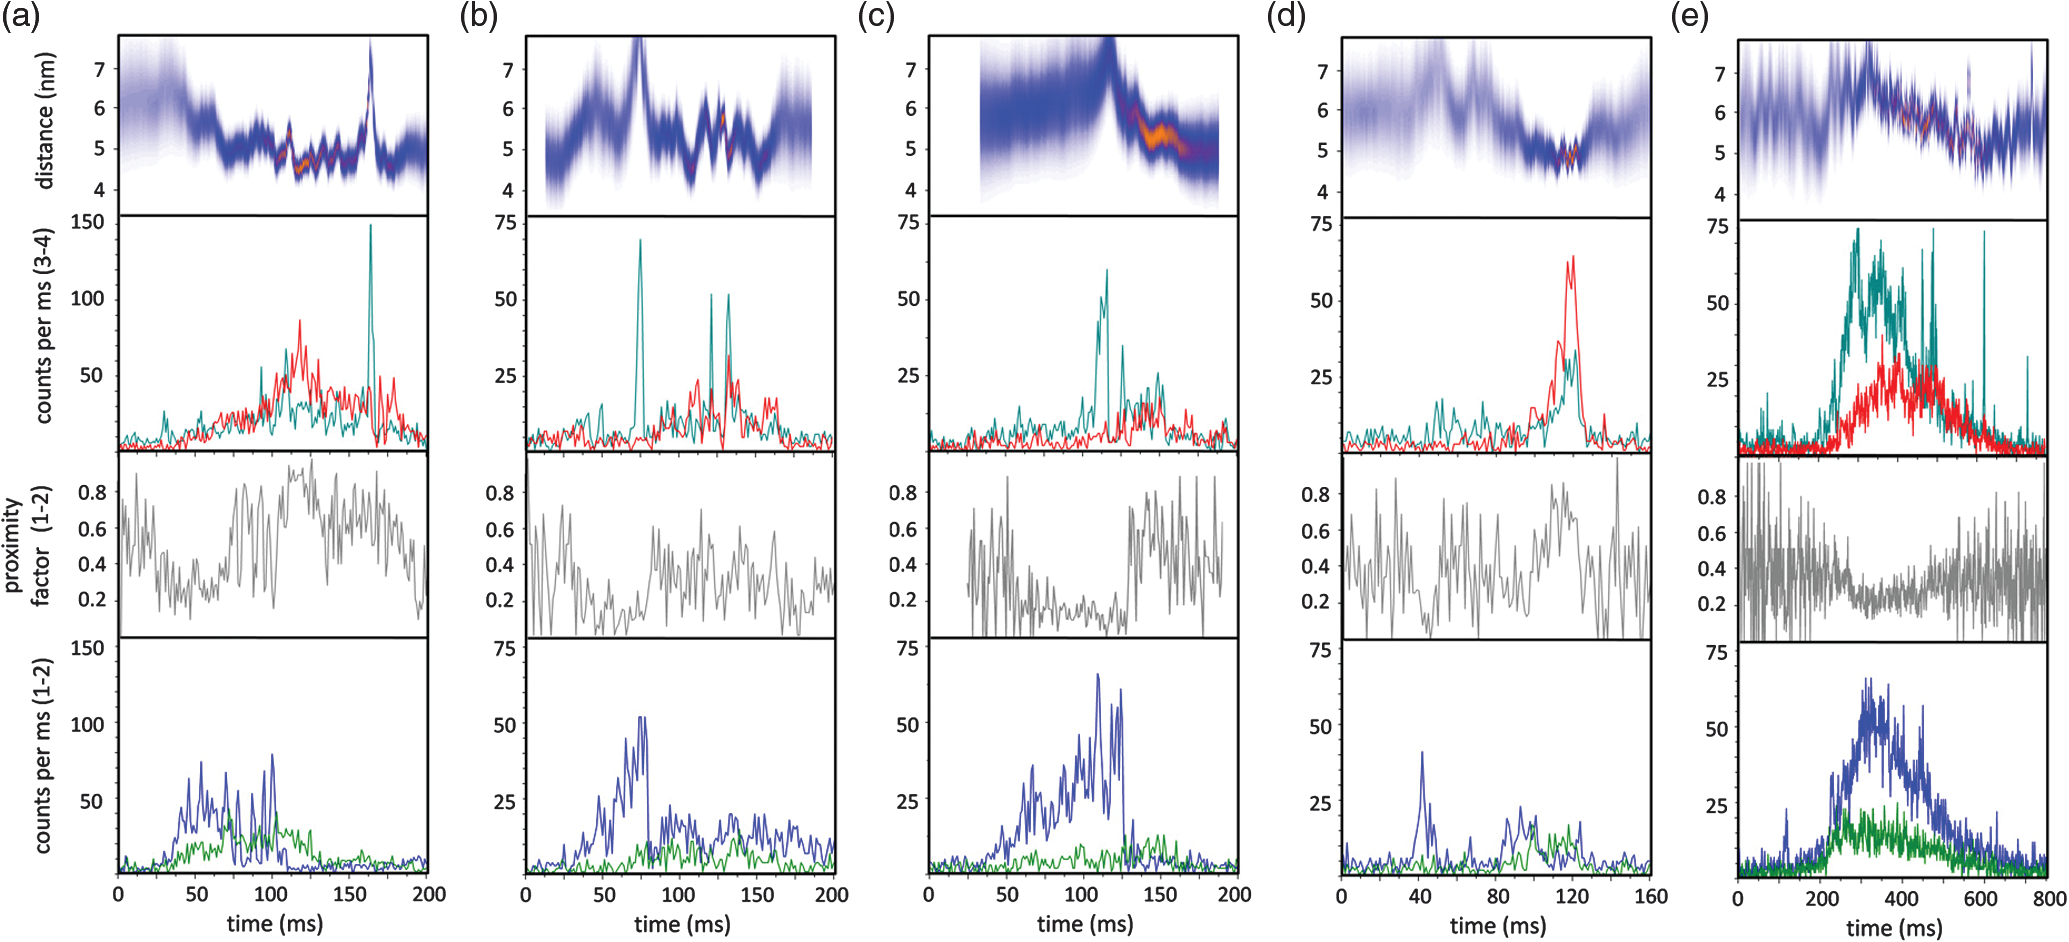 Fig. 4(a–e) Photon bursts of triple-labeled -ATP synthases during ATP synthesis with 1 ms binning. Overall subunit rotation is controlled by changes of the relative intensities of FRET donor EGFP upon 488 nm excitation, indicated by a blue trace and Alexa532/Cy5, indicated by a green trace, in the lowest panel. In the penultimate panel the calculated proximity factor trace is shown in grey. The panel with Alexa532 and Cy5 traces shows the corresponding fluorescence intensities upon 532 nm excitation. The upper panel depicts the calculated FRET distance between Alexa532 and Cy5 using the program “FRET_Trace.”44  3.4.Elastic Deformations Between and During ATP HydrolysisHaving sorted the single photons from the three fluorophores to the two time traces, we searched for photon burst showing all three dyes attached to a -ATP synthase in the presence of 1 mM ATP. Within a single photon burst, the proximity factor trace had to show stepwise changes indicating the common rotational movement of the rotor subunits and with respect to the static -subunit. As shown in Fig. 3(a), the relative fluorescence intensities of EGFP, shown by the blue trace in lowest panel, and the sum of Alexa532 and Cy5, indicated by the green trace in lowest panel, changed stepwise. After 70 ms, a low mean proximity factor, , switched to a medium value of with strong fluctuations. At approximately 105 ms, another stepwise change of the proximity factor to was detected until the -ATP synthase diffused out of the laser focus after 200 ms. These proximity factor changes indicated the overall rotation of the - and -subunits. We then analyzed the corresponding FRET efficiency changes within this burst by examining the intensities of Alexa532 and Cy5 when excited with 532 nm. As seen in the distance trajectories, indicated by the bluish trace in upper panel, the internal distance between the donor on and the acceptor on one of the -subunits was initially about 5.2 nm for 60 ms. Just before the time when the rotor moved stepwise, this distance changed as well from 5.2 to 4.5 nm. At the second step of the rotor at 105 ms, the mean - distance also changed from about 4.6 to 4.1 nm. For a given rotor state, the - distance clearly fluctuated back and forth as seen in the anticorrelated donor and acceptor fluorescence intensities. For example, the ε-c distances fluctuated in the time window from 105 ms to 170 ms in the range from 4.0 to 4.6 nm for the high FRET orientation with , or from 105 to 170 ms. Therefore, internal elastic changes of the rotor were observed in an enzyme showing the overall rotation of the motor. Figure 3(b) shows a similar behaviour of a single -ATP synthase during ATP hydrolysis. The proximity factor trace in Fig. 3(b), shown in grey in penultimate panel, corresponded to fast rotation of the rotor and the - distance fluctuated between 4.2 and 5.5 nm. In Fig. 3(c) a clear stepping of the rotor was detected according to the proximity factor changes from low FRET for the first 130 ms to a short medium FRET state and a high FRET state was detected. The - distance changed near the turning point of the rotor. In Fig. 3(d), the -ATP synthase time trajectory was analyzed only between 80 ms to 140 ms showing again the proximity factor changes from low to medium to high FRET. Associated with the stepping of the rotor, we found fluctuations between 4.2 and 4.6 nm of the - distance. Again, the overall rotation of the motor was detected in the proximity factors trace, and correlated with the elastic deformations between and . Conversely, the enzyme in Fig. 3(e) showed clearly detectable distance changes between the two coupled rotor subunits. The proximity factor maintained a value of throughout the photon burst. However, a continuous decrease of the --distance was observed. The interpretation remains unclear at this point. 3.5.Elastic Deformations Between and During ATP SynthesisUsing the reconstituted -ATP synthase, we not only increased the observation time in the confocal volume, but we could also generate the necessary proton motive force to drive the enzyme in ATP synthesis direction. Equilibration of the proteoliposomes in an acidic pH 4.7 yielded a high proton concentration within the liposomes. Mixing these liposomes with a basic buffer at pH 8.8 and with high [] established the PMF immediately before the FRET measurements. In the presence of 100 μm ADP plus 5 mM phosphate, ATP synthesis resulted in step wise changes of the proximity factor within a single -ATP synthase trajectory. As shown for an active enzyme in Fig. 4(a), the rotor was in a low FRET orientation with a mean before changing to after 65 ms, and changing again to after 90 ms. The - distance fluctuated from 5.0 to 6.0 nm during the medium FRET orientation of before it switched to 4.0 nm at about 100 ms. Other enzymes showed a less pronounced fluctuation of the internal rotor distances. In Fig. 4(b), the distances did not fluctuate while the rotor showed large changes in the proximity factor trace. The -ATP synthase in Fig. 4(c) exhibited the step wise rotor motion with - distances fluctuating slightly between 5.1 and 5.5 nm. In Fig. 4(d), the distance fluctuations between 4.2 and 4.8 nm were associated with changes in the proximity factor trace of the active enzyme. Similarly, the enzyme in Fig. 4(e) showed fluctuations in the - distances associated with an overall rotary motion during ATP synthesis conditions. 3.6.Simulations of Elastic Deformations Between andHow to analyze the triple-FRET trajectories of active enzymes? Beyond a qualitative revealing of fluctuations between and during catalysis, the question arises how far the rotor is deformed. Briefly, is it twisted by 36, 72, 108 deg, or even more? Is there a difference in elastic rotor deformations for ATP synthesis and for ATP hydrolysis conditions? Because the present FRET dataset is still too small, we simulated the effects of different degrees of twist on the distribution of FRET distances. As shown in the model in Fig. 5(a), we assumed a relative movement of with respect to . Parameters to vary were (i) the distance between and in -direction, (ii) the position of with respect to the axis of rotation and (iii) the size of the -ring. To generate FRET distance 1 versus 2 plots, we also varied the apparent resolution of a position in our simulations. Given a Förster radius , 5000 data points were simulated with an apparent mean sum intensity of 200 kHz. Plotted in Fig. 5(b) are the FRET distance changes for consecutive FRET levels for all possible - combinations for the case of 36 deg elastic deformations. In Fig. 5(c) the associated plot of the differences between three consecutive FRET levels is shown, i.e. between a 36-deg elastic deformation () followed by a second 36-deg deformation (). For the 36-deg stepping of , only small distance changes were expected, and the transitions changed from to , or from to . Fig. 5(a) Geometrical model of the relative FRET changes according to the different positions of the FRET labels on and on one of the 10 -subunits. Simulations of FRET distance changes , shown in panels (b) and (d), and FRET difference transitions , shown in panels (c) and (e) depending on the maximum twist by -ring steps of 36 deg (b) and (c) or of 108 deg (d) and (e). 5000 data points were simulated to generate the two dimensional distributions. 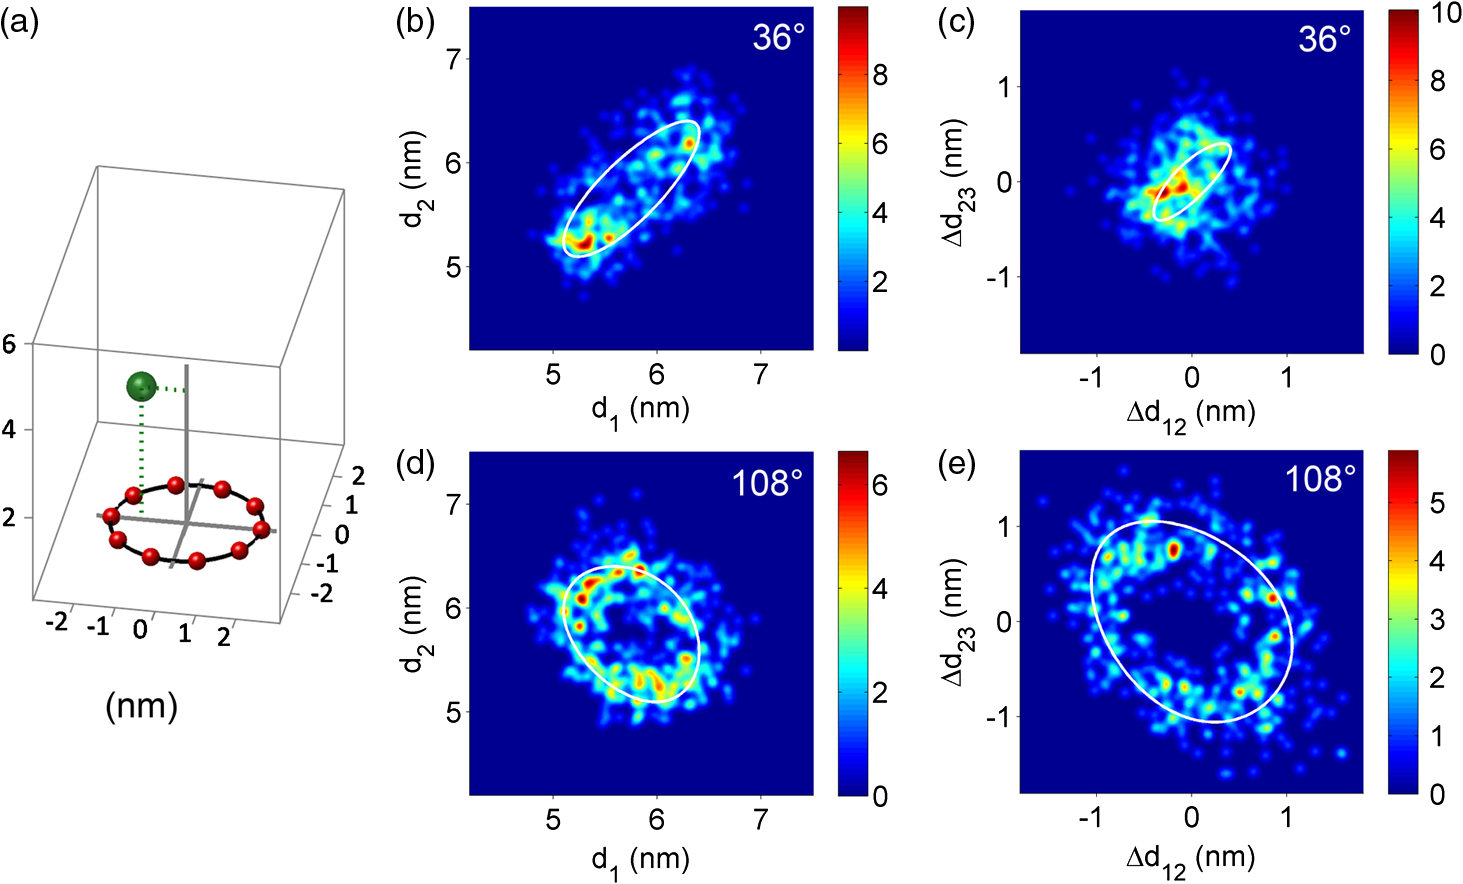 In contrast, if we assumed 108-deg deformations of the rotor or moving of one with respect to in three fast 36 deg steps, the resulting FRET distance transition plot in Fig. 5(d) shows a distinct two dimensional distribution with larger distance changes, such as from 5.1 to 6.1 nm and vice versa. In the associated FRET difference transition plot ( in Fig. 5(e), the larger deviations changed the shape of the distribution. Only if the -ring is moving up to 108 deg, FRET distance changes from to and vice versa are possible. Therefore, once a statistically sufficiently large experimental FRET dataset has been measured, it can be interpreted and the deformation extend can be extracted from the two dimensional histogramseven for the case of up to 10 slightly different --labeled -ATP synthases. 4.DiscussionIn summary, we labeled the -ATP synthase specifically with 3 fluorophores. We established a duty cycle-optimized alternating laser excitation scheme to monitor the overall rotary motion during catalysis and, simultaneously, the internal elastic deformations of the two coupled subunits and of the rotor. The single-molecule triple-FRET data shown here could be analyzed qualitatively by manual inspection of the distance time trajectories in single photon bursts. With this experimental setup, any perturbing influence of the surface as well as any slowdown of rotation caused by viscous drag of large actin filaments or beads was avoided. Furthermore, it was possible to measure FRET changes during ATP synthesis conditions by a quick buffer exchange after incubating liposomes with a buffer of low pH. For both catalytic conditions, ATP hydrolysis and ATP synthesis, we found distance fluctuations between the two marker positions on the rotor part of -ATP synthase. These distance fluctuations ranged from 0.4 to 1.3 nm indicating an elastic deformation between the -ring and for more than one step, or more than 36 deg, respectively. However, the overall number of analyzed enzymes was not sufficient to quantitatively compare the experimental distribution of FRET distance changes with the simulations. How to improve the threecolor FRET approach? The photophysics of the three fluorophores has to be optimized,43 such as changing EGFP to Alexa488 as the primary FRET donor using a SNAP-tag fusion on the static subunit . The second FRET donor should be changed to a rhodamine, with red-shifted absorbance and fluorescence, such as Atto565. Thus, the detection efficiency of the primary donor can be significantly increased using the appropriate broad interference filter in the detection pathway. Finally, the FRET acceptor can be changed to Atto647N with a much higher quantum yield. Therefore, the number of photons from all fluorophores is expected to be significantly higher resulting in an increased precision of FRET distance calculations, which is required to compare single-molecule FRET data with elasticity measurements using polystyrene beads attached to single surface-immobilized enzymes. Cross-linking of cysteine mutants has been applied to determine the stiffness of the internal and protruding part of the rotor subunit in surface-bound parts45 and .46,47 Assuming that both the internal and the protruding part of are compliant, a torsional angle of 42 deg was calculated at a torque of .45 This angle is large enough to bridge both gears of the -ATP synthase. Torque generation in the part was estimated in more detail by applying the fluctuation theorem.48 The peripheral stalk comprised by the right-handed double helix of the dimeric subunits49 is rigid.50 Accordingly, the -ring can move back and forth around 15 deg with respect to a fixed . Stepwise fluctuations of the -ring have been found for the ATP synthase from Thermus thermophilus,15 mostly fluctuating between one step forwards and one backwards. In this instance, the intramolecular FRET measurements of the elastic deformations indicate possible fluctuations of more than 36 deg. However, limited by a time resolution of 1 ms, fast and small steps were not resolvable in contrast to high-speed imaging of -ring rotation using light-scattering probes.14 The main difficulty of our approach is the collection of a significantly large FRET dataset. Due to low labeling efficiencies of cysteines in and especially of , only a few -ATP synthase comprised all three fluorophores. Furthermore, following geometric considerations to resolve the internal elastic deformations with subnanometer precision, a specific subunit is required for optimal FRET distance resolution. Labeling one of the 10 subunits specifically cannot be controlled at all. Therefore, a very large number of triple-labeled -ATP synthases has to be sorted in order to select only the most promising enzymes. Nevertheless, this approach is technically feasible, and, only on a single-molecule basis, the complicated FRET changes from the mixture of labeled enzymes can be resolved. This seems to be an advanced extension of the original concept of fluorescence resonance energy transfer as developed by Theodor Förster 66 years ago.51 AcknowledgmentsWe are grateful to our collaborators D. C. Cipriano and S. D. Dunn (University of Western Ontario, London, Canada) as well as P. Gräber (University of Freiburg, Germany) for providing the plasmids, E. coli strains and laboratory equipment to prepare the -ATP synthase mutants. The authors want to thank the German Science Foundation (DFG projects BO 1891/10-1 and BO 1891/10-2), the Volkswagen-Foundation (project I/84 073) and the Baden-Württemberg Stiftung (project P-LS-Meth/6 in the priority area “Methods for Life Sciences”) for generous financial support. ReferencesM. YoshidaE. MuneyukiT. Hisabori,
“ATP synthase-a marvellous rotary engine of the cell,”
Nat. Rev. Mol. Cell Biol., 2 669
(2001). http://dx.doi.org/10.1038/35089509 NRMCBP 1471-0072 Google Scholar
C. von BallmoosG. M. CookP. Dimroth,
“Unique rotary ATP synthase and its biological diversity,”
Annu. Rev. Biophys., 37 43
(2008). http://dx.doi.org/10.1146/annurev.biophys.37.032807.130018 1936-122X Google Scholar
W. JiangJ. HermolinR. H. Fillingame,
“The preferred stoichiometry of subunits in the rotary motor sector of Escherichia coli ATP synthase is 10,”
Proc. Natl. Acad. Sci. USA, 98 4966
(2001). PNASA6 0027-8424 Google Scholar
B. BallhausenK. AltendorfG. Deckers-Hebestreit,
“Constant ring stoichiometry in the Escherichia coli ATP synthase analyzed by cross-linking,”
J. Bacteriol., 191 2400
(2009). 0021-9193 Google Scholar
G. CingolaniT. M. Duncan,
“Structure of the ATP synthase catalytic complex () from Escherichia coli in an autoinhibited conformation,”
Nat. Struct. Mol. Biol., 18 701
–707
(2011). http://dx.doi.org/10.1038/nsmb.2058 1545-9993 Google Scholar
P. D. Boyer,
“The ATP synthase—a splendid molecular machine,”
Annu. Rev. Biochem., 66 717
(1997). http://dx.doi.org/10.1146/annurev.biochem.66.1.717 ARBOAW 0066-4154 Google Scholar
W. JungeH. LillS. Engelbrecht,
“ATP synthase: an electrochemical transducer with rotatory mechanics,”
Trends Biochem. Sci., 22 420
(1997). http://dx.doi.org/10.1016/S0968-0004(97)01129-8 TBSCDB 0167-7640 Google Scholar
M. G. Düseret al.,
“36 deg step size of proton-driven -ring rotation in -ATP synthase,”
Embo J., 28 2689
(2009). http://dx.doi.org/10.1038/emboj.2009.213 EMJODG 0261-4189 Google Scholar
C. M. AngevineK. A. HeroldR. H. Fillingame,
“Aqueous access pathways in subunit a of rotary ATP synthase extend to both sides of the membrane,”
Proc. Natl. Acad. Sci. USA, 100 13179
(2003). http://dx.doi.org/10.1073/pnas.2234364100 PNASA6 0027-8424 Google Scholar
T. ElstonH. WangG. Oster,
“Energy transduction in ATP synthase,”
Nature, 391 510
(1998). http://dx.doi.org/10.1038/35185 0028-0836 Google Scholar
T. M. Duncanet al.,
“Rotation of subunits during catalysis by Escherichia coli -ATPase,”
Proc. Natl. Acad. Sci. USA, 92 10964
(1995). PNASA6 0027-8424 Google Scholar
Y. ZhouT. M. DuncanR. L. Cross,
“Subunit rotation in Escherichia coli -ATP synthase during oxidative phosphorylation,”
Proc. Natl. Acad. Sci. USA, 94 10583
(1997). PNASA6 0027-8424 Google Scholar
G. Kaimet al.,
“Coupled rotation within single enzyme complexes during ATP synthesis or hydrolysis,”
FEBS Lett., 525 156
(2002). http://dx.doi.org/10.1016/S0014-5793(02)03097-1 0014-5793 Google Scholar
R. Ishmukhametovet al.,
“Direct observation of stepped proteolipid ring rotation in E. coli -ATP synthase,”
Embo J., 29 3911
(2010). http://dx.doi.org/10.1038/emboj.2010.259 EMJODG 0261-4189 Google Scholar
S. Furuikeet al.,
“Resolving stepping rotation in Thermus thermophilus -ATPase/synthase with an essentially drag-free probe,”
Nat. Commun., 2 233
(2011). http://dx.doi.org/10.1038/ncomms1215 NCAOBW 2041-1723 Google Scholar
Y. Sambongiet al.,
“Mechanical rotation of the subunit oligomer in ATP synthase (): direct observation,”
Science, 86 1722
(1999). http://dx.doi.org/10.1126/science.286.5445.1722 SCIEAS 0036-8075 Google Scholar
P. D. Boyer,
“The binding change mechanism for ATP synthase-some probabilities and possibilities,”
Biochim. Biophys. Acta, 1140 215
(1993). http://dx.doi.org/10.1016/0005-2728(93)90063-L BBACAQ 0006-3002 Google Scholar
J. P. Abrahamset al.,
“Structure at 2.8 A resolution of -ATPase from bovine heart mitochondria,”
Nature, 370 621
(1994). http://dx.doi.org/10.1038/370621a0 0028-0836 Google Scholar
P. D. Boyer,
“Catalytic site forms and controls in ATP synthase catalysis,”
Biochim. Biophys. Acta, 1458 252
(2000). http://dx.doi.org/10.1016/S0005-2728(00)00077-3 BBACAQ 0006-3002 Google Scholar
M. Börschet al.,
“Conformational changes of the -ATPase from Escherichia coli upon nucleotide binding detected by single molecule fluorescence,”
FEBS Lett., 437 251
(1998). http://dx.doi.org/10.1016/S0014-5793(98)01247-2 FEBLAL 0014-5793 Google Scholar
B. Bottcheret al.,
“Direct visualisation of conformational changes in by electron microscopy,”
J. Mol. Biol., 296 449
(2000). http://dx.doi.org/10.1006/jmbi.1999.3435 JMOBAK 0022-2836 Google Scholar
D. SabbertS. EngelbrechtW. Junge,
“Intersubunit rotation in active -ATPase,”
Nature, 381 623
(1996). http://dx.doi.org/10.1038/381623a0 0028-0836 Google Scholar
H. Nojiet al.,
“Direct observation of the rotation of -ATPase,”
Nature, 386 299
(1997). http://dx.doi.org/10.1038/386299a0 0028-0836 Google Scholar
R. Yasudaet al.,
“Resolution of distinct rotational substeps by submillisecond kinetic analysis of -ATPase,”
Nature, 410 898
(2001). http://dx.doi.org/10.1038/35073513 0028-0836 Google Scholar
H. Uenoet al.,
“Simple dark-field microscopy with nanometer spatial precision and microsecond temporal resolution,”
Biophys. J., 98 2014
(2010). http://dx.doi.org/10.1016/j.bpj.2010.01.011 BIOJAU 0006-3495 Google Scholar
S. FischerP. Graber,
“Comparison of - and -driven ATP synthesis catalyzed by the -ATPases from Escherichia coli or chloroplasts reconstituted into liposomes,”
FEBS Lett., 457 327
(1999). http://dx.doi.org/10.1016/S0014-5793(99)01060-1 FEBLAL 0014-5793 Google Scholar
S. SteigmillerP. TurinaP. Graber,
“The thermodynamic /ATP ratios of the -ATPsynthases from chloroplasts and Escherichia coli,”
Proc. Natl. Acad. Sci. USA, 105 3745
(2008). http://dx.doi.org/10.1073/pnas.0708356105 PNASA6 0027-8424 Google Scholar
M. Börsch,
“Stepwise rotation of the -subunit of -ATP synthase observed by intramolecular single-molecule fluorescence resonance energy transfer,”
FEBS Lett., 527 147
(2002). http://dx.doi.org/10.1016/S0014-5793(02)03198-8 FEBLAL 0014-5793 Google Scholar
M. Börschet al.,
“Stepwise rotation of the -subunit of -ATP synthase during ATP synthesis: a single-molecule FRET approach,”
Proc. SPIE, 4962 11
(2003). http://dx.doi.org/10.1117/12.479554 PSISDG 0277-786X Google Scholar
M. Börsch,
“Single-molecule fluorescence resonance energy transfer techniques on rotary ATP synthases,”
Biol. Chem., 392 135
(2011). http://dx.doi.org/10.1016/S0968-0004(97)01129-8 1475-4924 Google Scholar
M. Diezet al.,
“Proton-powered subunit rotation in single membrane-bound -ATP synthase,”
Nat. Struct. Mol. Biol., 11 135
(2004). http://dx.doi.org/10.1038/nsmb718 1545-9993 Google Scholar
D. A. CherepanovA. Y. MulkidjanianW. Junge,
“Transient accumulation of elastic energy in proton translocating ATP synthase,”
FEBS Lett., 449 1
(1999). http://dx.doi.org/10.1016/S0014-5793(99)00386-5 FEBLAL 0014-5793 Google Scholar
H. WangG. Oster,
“Energy transduction in the motor of ATP synthase,”
Nature, 396 279
(1998). 0028-0836 Google Scholar
W. Jungeet al.,
“Inter-subunit rotation and elastic power transmission in -ATPase,”
FEBS Lett., 504 152
(2001). http://dx.doi.org/10.1016/S0014-5793(01)02745-4 FEBLAL 0014-5793 Google Scholar
N. Zarrabiet al.,
“Simultaneous monitoring of the two coupled motors of a single -ATP synthase by three-color FRET using duty cycle-optimized triple-ALEX,”
Proc. SPIE, 7185 718505
(2009). http://dx.doi.org/10.1117/12.809610 PSISDG 0277-786X Google Scholar
B. K. Mulleret al.,
“Pulsed interleaved excitation,”
Biophys. J., 89 3508
(2005). http://dx.doi.org/10.1529/biophysj.105.064766 BIOJAU 0006-3495 Google Scholar
N. K. Leeet al.,
“Three-color alternating-laser excitation of single molecules: monitoring multiple interactions and distances,”
Biophys. J., 92 303
(2007). BIOJAU 0006-3495 Google Scholar
B. Zimmermannet al.,
“Movements of the -subunit during catalysis and activation in single membrane-bound -ATP synthase,”
Embo J., 24 2053
(2005). http://dx.doi.org/10.1038/sj.emboj.7600682 EMJODG 0261-4189 Google Scholar
M. G. Düseret al.,
“The proton-translocating a subunit of -ATP synthase is allocated asymmetrically to the peripheral stalk,”
J. Biol. Chem., 283 33602
(2008). http://dx.doi.org/10.1074/jbc.M805170200 JBCHA3 0021-9258 Google Scholar
F. E. Alemdarogluet al.,
“Poly(BODIPY)s: A new class of tunable polymeric dyes,”
Macromolecules, 42 6529
(2009). http://dx.doi.org/10.1021/ma900727k MAMOBX 0024-9297 Google Scholar
K. M. Johnsonet al.,
“Mechanistic basis for differential inhibition of the -ATPase by aurovertin,”
Biopolymers, 91 830
(2009). http://dx.doi.org/10.1002/bip.v91:10 BIPMAA 0006-3525 Google Scholar
N. Zarrabiet al.,
“Asymmetry of rotational catalysis of single membrane-bound -ATP synthase,”
Proc. SPIE, 5699 175
(2005). http://dx.doi.org/10.1117/12.597967 PSISDG 0277-786X Google Scholar
M. BörschJ. Wrachtrup,
“Improving FRET-based monitoring of single chemomechanical rotary motors at work,”
Chemphyschem, 12 542
(2011). http://dx.doi.org/10.1002/cphc.201000702 CPCHFT 1439-4235 Google Scholar
G. F. SchroderH. Grubmuller,
“Maximum likelihood trajectories from single molecule fluorescence resonance energy transfer experiments,”
J. Chem. Phys., 119 9920
(2003). http://dx.doi.org/10.1063/1.1616511 JCPSA6 0021-9606 Google Scholar
D. OkunoR. IinoH. Noji,
“Stiffness of γ subunit of -ATPase,”
Eur. Biophys. J., 39 1589
(2010). EBJOE8 0175-7571 Google Scholar
H. Sielaffet al.,
“Domain compliance and elastic power transmission in rotary -ATPase,”
Proc. Natl. Acad. Sci. USA, 105 17760
(2008). http://dx.doi.org/10.1073/pnas.0807683105 PNASA6 0027-8424 Google Scholar
W. JungeH. SielaffS. Engelbrecht,
“Torque generation and elastic power transmission in the rotary -ATPase,”
Nature, 459 364
(2009). http://dx.doi.org/10.1038/nature08145 0028-0836 Google Scholar
K. Hayashiet al.,
“Fluctuation theorem applied to -ATPase,”
Phys. Rev. Lett., 104 218103
(2010). http://dx.doi.org/10.1103/PhysRevLett.104.218103 PRLTAO 0031-9007 Google Scholar
P. A. Del RizzoY. BiS. D. Dunn,
“ATP synthase b subunit dimerization domain: a right-handed coiled coil with offset helices,”
J. Mol. Biol., 364 735
(2006). http://dx.doi.org/10.1016/j.jmb.2006.09.028 JMOBAK 0022-2836 Google Scholar
A. Wachteret al.,
“Two rotary motors in -ATP synthase are elastically coupled by a flexible rotor and a stiff stator stalk,”
Proc. Natl. Acad. Sci. USA, 108 3924
(2011). http://dx.doi.org/10.1073/pnas.1011581108 PNASA6 0027-8424 Google Scholar
T. Förster,
“Energiewanderung und fluoreszenz,”
Naturwissenschaften, 33 166
(1946). http://dx.doi.org/10.1007/BF00585226 NATWAY 0028-1042 Google Scholar
|


