
|
|
1.IntroductionFörster (fluorescence) resonance energy transfer (FRET) is extensively used in biochemical and biomedical research.1–3 As a “spectroscopic ruler,” FRET has been an enormously useful tool for monitoring fundamental processes such as proximity relationships between interacting biomolecules and conformational changes within single molecules.4,5 Radiationless interactions between a donor and a single acceptor depend on the Förster radius () and the inverse 6th power of the donor—acceptor separation. can be theoretically calculated if one knows the overlap integral, quantum yield of the donor, the relative orientation of the emission transition moment of the donor, the absorption transition moment of the acceptor (the so-called orientation factor, ), and the refractive index, , of the medium separating the donor and acceptor. The overlap integral reflects the spectral overlap between donor emission and chromophore absorption of the acceptor. The orientation factor can vary between 0 and 4, and in dynamic systems where molecular mobility is high the orientation factor can be assumed to be . Until recently, the use of commercially available organic fluorophores has allowed the observation of as large as 65 to 75 Å, and experimentally feasible FRET signals can be measured at distances (i.e., separations) of up to about 100 to 110 Å. This is about 1.4- to 1.5-times . The primary reason for this is the fact that donor–acceptor interactions rapidly vanish with increasing probe separation (), and for separations greater than the transfer efficiency is below 10%. For larger donor—acceptor separations, potential artifacts and errors that are typically present in experiments can easily overwhelm the expected effects, especially when employing cellular microscopy.6,7 Recently available reactive forms of far-red probes with both high extinction coefficients and good quantum yields can extend the practical to about 80 Å and the observation window to around 110 to 120 Å.8,9 Presently, one typically labels specific sites using a single donor on a given macromolecule and a single acceptor on another macromolecule in order to monitor intermolecular distances during interactions (e.g., physiological processes). Using FRET-based fluorescence microscopy, great strides have been made in the study of protein interactions in cells that occur on the scale of 8 to 9 nm.1–3,5,10,11 However, there are still many important spatial/proximal interactions that occur at the cellular level, such as those related to Golgi bodies involved in trafficking,12 that taking place at distances much greater than 100 Å. These interactions cannot be studied using FRET with the commercially and widely available fluorophores. For some time there has been ongoing research to increase the distances monitored by FRET to beyond 100 Å. One of the approaches that has been used to extend FRET to greater distances is the use of high quantum-yield and very long-life lanthanide donors. Their ms luminescence lifetime also allows the suppression of nanosecond fluorescence from both the acceptor and the background, enabling the observation of acceptor-sensitized emission with time-gated detection. The long lifetime of this emission enables the observation of significantly smaller changes in the lifetime induced by FRET, allowing researchers to monitor interactions that occur at distances much greater than . Lanthanides are also quite useful because of their remarkably sharp line emission that is suitable for multiplexing. For approaching 70 Å that is matched to the proper organic fluorophore acceptors, it is possible to measure distances over 110 Å using lanthanide donors.13–17 These reports indicate that using lanthanide as the donor, it is possible to reliably measure distances about 1.60- to 1.65-times . These results compare quite favorably with the practical limit of 1.5-times that can be obtained using traditional organic fluorophores. Using acceptors such as quantum dots (QD) and phycobiliproteins (PE), which possess significantly higher absorption and molar extinction coefficients, values of 90 to 100 Å have been measured when using lanthanide donors.18–20 Therefore, in principle, it should be possible to monitor FRET at distances less than 150 Å under practical experimental conditions when using acceptable donor—acceptor pairs. However, it should be noted that both chelated lanthanide donors and acceptors, such as QD and PE molecules, are significantly larger than conventional organic acceptor molecules. Because the measured donor—acceptor separation refers to the distance between the centers of the interacting entities, a practical consequence of their relatively larger sizes is that the donor and acceptor molecules will occupy up to 50 to 60 Å of the measured distance. This will result in limiting the effective observation distance to around 100 Å under most experimental conditions.20 Morgner et al. used this disadvantage in an imaginative application to develop a simple and inexpensive FRET method to monitor the size of QDs, the results of which compare favorably with the results of more demanding transmission electron microscopy.20 The molar extinction coefficients of the organic sensitizer molecules used in lanthanide-based probes are typically less than . This, together with the intrinsic ms lanthanide lifetimes, results in a significantly smaller photon flux that limits the applications of cellular microscopy—based FRET. Also, the need to excite in the UV/near-visible spectrum (typically between 325 and 360 nm) is also a significant drawback. Another promising approach designed to extend measurable FRET to beyond 100 Å involves gold and silver nanoparticles. Gold nanoparticles quench fluorescence and the process has been described as nanomaterial surface energy transfer (NSET). However, the underlying quenching mechanism shows a complex dependence on the size of the gold particle, and the mechanism also changes with the amount of separation between the fluorophore and gold nanoparticle. As things stand, a great deal has yet to be learned about how gold nanoprobe distances are dependent on the quenching of fluorescence before this method becomes as prevalent and routine as FRET.21–23 Silver nanoparticle-associated surface plasmons are also known to enhance FRET.24–26 Because silver nanoparticle plasmons are dependent on particle size, shape, and relative orientation of the chromophore in relation to the particle, it is more likely that such interactions will be incorporated into assays and simple detection systems than quantitative FRET applications. The original Förster formalism has been adopted to describe fluorescence energy transfer involving single and multiple donors and acceptors, the various dimensionalities of the system, and cases of restricted geometry, to name a few.4,27,28 At the beginning of 1990s, we explained that the experimentally observed enhanced energy transfer of tryptophan moieties to four heme units in hemoglobin is the result of the summation of individual radiative transfer rates involving each heme acceptor.29–31 More generally, the observed FRET, in the case of a single donor and multiple acceptors, is the sum of the individual transfer rates to each acceptor. In addition, a more recent publication describes a generalized theoretical framework of FRET for oligomeric protein complexes that are labeled using multiple donors and acceptors.32 There are also some recent publications that take advantage of enhanced transfer efficiency due to multiple acceptors to optimize the experimental FRET design. Emphasis, however, seems to be on the development of more sensitive analytical assays and detection systems.32–35 Our review of the available literature suggests that the observed energy transfer efficiency from a single donor to an acceptor can be enhanced by confining multiple acceptors to a suitably sized single protein/antibody/small particle in the place of a single acceptor, as is routinely done. The use of a small protein body with multiple acceptors can be a convenient way to study the interactions that occur at larger separations, as frequently happen during protein assembly/disassembly in cells. Because the random labeling of antibodies, or fragments of antibodies, with multiple dyes is now standardized and can be controlled with good precision, it is likely that such labeled proteins will find wide use in the study of macromolecular interactions that occur at distances greater than 100 Å. 2.ExperimentalA 30-mer oligonucleotide with biotin on the 3′-end and Alexa-568 (A568) on the 5′-end and its complimentary strand were purchased from Invitrogen (Grand Island, New York) as HPLC-purified samples. The sequence of donor oligonucleotide was as follows: A568-5′-GAAGCTTAGATAAATAATTTGATAACGTAC-Biotin High-purity avidin was purchased from Sigma—Aldrich (St. Louis, Missouri), and the reactive forms of the fluorophore acceptors, DyLight-649 (DL649) and DyLight-750 (DL750), were purchased from Thermo Fisher (Rockford, Illinois). To label avidin, typically 0.5 mL of 2 to 3 µM of 50 mM borate buffer (pH 8.5) is mixed with the N-hydroxysuccinimide (NHS) ester of the probes (less than 1% dimethylformamide by volume), allowed to react for 3 h, and then the labeled protein is separated from the free probe by passing it through a Sephadex G-25 (Sigma-Aldrich) desalting column. We used NHS esters at a concentration of 8- to 15-times the protein concentration, which roughly translates to the use of twice the number of reactive probes relative to the number of acceptors we intended to label. The molar extinction coefficient of at 280 nm was used to calculate the avidin concentration of the solution. The molar extinction coefficients and 280-nm correction factors used to calculate the extent of labeling were 250 000/0.037 for DL649 and 220,000/0.02 for DL750, respectively. The extent of labeling is reported as the number of fluorescent acceptors per avidin tetramer molecule and represents the average number of labels per protein (i.e., avidin tetramer). In order to hybridize single strands (ss), the donor-labeled oligonucleotide and the complimentary oligonucleotide (access) solutions in 5 mM Tris (pH 7.5) and 50 mm NaCl were mixed and equilibrated in a 65 ºC water bath for 15 min. The resulting double-stranded (ds) oligonucleotide samples were allowed to slowly cool to room temperature. For the ds oligonucleotide solutions, appropriate amounts of labeled avidin were added, gently shaken, and equilibrated for 1 h. The final concentrations were 100 nM labeled oligonucleotide and 160 nM avidin tetramer. Because an excess of avidin tetramer was used, we expected the dominant complex to be made up of only one ds oligonucleotide bound to a given avidin tetramer. Steady-state fluorescence spectra were recorded using a Cary Eclipse spectrofluorometer (Varian Inc., Australia) using vertically polarized excited light, and emission was observed at the magic angle (i.e., 54.7 deg). The excitation wavelength was 535 nm, and the slit widths were set to 10 nm. The labeled avidin absorption spectra were recorded using a Varian Cary 50 spectrophotometer. Lifetime measurements were carried out using a customized FT 200 (Picoquant GmbH) time-correlated single photon-counting (TCSPC) fluorometer equipped with Hamamatsu R3809U-50 microchannel plate photomultiplier (MCP) and a 535-nm laser diode as the excitation source. The instrument response function was less than 50 ps.36 3.Theoretical ModelFor our application, we considered a system consisting of a single donor and multiple acceptors that were randomly positioned on a globular protein/antibody. The point donor and protein labeled with multiple acceptors are connected via a rigid link of a given length. The distance, , is defined as the separation between the center of the donor and the closest point of approach to the protein surface (Fig. 1). In this simple model, we considered the protein to be a sphere of radius (where its diameter is equal to ). The acceptor molecules are randomly positioned on the surface of the sphere. For a given acceptor location on the protein surface , the separation between the donor and the acceptor at the position will be . The distance depends on the separation , the radius of globular protein, and the angle that describes the acceptor location on the sphere with respect to the center of the sphere. can then be calculated as: Under these conditions, the closest location of the acceptor is equal to the separation and the furthest location is equal to the distance of . The transfer rate to a single particular acceptor at an arbitrary position can be calculated as: where is the lifetime of the donor in the absence of an acceptor and is the characteristic Förster distance for the given donor—acceptor pair. is defined as: where is the quantum yield of the donor, is the overlap integral, is the refractive index of the medium separating the donor and acceptor, and is the orientation factor, which depends on the relative orientation of the donor-emission transition moment and acceptor-absorption transition moment. Because all other parameters that define are identical for all acceptors and can be predicted with reasonable accuracy, the orientation factor is undefined and may vary from one acceptor to another. In the simplest case of highly mobile donors and acceptors (i.e., a rapidly rotating donor and an acceptor within the fluorescence lifetime of the donor), the value can be approximated as .37,38 Before assuming the dynamic average of (i.e., ), typically one should estimate the probe’s mobility by measuring the fluorescence anisotropy of the donor and acceptor in the system.37,38Fig. 1A model system of a single donor, D (¤), and randomly distributed acceptors, A (•),on the surface of a spherical body (e.g., protein). 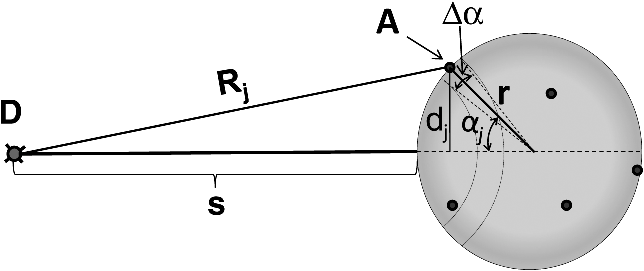 Next, we calculated the average transfer efficiency to the acceptors that were randomly positioned on the protein surface. First, we assumed that each position on the protein is equally probable. Also, for simplicity, we assumed that each donor and acceptor have significant mobilities, thus we were able to assume that the orientation factor is for each acceptor position. In cases where there is only one acceptor per protein, the expected energy transfer efficiency will be in the range of the following: These values correspond to closest (left term) and farthest (right term) locations. To calculate the apparent/average transfer rate to one acceptor that was randomly positioned on the protein surface, we should consider all positions on the sphere’s surface as equally probable. The transfer rates are additive, and for any given configuration of acceptors the cumulative rate is the simple sum. The details of averaging are similar to those used for calculating the FRET efficiency from a single donor to a planar acceptor.29–31 In the case of a sphere (as shown in Fig. 1) for a given position , the probability of finding an acceptor at a this position is proportional to the surface element, , where is the angle element as shown in Fig. 1. Any position on the sphere around the perimeter is equally probable. In our approximation, we assumed that the orientation factor is independent of the location on the sphere and equal to . Since the sum of all surface elements yields the surface of the sphere , the measured average transfer of an ensemble of pairs where the single acceptor is randomly positioned on the surface is given by the following sum: For independent acceptors, the total transfer efficiency will be . The measured FRET efficiency of a random ensemble of n acceptors can be calculated as: Using this simple approximation, we simulated the transfer efficiency of a system where the separation is 120 Å. The acceptors are labeled to the protein with a diameter 40 Å, and the characteristic of the donor—acceptor system is 80 Å. For a single donor—acceptor system separated by 120 Å, the FRET efficiency will be about 8.1%. However, when the same acceptor is randomly positioned on this sphere, the average transfer efficiency drops to about 3.7%. This significant drop is a consequence of the size of the protein used to label the acceptors. The effect for most positions is that each individual acceptor is at a much larger distance than the distance of closest approach . What is interesting and encouraging is that with as few as three randomly placed acceptors the calculated average FRET is almost 10%. With six random acceptors it further increases to almost 19%.Figure 2 shows the predicted transfer efficiencies as a function of separation for a different number of acceptors. has been assumed to be 80 Å, and the size (diameter) of the labeled protein is 40 Å. The dashed line represents the dependence of a single donor—acceptor pair (i.e., no protein body). It is encouraging to observe that the presence of even five randomly placed acceptors results in a significantly enhanced FRET in spite of the fact that protein size adds to the actual separation between the donor and the acceptors. The effect is more pronounced at larger separations. For this particular set of parameters, even at a physical separation of 150 Å, the presence of five acceptors per protein results in a FRET efficiency of 5.5%, and for 10 acceptors the FRET efficiency is 10.4%. It should be noted that 150 Å is the closest approach of a labeled protein, and the actual distance from the donor to the center of the acceptor-labeled protein is 170 Å. The precise limit of measurable FRET depends on many experimental and instrumental factors. What is obvious from these simulations is that regardless of the experimental limitations of a given situation, the presence of multiple acceptors will yield a higher FRET signal and extend the range of the effective interactions. Fortunately, labeling large proteins, such as antibodies, with up to 10 dyes does not seem to perturb its binding capabilities and functions. Fig. 2Transfer efficiency as a function of separation for a different number of acceptors (1, 5, and 10) that are deposited on the surface of a spherical body with a diameter of 40 Å. Dashed line represents a single acceptor. Assumed Förster radius of 80 Å.  Another aspect we would like to address is the effect of the size of used protein (antibody). In Fig. 3 we present simulations of expected FRET as a function of protein size () when using various numbers of acceptors. For this, we assumed a separation of 120 Å and, again, is assumed to be 80 Å. In the case of a small protein (), the presence of six acceptors will result in a FRET efficiency of 25.1%. This transfer efficiency is almost three times larger than that of a single donor—acceptor pair that is separated by just 120 Å. An increase in the protein size to 35 Å, the size of a typical miniantibody, decreases the FRET efficiency to 20.1%. Further increasing the size of the protein to 55 Å, the size of a typical fab fragment of an antibody, still results in a comfortable 15.4% transfer efficiency. It is important to remember that for very large proteins (e.g., antibodies), a greater labeling efficiency can be achieved without affecting protein functions. In the case of a 55 Å diameter-labeled protein, increasing the number of acceptors to eight resulted in an easily measurable 19.5% transfer efficiency at a separation distance 120 Å (corresponding to 147.5 Å from the donor to the center of the labeled protein). Interestingly, even a gigantic protein of 150 Å with 10 acceptors will show a transfer rate of approximately 10%. It should be noted that when we state that a certain size is comparable to an experimentally relevant protein, we are matching their respective volumes. For example, a sphere of 55 Å will have a volume comparable to that for a 70- to 75-Å-long prolate ellipsoid, such as a fab fragment. 4.ResultsIn order to experimentally test our model, we used the ds 30 mer, as previously described by Hyduk et al.16 The measured length of this 30-mer ds oligonucleotide was about 100 Å and the donor and acceptor molecules add another 10 Å to the effective donor—acceptor separation.12–16 Earlier studies16 confirmed the length of this ds oligonucleotide and its rigidity. In our case, the avidin molecule adds a minimum of 25 Å. We used Alexa-568 (A568) as the donor and DyLight-649 (DL649) or DyLight-750 (DL750) as the acceptor. The calculated are 71.5 Å and 61 Å for the A568-DL649 and A568-DL750 pairs, respectively. Each donor—acceptor system yields significantly different transfer efficiencies for each oligonucleotide length. Figure 4 shows the steady-state emission spectrum of a donor-labeled ds oligonucleotide and the absorption of acceptor-labeled avidin. The absorption axis is normalized to the molar extinction coefficients of the acceptor probes. The calculated FRET efficiencies, in the case of a single donor and a single acceptor that are tethered at opposite ends of this ds oligonucleotide, are a little less than 0.03 (3%) for DL750 and about 0.07 (7%) for DL649. Fig. 4Fluorescence spectrum of donor A568 ds oligonucleotide (solid green) and the absorption spectra of avidin-DL649 (dashed red) and avidin-DL750 (dotted blue).  Table 1 presents the results of the fluorescence lifetime measurements. A representative example of the measured intensity decays is shown in Fig. 5. The donor-only intensity decay (A568) is made up of three lifetime components. The longest-lived component is around 3.5 ns and makes up nearly two-thirds of the population. This lifetime is similar to the reported fluorescence lifetime of free A568 in buffer.8 The other two lifetime components are about 1.3 and 0.2 ns, respectively, each contributing up to 15% to 20% of the A568 population. It is not uncommon for single-lifetime fluorophores to present additional lifetime components when attached to DNA due to various quenching mechanisms. In the presence of labeled avidin, we observed both a decrease in the longest lifetime values as well as an increase in the amplitudes of the shorter lifetime components. This is expected because FRET decreases the overall photon count, and the photons from the populations with the shortest lifetimes will effectively make up a larger portion of the overall photon flux. The intensities of the averaged lifetimes are also given in the Table 1. The donor-only average lifetime is 3.179 ns. At first, we tested the system using a single acceptor (DL649) that was labeled at the 5′-end of biotin. The average lifetime decreased to 3.035 ns, which corresponds to a FRET efficiency of about 5.5%. In the presence of acceptorlabeled avidin, we measured 2.893 ns for DL750 and 2.793 and 2.724 ns for DL649. The extent of FRET was about 9% in the case of the A568-DL750 pair () and 12% and 14.2% in the cases of A568-DL649 with 4.5 and 6 acceptors, respectively. It is clear that the presence of multiple acceptors increases the transfer efficiency regardless of under the presented experimental conditions. As expected, we observed a higher transfer as the value increased, as well as with an increasing number of acceptors. We only present an analysis of FRET based on changes in the average intensity of the fluorescence lifetime. The exact fluorescence lifetimes recovered from the experiments are presented in Table 1. These results are in good agreement with the theoretical predictions, but it would be preferable to have a single-lifetime donor in order to help minimize uncertainty. Table 1Measured fluorescence lifetimes and transfer efficiencies of the three experimental systems. The last column presents the corresponding calculated transfer efficiencies of the presented systems.
A: number of labeled acceptors. Calculation are based on a distance of 110 Å for DL649, a distance of closest approach of 105 Å for systems with avidin (100 Å DNA+donor), and a 55 -Å diameter of the labeled protein. To estimate the orientation factors, we measured the anisotropy decay of the A568-labeled ds oligonucleotide that was bound to avidin. The majority (greater than 75%) of anisotropy decay was associated with fast rotational motions of 0.35 to 2.74 ns, yielding a low steady-state anisotropy for the donor. Because the average donor lifetimes of the measured systems are greater than 2.7 ns, we can reasonably conclude that the Alexa probe is freely rotating in solution when it is attached to one point on the DNA molecule. We also checked the anisotropies of the acceptors at low labeling efficiencies when energy migration between acceptors is minimal and, therefore, does not affect anisotropy. The measured steady-state anisotropies for excitation wavelengths of 630 nm (DL649) and 730 nm (DL750) were below 0.2, indicating significant mobility of acceptors molecules when bound to avidin. In conclusion, these two observations sufficiently justify the use of as the orientation factor. 5.DiscussionAs our simple model based on the Förster theory predicted, we were indeed able to observe enhanced energy transfer when a single donor and multiple acceptors were placed on an avidin molecule. The measured transfer efficiencies correlate very well with the modeled predictions. The size of avidin is similar to the size of a fab fragment of an antibody. The extent of the increase in transfer efficiency is encouraging, and it is possible to further increase the number of acceptors and still have a functional protein. Good agreement between the model and the experimental data for all three cases indicates that, in spite of the many assumptions made in the model, it is able to describe the ensemble behavior very well. By measuring the emission anisotropies of the donor and acceptor, we confirmed that probe mobility is high and the orientation factors of each acceptor in relation to donor averages is close to the assumed value of 2/3. Also, we were only able to determine the average labeling efficiency (i.e., average number of acceptors per avidin tetramer). However, we realize that this labeling is statistical, and that in a real system we have to deal with a distribution (typically a Lorentzian distribution) of proteins that are labeled with different numbers of acceptors. For example, in the case of a labeling efficiency of 6, the number of proteins that are labeled with six dyes will constitute more than 35% of entire population. The total number of proteins with five to seven dyes will constitute over 70% of entire population. More importantly, the number of protein molecules without a dye will be below 1%, and the number of antibodies with a single dye will be only 1.3% of the population. Therefore, almost 98% of protein molecules have two or more acceptors. The FRET efficiency depends on the number of acceptors, but our experimental results show that the lower the FRET efficiency of a fraction of molecules with a smaller number of acceptors is compensated by an equivalent fraction with a higher than average number of acceptors. It should be beneficial to use a larger labeling efficiency in order to avoid contributions from pairs without acceptor-labeled proteins. Interestingly, a labeling efficiency of 6 already shows that only 1% of the proteins are unlabeled, and we conclude that labeling efficiencies larger than 4 are experimentally acceptable. Good agreement between the calculated and measured FRET values confirms that one can use proteins labeled with many acceptors to detect intermolecular interactions at large distances. At large labeling efficiencies, even quantitative measurements of separation distances much greater than 100 Å should be possible as long as the protein size is known and the labels are randomly distributed. In practical terms, this is not a major hurdle. A typical experiment in cellular FRET often uses fluorescent antibodies to localize different proteins in a multicomponent complex. We fully realize that our model is at best a simple approximation. Proteins are typically ellipsoidal and not spherical. Also, the initial labeling of lysine residues may not be totally random because lysine reactivities are known to differ between proteins. However, once we reach several labels per protein, there is a good chance that labeling will begin to approach a random distribution. These results suggest that more detailed experiments are warranted that involve more than one separation distance, more than one acceptor for a given donor in order to vary the values, and a larger degree of acceptor labeling in order to help us refine this simple approach. It would also be of interest whether such a multiparameter, global approach will allow the independent determination of the size of the acceptor body along with the distance of the closest approach. The ultimate measurable distance is likely to be determined by the experimental and instrumental setup. The detection and resolution limit depends on many variables.1,6,7,36,38 We are certain that for any given system, the use of multiple, rather than single, acceptors will enhance the transfer efficiency and allow for larger distances to be measured. There are also several commercially available reactive Near Infra Red probes that can be used to create a of about 80 to 85 Å. These values are obtained with practical considerations in mind, such as Stoke’s shift for fluorescent donors and adequate separation between donor florescence maxima and the beginning of acceptor fluorescence. Based on simulations and these experimental results, we are confident that FRET measurements can now be easily extended to about 140 to 150 Å with over 10% FRET efficiency using these donor—acceptor pairs with multiple acceptors. Any future developments that improve will only help in the investigation of even larger distances. There are also some other promising potential acceptors that can serve the same purpose. For example, very small silica nanoparticles and dendrimers (which are only a few nm in size) can bring many probes and a very large molar extinction coefficient to a very small area and can be functionalized for use as acceptor labels. In practical terms, these particles are similar to QDs and PE, though smaller. One of the parameters governing transfer efficiency is the size of the acceptor-labeled protein/macromolecule/particle. The smaller the particle the greater the transfer efficiency for any given and number of acceptors. The RET of lanthanides has many useful attributes and this approach should be equally applicable for the use of lanthanides as potential donors. One of the less-realized advantages of lanthanides is their single lifetime, which makes the interpretation of data simpler. The enhancement of FRET due to the presence of multiple acceptors has been explored for the development of sensitive analytical assays for some time. The primary aim of this research is to lower the detection limit and make assays more sensitive. Only recently, it seems, have FRET-based distance measurements over 100 Å come into focus, as reported in recent publications.33,34 Our results also suggest that not only can we enhance FRET by using multiple acceptors, but under certain conditions we can also quantitatively measure changes in separations much larger than 100 Å. The primary way to measure these distances has always been to use labels with a single donor and a single acceptor. An equally promising aspect of our approach is that it not only employs commercially available and widely used probes, but it also fits in nicely with existing and widely used cell-based fluorescence microscopy. Oftentimes, fluorescence lifetime imaging is used to monitor changes in separation during various cellular processes. We expect this approach to be adapted within the framework of FRET-based cellular florescence microscopy. AcknowledgmentsThis work was supported by grants from the National Institutes of Health (R21 CA149897 and 1R01EB012003) (Z.G.). ReferencesFLIM Microscopy in Biology and Medicine, Chapman and Hall/CRC, Boca Raton, Florida
(2009). Google Scholar
E. A. Jares-ErijmanT. M. Jovin,
“Imaging molecular interactions in living cells by FRET microscopy,”
Curr. Opin. Chem. Biol., 10
(3), 409
–416
(2006). http://dx.doi.org/10.1016/j.cbpa.2006.08.021 COCBF4 1367-5931 Google Scholar
J. A. Levittet al.,
“Fluorescence lifetime and polarization-resolved imaging in cell biology,”
Curr. Opin. Biotechnol., 20
(1), 28
–36
(2009). http://dx.doi.org/10.1016/j.copbio.2009.01.004 CUOBE3 0958-1669 Google Scholar
L. Stryer,
“Fluorescence energy transfer as a spectroscopic ruler,”
Ann. Rev. Biochem., 47 819
–846
(1978). http://dx.doi.org/10.1146/annurev.bi.47.070178.004131 ARBOAW 0066-4154 Google Scholar
E. Kiyokawaet al.,
“Spatiotemporal regulation of small GTPases as revealed by probes based on the principle of Förster resonance energy transfer (FRET): implications for signaling and pharmacology,”
Annu. Rev. Pharmacol. Toxicol., 51 337
–358
(2011). http://dx.doi.org/10.1146/annurev-pharmtox-010510-100234 ARPTDI 0362-1642 Google Scholar
C. BerneyG. Danuser,
“FRET or no FRET: a quantitative comparison,”
Biophys. J., 84
(6), 3992
–4010
(2003). http://dx.doi.org/10.1016/S0006-3495(03)75126-1 BIOJAU 0006-3495 Google Scholar
C. W. Changet al.,
“Physiological fluorescence lifetime imaging microscopy improves Förster resonance energy transfer detection in living cells,”
J. Biomed. Opt., 14
(6), 060502
(2009). http://dx.doi.org/10.1117/1.3257254 JBOPFO 1083-3668 Google Scholar
R. P. Haugland, The Handbook-A Guide to Fluorescent Probes and Labeling Technologies, 26 Invitrogen, USA
(2005). Google Scholar
M. A. AyoubK. D. G. Pfleger,
“Recent advances in bioluminescence resonance energy transfer technologies to study GPCR heteromerization,”
Curr. Opin. Pharmacol., 10 44
–52
(2010). http://dx.doi.org/10.1016/j.coph.2009.09.012 COPUBK 1471-4892 Google Scholar
F. CiruelaJ. P. VilardagaV. F. Duenas,
“Lighting up multiprotein complexes: lessons from GPCR oligonucleotidemerization,”
Trends Biotechnol., 28
(2), 407
–415
(2010). TRBIDM 0167-7799 Google Scholar
A. NakanoA. Luini,
“Passage through the Golgi,”
Curr. Opin. Cell Biol., 22
(2), 471
–478
(2010). http://dx.doi.org/10.1016/j.ceb.2010.05.003 COCBE3 0955-0674 Google Scholar
P. R. SelvinJ. E. Hearst,
“Luminescence energy transfer using a terbium chelate: improvements on fluorescence energy transfer,”
Proc. Nail. Acad. Sci. U.S.A., 91 10024
–10028
(1994). PNASA6 0027-8424 Google Scholar
P. R. Selvin,
“Principles and biophysical applications of lanthanide-based probes,”
Annu. Rev. Biophys. Biomol. Struct., 31 275
–302
(2002). http://dx.doi.org/10.1146/annurev.biophys.31.101101.140927 ABBSE4 1056-8700 Google Scholar
A. N. Kapanidiset al.,
“Mean DNA bend angle and distribution of DNA bend angles in the CAP-DNA complex in solution,”
J. Mol. Biol., 312 453
–468
(2001). http://dx.doi.org/10.1006/jmbi.2001.4976 JMOBAK 0022-2836 Google Scholar
E. Heyduket al.,
“Conformational changes of DNA induced by binding of chironomus high mobility group protein 1a (cHMG1a),”
J. Biol. Chem., 272
(32), 19763
–19770
(1997). http://dx.doi.org/10.1074/jbc.272.32.19763 JBCHA3 0021-9258 Google Scholar
H. E. Rajapakseaet al.,
“Time-resolved luminescence resonance energy transfer imaging of protein—protein interactions in living cells,”
Proc. Nail. Acad. Sci U.S.A., 107
(31), 13582
–13587
(2010). PNASA6 0027-8424 Google Scholar
L. J. CharbonnièreN. Hildebrandt,
“Lanthanide complexes and quantum dots: a bright wedding for resonance energy transfer,”
Eur. J. Inorg. Chem., 23 3241
–3251
(2008). http://dx.doi.org/10.1002/ejic.200890056 EJICFO 1434-1948 Google Scholar
L. J. Charbonniereet al.,
“Lanthanides to quantum dots resonance energy transfer in time-resolved fluoro-immunoassays and luminescence microscopy,”
J. Am. Chem. Soc., 128 12800
–12809
(2006). http://dx.doi.org/10.1021/ja062693a JACSAT 0002-7863 Google Scholar
F. Morgneret al.,
“A quantum-dot-based molecular ruler for multiplexed optical analysis,”
Angew. Chem. Int. Ed., 49 7570
–574
(2010). ACIEF5 1433-7851 Google Scholar
C. S. Yunet al.,
“Nanometal surface energy transfer in optical rulers: breaking the FRET barrier,”
J. Am. Chem. Soc., 127 3115
–3119
(2005). http://dx.doi.org/10.1021/ja043940i JACSAT 0002-7863 Google Scholar
R. Chhabraet al.,
“Distance-dependent interactions between gold nanoparticles and fluorescent molecules with DNA as tunable spacers,”
Nanotechnology, 20 485201
(2009). http://dx.doi.org/10.1088/0957-4484/20/48/485201 NNOTER 0957-4484 Google Scholar
J. Seeliget al.,
“Nanoparticle-induced fluorescence lifetime modification as nanoscopic ruler: demonstration at the single molecule level,”
Nano Lett, 7
(3), 685
–689
(2007). http://dx.doi.org/10.1021/nl0627590 NALEFD 1530-6984 Google Scholar
J. I. GerstenA. Nitzan,
“Accelerated energy transfer between molecules near a solid particle,”
Chem. Phys. Lett., 104
(1), 31
–37
(1984). http://dx.doi.org/10.1016/0009-2614(84)85300-2 CHPLBC 0009-2614 Google Scholar
J. Malickaet al.,
“Effects of metallic silver island films on resonance energy transfer between N,N-(dipropyl)-etramethylindocarbocyanine(Cy3)- and N,N-(dipropyl)-tetramethylindodicarbocyanine(Cy5)-labeled DNA,”
Biopolymers (Biospectroscopy), 70 595
–603
(2003). Google Scholar
J. Zhanget al.,
“Enhanced Forster resonance energy transfer on single metal particle. 2. Dependence on donor—acceptor separation distance, particle size, and distance from metal surface,”
J. Phys. Chem. C., 111 11784
–11792
(2007). http://dx.doi.org/10.1021/jp067887r JPCCCK 1932-7447 Google Scholar
A. BlumenJ. Mantz,
“On the concentration and time dependence of the energy transfer to randomly distributed acceptors,”
J. Chem. Phys., 71
(11), 4694
–4702
(1979). http://dx.doi.org/10.1063/1.438253 JCPSA6 0021-9606 Google Scholar
A. BlumenJ. KlafterG. Zumofen,
“Influence of restricted geometries on the direct energy transfer,”
J. Chem. Phys., 84
(3), 1397
–1401
(1986). http://dx.doi.org/10.1063/1.450481 JCPSA6 0021-9606 Google Scholar
Z. GryczynskiJ. LubkowskiE. Bucci,
“Intrinsic fluorescence of myoglobin and hemoglobin,”
Meth. Enzymol., 278 538
–569
(1997). http://dx.doi.org/10.1016/S0076-6879(97)78030-3 MENZAU 0076-6879 Google Scholar
Z. Gryczynskiet al.,
“Time-resolved fluorescence of hemoglobin species,”
Biophys. Chem., 64 81
–91
(1997). http://dx.doi.org/10.1016/S0301-4622(96)02224-7 BICIAZ 0301-4622 Google Scholar
Z. GryczynskiT. TenenholzE. Bucci,
“Rates of energy transfer between tryptophane and hemes in hemoglobin assuming that the heme is planar oscillator,”
Biophys. J., 63 648
–653
(1992). http://dx.doi.org/10.1016/S0006-3495(92)81657-0 BIOJAU 0006-3495 Google Scholar
V. Raicu,
“Efficiency of resonance energy transfer in homo-oligonucleotidemeric complexes of proteins,”
J. Biol. Phys., 33 109
–127
(2007). http://dx.doi.org/10.1007/s10867-007-9046-z JBPHBZ 0092-0606 Google Scholar
A. I. Fabiinet al.,
“Strength in numbers: effects of acceptor abundance on FRET efficiency,”
Chem. Phys. Chem., 11 3713
–3721
(2010). http://dx.doi.org/10.1002/cphc.201000568 CPCHFT 1439-4235 Google Scholar
I. L. Medintzet al.,
“Resonance energy transfer between luminescent quantum dots and diverse fluorescent protein acceptors,”
J. Phys. Chem. C., 113 18552
–18561
(2009). http://dx.doi.org/10.1021/jp9060329 JPCCCK 1932-7447 Google Scholar
L. Medintzet al.,
“Self-assembled nanoscale biosensors based on quantum dot FRET donors,”
Nat. Mater., 2 630
–638
(2003). http://dx.doi.org/10.1038/nmat961 NMAACR 1476-1122 Google Scholar
I. Gryczynskiet al.,
“Nonlinear curve-fitting methods for time-resolved data analysis,”
FLIM Microscopy in Biology and Medicine, 341
–370 Chapman and Hall/CRC, Boca Raton, Florida
(2009). Google Scholar
R. E. DaleJ. Eisinger,
“The orientation freedom of molecular probes: the orientation factor in intermolecular energy transfer,”
Biophys. J., 26 161
–194
(1979). http://dx.doi.org/10.1016/S0006-3495(79)85243-1 BIOJAU 0006-3495 Google Scholar
Z. GryczynskiI. GryczynskiJ. R. Lakowicz,
“Basic of fluorescence and FRET,”
Molecular Imaging. FRET Microscopy and Spectroscopy, 21
–56 Oxford University Press, New York
(2005). Google Scholar
|


