
|
|
1.IntroductionFluorescence resonance energy transfer (FRET) is a wide-spread and versatile method to measure protein-protein interaction inside cells. A commonly used FRET pair consists of the autofluorecent proteins: cyan fluorescent protein (CFP) and yellow fluorescent protein (YFP).1,2 FRET efficiencies can easily be measured in so-called acceptor photobleaching experiments. The idea of the acceptor photobleaching experiment is to bleach the acceptor (YFP) and to measure the increase of the donor intensity (CFP) due to its unquenching.3,4 Valentin and colleagues5 described a photoconversion of YFP to a “CFP-like” species. As the fluorescent spectra of CFP and the photoproduct show a big overlap [Fig. 1(d)] it is possible that this photoconversion has an impact on FRET efficiencies calculated from acceptor photobleaching experiments of this FRET pair. Whether this light-induced photoconversion is affecting the calculation of FRET efficiencies has been discussed controversially.6–8 Nevertheless, until now it has neither been investigated quantitatively, nor has it been compared to the increase due to donor (CFP) unquenching in acceptor (YFP) photobleaching experiments. Thus it is unclear how, and under which conditions the calculation of FRET efficiencies is influenced by this photoconversion. Our study aimed to close this gap and provide a tool to correct the calculation of FRET efficiencies by specifying the contribution of the photoconversion. 2.Materials and MethodsVero cells were grown in glass bottom culture dishes (MatTek, Ashland, USA) for 24 h at 37°C in minimum essential medium (MEM) containing fetal calf serum under an atmosphere of 5% . Imaging was carried out after transfection for at least 16 h with a plasmid, which expresses cytoplasmatically either an enhanced cyan fluorescent protein–enhanced yellow fluorescent protein (ECFP-EYFP) linker construct9 or EYFP only. All measurements with living cells were performed at 37°C in 2-[4-(2-hydroxyethyl)piperazin-1-yl]ethanesulfonic acid (HEPES) buffered media. Acceptor photobleaching experiments were performed mainly on a Zeiss LSM 510 meta confocal microscope (although it should be mentioned that the effect of photoconversion was observable on a Leica SP5 and a Fluoview1000 confocal microscope as well). We used a 63x Planapochromat 1.4 N.A./DIC objective. EYFP was excited with the 514 nm line of the argon laser (Lasos, LGK 7812 ML4, 30 mW) and ECFP with the 405 nm line (405 diode laser 10 mW), respectively. After passing the main dichroic mirror (HFT 405/514) the fluorescence signal was split into two channels (NFT515) and detected using the photomultipliers with the corresponding band-pass filters (blue channel: 420 to 480 nm for ECFP and green channel: 530 to 560 for EYFP). The pinholes of both channels were completely open, as only one plane was imaged and confocality was not necessary. Bleaching experiments were performed as follows: A region of interest was chosen (in the case of living cells this region included the entire cell to avoid local diffusion artefacts). Before starting the repetitive bleaching procedure, five prebleaching images were recorded in both channels. The laser intensity for recording was adjusted to avoid detectable photobleaching. Typically the power of the 405-nm laser was between 1 to 5 µW and 2 to 8 µW for 514 nm, respectively, in the sample plane. After the prebleaching phase consecutive cycles of bleaching in the region of interest (with 514 nm at 50% transmission of the AOTF, corresponding to 200 µW in the sample plane) and sequential imaging of the blue and green channels were performed. Usually 40 to 50 bleaching steps were performed until EYFP was hardly detectable in the region of interest [Fig 1(a)]). Fig. 1Photoconversion of EYFP to a CFP-like species depends on the initial EYFP concentration. Vero cells expressing EYFP cytoplasmatically in different amounts were repetitively photobleached to induce a photoreaction leading to a CFP-like species and imaged under quantitative imaging conditions. Four different stages of bleaching are shown (a) and (b). The blue detection channel is shown in the upper row, and the green channel below. The gain of the green detection channel needed to be adjusted to adapt to the different EYFP concentrations inside the cell, whereas the gain in the blue channel stayed constant. Due to the different detector gain settings of the PMT the cells in (a) and (b) appear to have the same brightness. In fact the YFP concentration of the cell in (a). is 80 times higher compared with the cell in (b). Low gain corresponding to higher EYFP concentration (a). High gain corresponding to lower EYFP concentration (b). [compared with (a)]. (c) and (d) The mean intensity of the bleached cell for the different channels is plotted versus the number of bleaching steps. Only in the case of the higher EYFP concentration (a) and (c) an increase in the blue channel is detectable, whereas the amount of CFP-like species was below the detection threshold at the lower EYFP concentration (c) and (d). Fixed cells expressing either ECFP or EYFP were excited with a 405-nm diode laser and the fluorescence emission spectra were recorded (e). YFP emission spectra were imaged prior and after photoconversion to a CFP-like species. 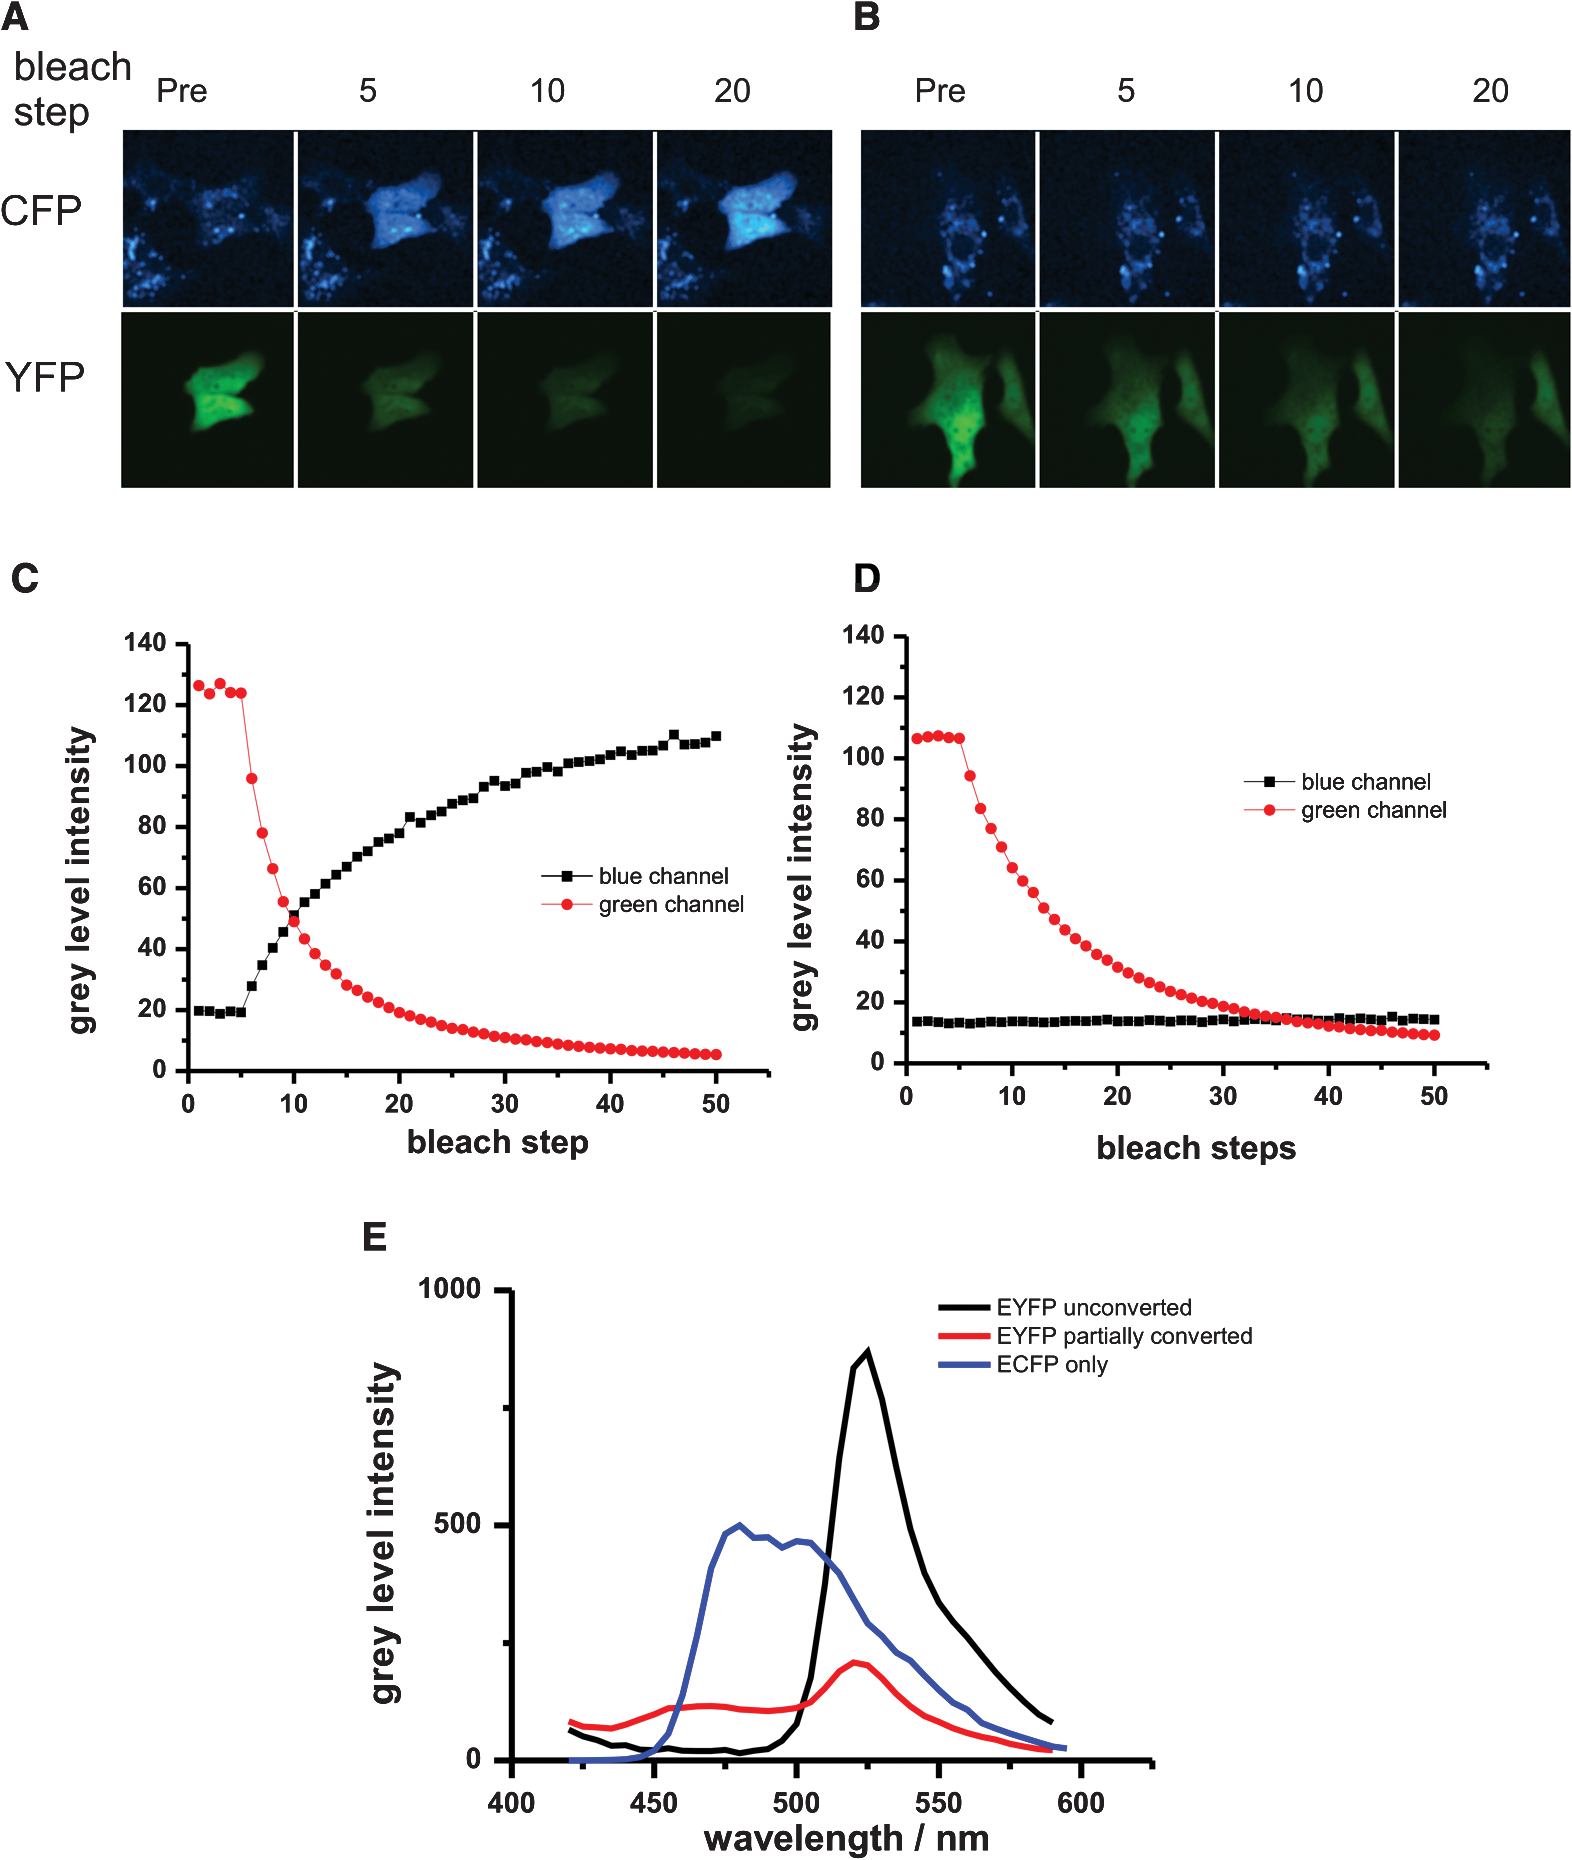 All power measurements were performed with the X-Cite XP750 & XR2100 (Lumen Dynamics), which allowed measurements in the sample plane (using the Planapochromat 1.4 N.A./DIC objective). The fluorescent emission spectra of CFP and the product of the photoconversion were recorded with an Olympus Fluoview 1000 confocal microscope. Spectra were recorded between 420 and 590 nm in steps of 5 nm. The main task of the study was to compare the intensity increase in the donor channel obtained in a FRET acceptor photobleaching experiment, with the increase in the same channel due to photoconversion of EYFP to a CFP-like species. Due to very different intensity levels, it was not possible to use exactly the same settings for the comparison (it would have led to either saturated images or too noisy signals, especially in the CFP channel, making them useless for quantitative measurements). Thus it was necessary to use different settings for the confocal imaging. For quantitative comparison of images, it is necessary to find a function/procedure which allows normalizing images taken at different conditions. The main criterion was to obtain images with unsaturated pixels and a reliably detectable signal on the other hand. In principal there are three main parameters [pixel dwell time, excitation intensity, and photomultiplier tube (PMT) gain], which could be changed to tackle this issue. Changing the pixel dwell time and the excitation intensity might also lead to different bleaching behavior which would influence the normalization procedure. Additionally the amount of photons emitted depends on the excitation intensity and the concentration of the fluorophores in the confocal volume as well [Fig. 2(a)]. The mean intensity increase of cells with different EYFP concentrations is not only dependent on the excitation intensity, but also depends on the initial fluorophore concentration (the higher the initial concentration the higher the increase). Therefore, it was necessary to keep the excitation intensities for EYFP and ECFP constant throughout the entire experiment. Fig. 2Calibration curves for the PMT of a confocal microscope. Images of EYFP expressing cells were recorded with a Zeiss LSM510 meta. Either the excitation intensity or the detector gain was varied. The mean intensity of three different cells was plotted against the used laser intensities [514 nm (a)]. Up to 5% AOTF transmission, the increase is nearly linear dependent on the laser intensity with the slope reflecting the EYFP concentration. Thus, the EYFP concentration of two different cells recorded with different excitation intensities can only be compared quantitatively, if measurements of at least at three different laser intensities are made. The mean intensity of three different cells was plotted against the different gain settings used [circles, squares, and triangles (b)]. When plotted on a logarithmic scale, an almost linear relationship between gain and mean cell intensities was obtained. The different curves could be fitted globally to obtain the slope of the logarithmic function [] with being the mean intensity and the arbitrary gain values (lines are the result of the global fit to the data). The global fit returned with . Acceptor photobleaching FRET experiment for a ECFP-EYFP linker construct (c). Images were taken with a confocal microscope (Zeiss LSM510 meta), EYFP was bleached repetitively with 514 nm. The mean intensities of the entire cell in the blue (squares) and the green (circles) channels were plotted against the number of bleaching steps. Bleaching EYFP leads to an intensity increase in the blue channel due to unquenching. The (apparent) FRET efficiency can be calculated from the maximal increase in the blue channel, which was 40%.  As a consequence of the fixed laser intensity, the PMT gain needed to be changed depending on the initial EYFP or ECFP concentration. To compare images taken at different gain settings, it was necessary to record a calibration curve for different gain settings. Therefore at least three cells were recorded with different gain settings, but with the same excitation intensity and pixel dwell time. The mean pixel intensity of the area covered by the cells (either in the blue or green channel) was plotted versus the arbitrary units of the PMT gain [Fig. 2(b)]. The resulting curves could be fitted globally using ORIGIN (Origin 7.5 G, OriginLab Corporation) with an exponential function []; with being the mean pixel intensity inside the cell and the different gain values of the PMT. The slope of the exponential function could be used to normalize images taken at different gain settings. A gain independent and thus comparable parameter, or was calculated using the following procedure: From bleaching or unquenching curves [Fig. 1(c) and 1(d)] the change in intensity for either CFP or YFP was extracted [ or respectively; Fig. 2(c)]. These parameters or were corrected for the background fluorescence in the blue/green channels. For the background was defined as the mean pixel intensity in the region of interest before bleaching YFP [dashed line, Fig. 2(c)]. For the background was set to the minimal value after bleaching YFP. This correction is important as the background pixel intensity scales with the PMT gain. As this increase is dependent on the gain setting of the PMT, it had to be corrected using the formula: , with the gain value of the PMT and the value, which was extracted from the calibration measurement ( had to be corrected in the same way, only using the corresponding calibration parameter ). These corrected mean intensities are proportional to the absolute concentration of the fluorophores, and thereby it is possible to directly compare images taken at different gain settings. To measure FRET efficiencies [Fig. 2(b)] prebleach images of ECFP and EYFP were recorded, a selected region of interest (ROI) was bleached repetitively with the 514-nm laser line (100% intensity corresponding to 300 µW in the sample plane) until it was indistinguishable from the background, and postbleach images were captured immediately thereafter. FRET in the ROI was detected by an increase in ECFP fluorescence intensity (donor unquenching) due to the EYFP (acceptor) bleaching. 3.Results and DiscussionUnder quantitative imaging conditions, as described in Sec. 2, we measured the intensity changes in the blue channel after bleaching EYFP (either with a ECFP-EYFP linker construct or with EYFP only). We used the method of repetitive acceptor photobleaching4,10 consisting of repeated cycles of bleaching the acceptor (EYFP at 514 nm), and then imaging the donor and acceptor channels, respectively. Compared to experiments with only one bleaching step, this method has the advantage that a gradual decrease in the green channel can easily be correlated to the corresponding increase in the blue channel, and end values can be reliably extrapolated even from incomplete bleaching experiments, to avoid errors by direct bleaching of the donor. Comparative measurements were done with Vero cells expressing either EYFP alone or with cells expressing a ECFP-linker-EYFP construct, which is often used as a FRET positive control.9 This enables us to quantify and compare the FRET signal directly with the signal obtained from the photoconversion. Upon bleaching EYFP in cells expressing only EYFP we find that the increase in the blue channel is dependent on the EYFP concentration in the bleached area. An intensity increase in the blue channel could only be detected in cells with a high EYFP concentration [Fig. 1(a) and 1(c)], whereas in cells with a considerably lower EYFP concentration no increase could be measured [Fig. 1(b) and 1(d)]. These initial findings triggered the decision to investigate this topic in more detail. A variety of cells with different EYFP concentration were bleached. The gain independent increase in the blue channel () was plotted against the corrected decrease in the green channel [ which is directly proportional to the EYFP concentration; Fig. 3(a)]. If the YFP concentration is below a certain threshold it becomes almost impossible to detect an increase in the blue channel, although the decrease in the green channel can easily be detected. If not plotted on a logarithmic scale [Fig. 3(a), inset] it turns out that the increase in the blue channel is linearly linked to the decrease in the green channel or the YFP concentration, respectively. This linear relationship demonstrates that the photoconversion is a ubiquitous process (at least under the bleaching conditions used in our experiments). Although at low YFP concentrations the increase in the blue channel is so little that it becomes hardly detectable. In fact, this finding might be one reason why several groups were not able to detect the photoproduct of the YFP photoconversion. Quantitative imaging conditions as described in this study make it possible to compare the contribution of the photoconversion directly with the intensity increase due to donor unquenching. The linear dependency of both reactions allows the extraction of a parameter, which is independent of the YFP concentration [Fig. 3(a), slope of the line]. For a one-to-one stoichiometry of ECFP to EYFP, as given in a ECFP-linker-EYFP construct, the contribution of the photoconversion is small compared with the FRET signal [Fig. 3(b)]. At 405 nm excitation, it is in the order of 6% of the increase in a sample with a FRET efficiency of 0.4 [Fig. 3(c)]. This corresponds to an extra contribution to the FRET efficiency of 0.015 by YFP photoconversion. Additionally the CFP-like species is relatively well excitable by 405 nm (or UV), but less excitable by 458 nm (5 to 6 times less bright).5 This leads to less impact on acceptor photobleaching studies carried out with ECFP excitation at 458 nm. Fig. 3Photoconverted signal compared with the FRET signal. The intensities of the blue and the green channel were normalized to compensate for the different gain settings (a). After normalization the increase in the blue channel after EYFP photobleaching was plotted against the decrease in the green channel. This illustrates that below a certain YFP concentration no photoconversion to a CFP-like species could be detected. The increase in the blue channel is linearly proportional to the decrease in the green channel, which reflects the initial EYFP concentration (inset). The shown error bars were derived by Gaussian error propagation. Signal increase in the blue channel normalized to the initial EYFP concentration after photobleaching of EYFP or ECFP-linker-EYFP expressing cells, respectively (b). For a one-to-one stoichiometry, similar to the linker construct, the contribution of the photoconversion (green bars) is small compared with the FRET signal (red bars) after acceptor-photobleaching. This was observed in live cells as well as in fixed samples. The error bars in the diagram correspond to the error of a linear regression plotting . versus . The exact number n of individual data points used for the regression is given in the diagram. The signal of the photoconversion is about 10 times smaller than the FRET signal (c). Thus if the YFP concentration is 10 to15 times the CFP concentration, the signal from the photoconversion is in the same order as the signal obtained from unquenching. The photoconversion was measured for four different YFP mutants under the same experimental conditions (d). Venus and citrine showed about a 10-fold decreased conversion efficiency compared with EYFP. The error bars in the diagram correspond to the error of a linear regression plotting . versus . The exact number of individual data points used for this regression is given in the diagram.  As it is known11 that formaldehyde fixation affects the brightness of fluorescent proteins, we also repeated the former experiment with fixed cells [Fig 3(b)]. Also in this case, the contribution of the photoconversion was small compared with the signal obtained from ECFP unquenching. In the past years, variants of the original EYFP protein were becoming more and more popular. To rule out that the described photoconversion is a unique property of EYFP, control experiments with various YFP mutants were performed. Cells expressing a protein cytoplasmically, which was linked to either citrine,12 venus,13 or syfp214 were bleached as described in Sec. 2. All of these mutants clearly showed photoconversion behavior in living as well as in fixed cells. However, it has to be noted that the amount of photoconversion varies substantially for the different mutants [Fig. 3(d)]. The photoconversion efficiency of citrine and venus is about 10 times smaller compared with that of EYFP. The behavior of YPet was not investigated in this study, because the sensitivity increase reported for CyPet-YPet FRET sensors was reported to strongly depend on enhanced dimerization,15 which might influence the measured FRET efficiency. As in many FRET experiments, donor and acceptor are on separate proteins, the local YFP/CFP ratio is not known and may vary considerably. In the cases of weak FRET interactions and/or high-YFP and low-CFP concentrations, the contribution of YFP photoconversion might significantly influence the calculation of the FRET efficiency in acceptor photobleaching experiments. However, by using quantitative imaging conditions the amount of photoconversion can be determined and the FRET efficiency can be corrected. We have quantitatively investigated the EYFP photoconversion, which leads to a so-called CFP-like species. The effect has been described before but has never been compared directly with the FRET signal, which is obtained by acceptor photobleaching. Using quantitative imaging conditions, we show that the contribution of the photoconversion linearly depends on the initial EYFP concentration, and is small compared with the increase due to unquenching, at least if the ratio of ECFP/EYFP is close to one. But even more important: we provide a simple protocol to determine the contribution of the photoconversion. Thereby it is possible to correct the obtained FRET efficiency of acceptor photobleaching experiments to obtain more reliable FRET efficiencies. AcknowledgmentsWe thank Carl Zeiss and Olympus for the continuous support of the Advanced Light Microscopy Facility at the European Molecular Biology Laboratory. We are grateful to J. Rietdorf and Y. Belyaev for critically reading the manuscript, and to Gregor Reither who provided samples with YF variants. ReferencesT. S. Karpovaet al.,
“Fluorescence resonance energy transfer from cyan to yellow fluorescent protein detected by acceptor photobleaching using confocal microscopy and a single laser,”
J. Microsc., 209
(1), 56
–70
(2003). http://dx.doi.org/10.1046/j.1365-2818.2003.01100.x JMICAR 0022-2720 Google Scholar
D. W. PistonG. J. Kremers,
“Fluorescent protein FRET: the good, the bad and the ugly,”
Trends. Biochem. Sci., 32
(9), 407
–414
(2007). http://dx.doi.org/10.1016/j.tibs.2007.08.003 TBSCDB 0167-7640 Google Scholar
A. K. Kenworthy,
“Imaging protein-protein interactions using fluorescence resonance energy transfer microscopy,”
Methods, 24
(3), 289
–296
(2001). http://dx.doi.org/10.1006/meth.2001.1189 MTHDE9 1046-2023 Google Scholar
E. B. Van Munsteret al.,
“Fluorescence resonance energy transfer (FRET) measurement by gradual acceptor photobleaching,”
J. Microsc., 218
(3), 253
–262
(2005). http://dx.doi.org/10.1111/jmi.2005.218.issue-3 JMICAR 0022-2720 Google Scholar
G. Valentinet al.,
“Photoconversion of YFP into a CFP-like species during acceptor photobleaching FRET experiments,”
Nat. Method., 2
(11), 801
(2005). http://dx.doi.org/10.1038/nmeth1105-801 1548-7091 Google Scholar
C. Thaleret al.,
“Photobleaching of YFP does not produce a CFP-like species that affects FRET measurements,”
Nat. Method., 3
(7), 491
(2006). http://dx.doi.org/10.1038/nmeth0706-491a 1548-7091 Google Scholar
S. E. VerrierH. D. Soling,
“Photobleaching of YFP does not produce a CFP-like species that affects FRET measurements,”
Nat. Method., 3
(7), 491
–492
(2006). http://dx.doi.org/10.1038/nmeth0706-491b 1548-7091 Google Scholar
M. T. Kirberet al.,
“YFP photoconversion revisited: confirmation of the CFP-like species,”
Nat. Method., 4
(10), 767
–768
(2007). http://dx.doi.org/10.1038/nmeth1007-767 1548-7091 Google Scholar
T. Zimmermannet al.,
“Spectral imaging and linear un-mixing enables improved FRET efficiency with a novel GFP2-YFP FRET pair,”
FEBS. Lett., 531
(2), 245
–249
(2002). http://dx.doi.org/10.1016/S0014-5793(02)03508-1 FEBLAL 0014-5793 Google Scholar
H. AmiriG. Schultzet al.,
“FRET-based analysis of TRPC subunit stoichiometry,”
Cell. Calcium., 33
(5–6), 463
–470
(2003). http://dx.doi.org/10.1016/S0143-4160(03)00061-7 CECADV 0143-4160 Google Scholar
S. V. Koushiket al.,
“Cerulean, Venus, and VenusY67C FRET reference standards,”
Biophys. J., 91
(12), L99
–L101
(2006). http://dx.doi.org/10.1529/biophysj.106.096206 BIOJAU 0006-3495 Google Scholar
A. A. Heikalet al.,
“Molecular spectroscopy and dynamics of intrinsically fluorescent proteins: coral red (dsRed) and yellow (Citrine),”
Proc. Natl. Acad. Sci. U. S. A., 97
(22), 11996
–12001
(2000). http://dx.doi.org/10.1073/pnas.97.22.11996 PNASA6 0027-8424 Google Scholar
T. Nagaiet al.,
“A variant of yellow fluorescent protein with fast and efficient maturation for cell-biological applications,”
Nat. Biotechnol., 20
(1), 87
–90
(2002). http://dx.doi.org/10.1038/nbt0102-87 NABIF9 1087-0156 Google Scholar
G. J. Kremerset al.,
“Cyan and yellow super fluorescent proteins with improved brightness, protein folding, and FRET Forster radius,”
Biochemistry, 45
(21), 6570
–6580
(2006). http://dx.doi.org/10.1021/bi0516273 1520-4995 Google Scholar
T. Ohashiet al.,
“An experimental study of GFP-based FRET, with application to intrinsically unstructured proteins,”
Protein. Sci., 16
(7), 1429
–1438
(2007). http://dx.doi.org/10.1110/(ISSN)1469-896X PRCIEI 0961-8368 Google Scholar
|


