|
|
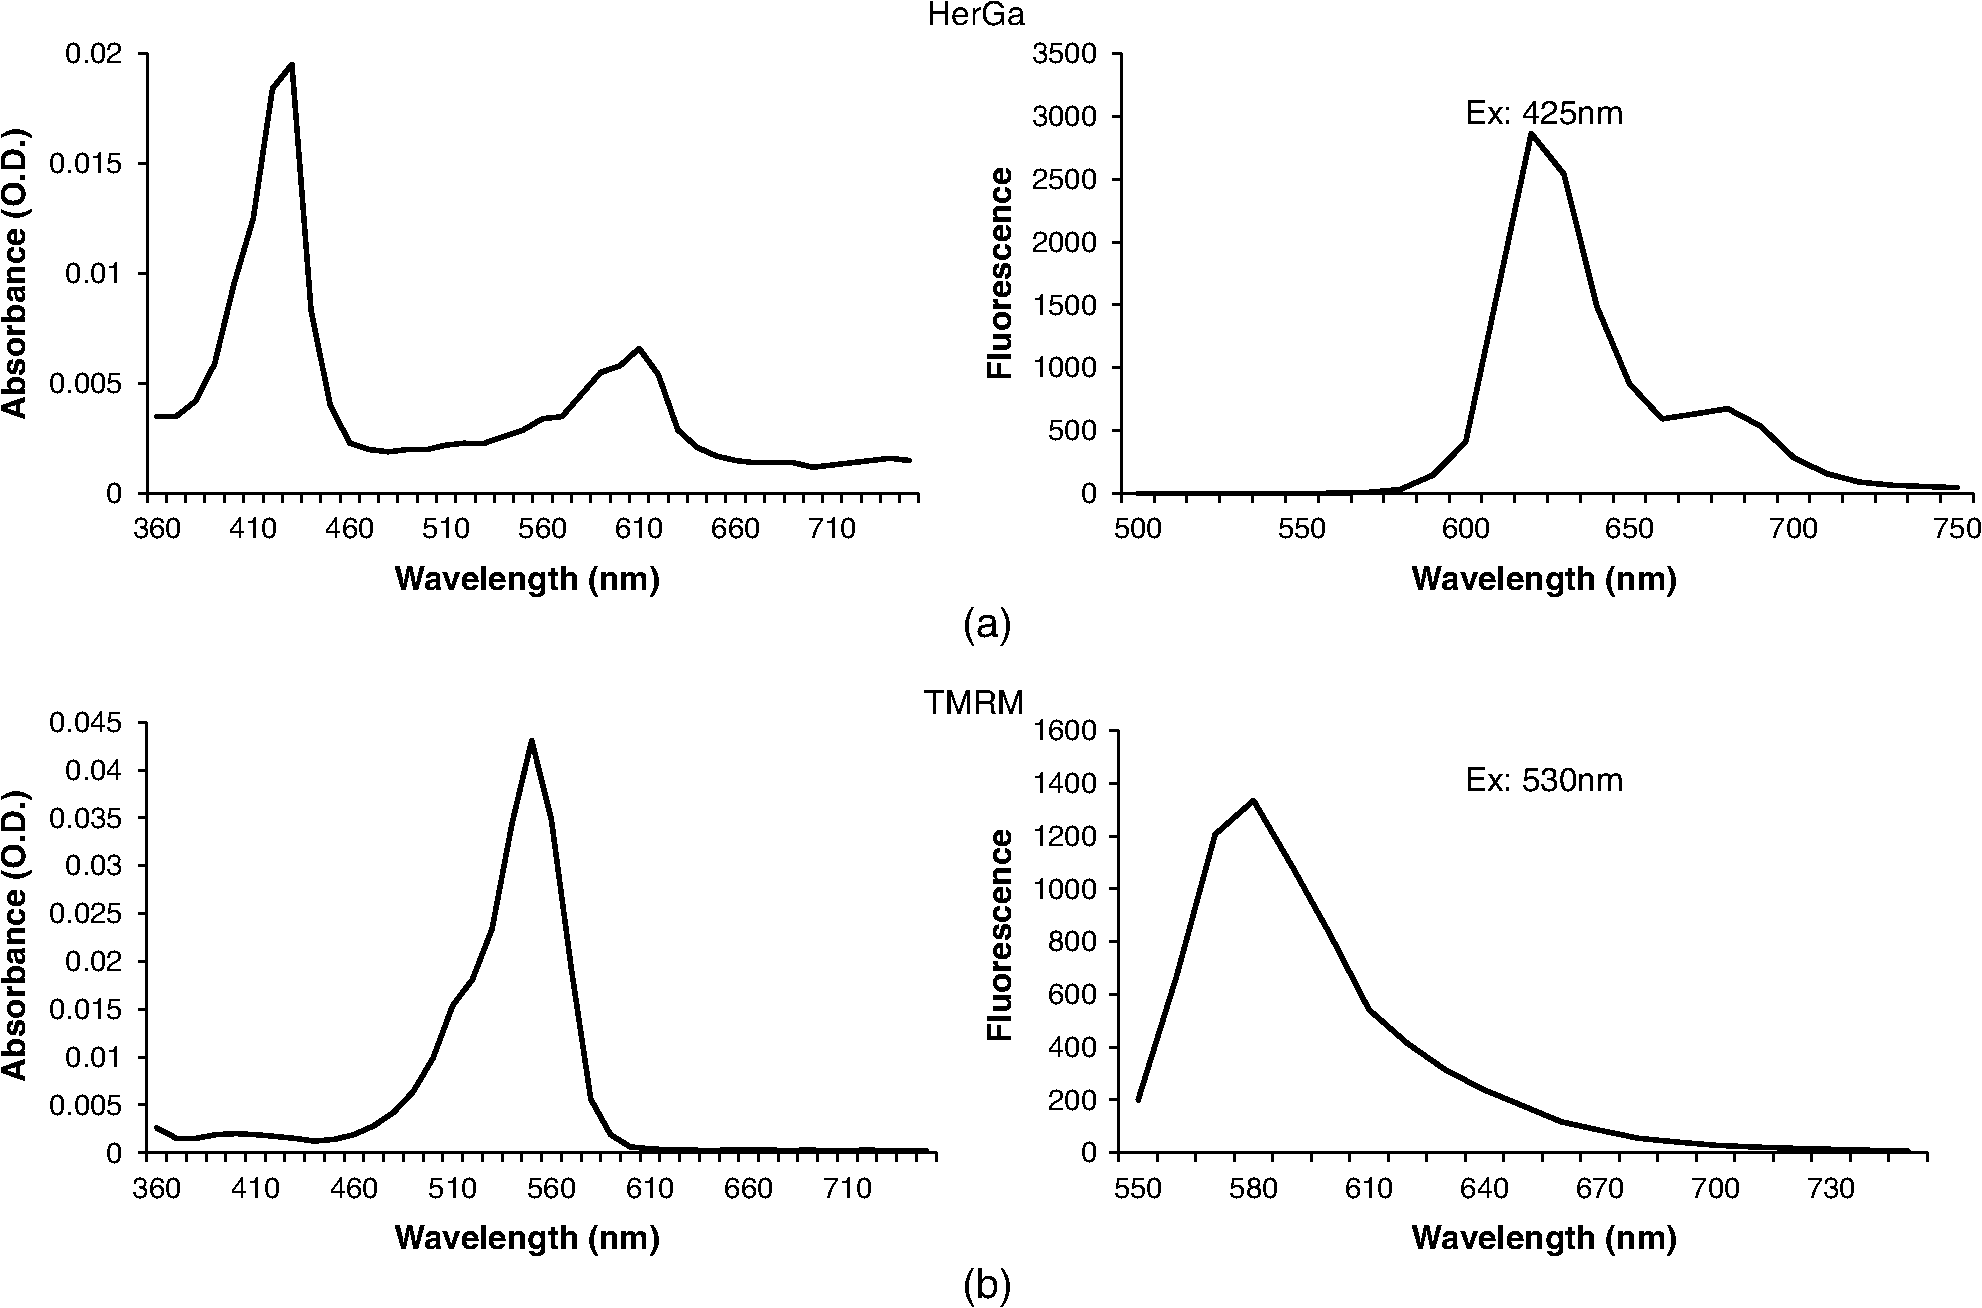
1.IntroductionNanotherapy is one of the newest and most promising approaches for cancer treatment. Currently, significant efforts are focused on development of novel tumor-targeted drug molecules, capable of simultaneous diagnosis and treatment by incorporating active molecules, targeting ligands, and imaging agents. We have recently developed a novel tumor-targeted drug molecule, which is a single self-assembled complex between a targeted cell penetration protein (HerPBK10) and a sulfonated gallium(III) corrole (S2Ga), for breast cancer treatment and detection.1–3 This targeted complex (called HerGa) results from spontaneous, noncovalent assembly of S2Ga and HerPBK10 and remains stably intact in serum after assembly.1 S2Ga, in which gallium(III) is chelated by the amphipolar corrole whose macrocycle is decorated by two sulphonic acid head groups, has structural similarity to porphyrins. It not only emits very intense red fluorescence but also is cytotoxic when allowed to penetrate through a cell membrane.1,2 HerPBK10, used as a carrier protein for the complex, contains moieties for DNA transport and targeted delivery to human epidermal growth factor receptor 2-positive () cancer cells. It binds DNA through a polylysine appendage while the EGF-like domain of the heregulin-alpha isoform is used as the targeting ligand.1 Thus, HerPBK10 specifically targets tumor cells, particularly MDA-MB-435 cells, in a receptor-specific manner and mediates the entry of targeting molecules in the cancer cells.4 Hence, when S2Ga is assembled with our HerPBK10, S2Ga can be targeted to and internalized by tumor cells, resulting in tumor-targeted toxicity.2 Importantly, since S2Ga alone, which is negative charged, is less able to breach a cell membrane without the membrane-penetrating HerPBK10 protein, HerGa is specifically toxic to target cells at 1 μM concentration whereas S2Ga is less toxic to target cells at the same concentration. Moreover, tumor targeting by HerGa can be readily visualized optically, owing to intense corrole fluorescence. Hence, HerGa can be used for both tumor detection and intervention.1,5 Our previous mechanistic study for HerGa6 showed that HerGa itself damages mitochondria of MDA-MB-435 cancer cells through induction of reactive oxygen species (ROS). In particular, HerGa disrupts mitochondrial membrane potentials in cells, indicating increased mitochondrial membrane permeability. In this study we have also observed, for the first time, that light at specific wavelengths promotes this disruption of mitochondrial membrane potential in HerGa-treated cells. Thus, we here tested whether such photoexcitation further modulates HerGa toxicity, using multimode optical imaging of live cells. In the present study, we have used multimode optical microscopy7 to characterize a newly discovered property of HerGa: augmentation of its inherent cytotoxicity by photoexcitation. The effect of HerGa on mitochondrial membrane potential of MDA-MB-435 cells in situ was examined quantitatively before and after light irradiation at specific wavelengths by measuring mitochondrial accumulation of a fluorescent cationic probe, Tetramethyl rhodamine methyl ester (TMRM), which exhibits no inhibitory effect on mitochondrial respiration when used at low concentrations,8 using confocal and two-photon excited fluorescence, DIC, and spectral imaging.9,10 In addition, photoinduced cytotoxicity of HerGa at different light wavelengths was investigated using standard epi-fluorescence imaging. We also tested whether red light enhances toxicity, suggesting that application in vivo is possible. Finally, we examined HerGa uptake using fluorescence lifetime imaging in order to determine the optimal time window for light dose delivery onto treated tumor cells. The complementary imaging modes used here can reduce measurement errors when implemented together, thus closing potential blind spots that cannot ordinarily be detected using a single imaging mode.11 The photoexcitation-enhanced toxicity by HerGa, in combination with its tumor-targeting and cell-penetration capacity, may enable further reduction of drug dosage and thus of possible side effects, thereby increasing therapeutic efficacy and safety.12,13 2.Materials and Methods2.1.MaterialsMDA-MB-435 cancer cells were obtained from the National Cancer Institute and maintained at Dulbecco’s modified Eagle’s Medium (DMEM), supplemented with 10% fetal bovine serum and penicillin/streptomycin at 37 °C, . HerPBK10 protein was expressed in Escherichia coli as a histidine-tagged fusion protein and purified by metal chelate affinity chromatography as described.14 HerGa was assembled by combining S2Ga with HerPBK10 at a molar ratio of and purified as previously described.2 TMRM was purchased from Invitrogen. Figure 1 shows the spectral features of absorption (left panel) and emission (right panel) for HerGa [Fig. 1(a)] and TMRM [Fig. 1(b)], respectively. 2.2.Mitochondrial Membrane Potential Measurement Using TMRMTMRM was used as a potentiometric cationic dye to measure mitochondrial membrane potential changes, which indicate mitochondrial membrane permeability,6 in MDA-MB-435 cells treated with indicated reagents. Its distribution across the mitochondrial membrane is governed primarily by the Nernst equation: ,9,15 where is the mitochondrial membrane electrical potential, is the charge of the permeable ion, is Faraday’s constant, is the ideal gas constant, is the absolute temperature, and and the mitochondrial and cytoplasm probe concentrations. Hence, accumulation of TMRM in intact mitochondria is reflected by an increase in their intracellular fluorescence intensity whereas diffusion into the cytoplasm reduces this. In general, for precise measurement of mitochondrial membrane potentials, equilibrium of TMRM accumulation in mitochondria is needed, and thus we here performed all the experiments after TMRM accumulation into mitochondria was equilibrated (equilibrium time: ). 2.3.Multimode Optical Microscope for Live CellsWe combined the capabilities of a Leica TCS SP5 two-photon imaging system and a Nikon TE 2000 microscope for multimode optical imaging, which includes epi-fluorescence, DIC, confocal, spectral, and fluorescence lifetime imaging modes, as shown in Fig. 2. For the two-photon excited fluorescence imaging, tunable femto-second (fs) pulsed laser light (100 fs) (Mai-Tai Ti-Sapphire laser, Spectra-Physics) is delivered to the Leica two-photon imaging system, and then the delivered light passes through an objective (, NA: 1.0, Leica) for excitation of samples. For spectral imaging, spectral selection is realized by an acousto-optic tunable filter (AOTF), and the analysis was performed using the spectral classification program we developed as previously described.16 In addition, for DIC imaging, DIC optics incorporated in the Leica system were utilized, with the images recorded by a CCD camera (Photometrics, Coolsnap HQ2). For fluorescence lifetime imaging, 424 nm fs pulsed laser light, which is generated from the second harmonic of 848 nm fs pulsed laser light (Spectra Physics, MaiTai) in a Beta Barium Borate (BBO) crystal, is delivered to cells through an objective in the Nikon TE 2000 microscope after passage through several mirrors, a diffuser, and a dichroic mirror. Fluorescence emission is recorded by a CCD connected to a time-gated intensifier (TGI) (LaVision, Picostar HR). Fig. 2Experimental setup for multimode optical imaging: fs pulsed laser light is delivered into the Leica and Nikon microscope for the excitation of specimens. For the fluorescence lifetime imaging, the fs pulsed laser light (424 nm) is frequency-doubled through a BBO crystal. The frequency-doubled pulsed laser light is delivered to samples in a delta chamber through several mirrors, a diffuser, a dichroic mirror, and an objective. Fluorescence detection is realized by TGI and CCD. For epi-fluorescence imaging, the filtered light from an Hg lamp is used to excite the samples. The fluorescence from the samples is recorded in CCD through an emission filter. For two-photon excited fluorescence imaging, fs pulsed light is directly delivered into the sample through a scan head, an iris, and an objective; then, the fluorescence is detected by a photomultiplier tube (PMT) through a shortpass filter, an iris, and AOTF. The CCD is used for DIC imaging.  2.4.Light Dosimetry for Inducing Phototoxity of HerGaFor light dosimetry, we utilized a mercury lamp incorporated in the microscopes. Light from the mercury lamp was filtered by excitation band-pass filters in filter-cubes and then delivered to cells through the objective utilized for imaging. The energy density for the light dosimetry was determined by the following equation: (unit: ), where ED is energy density, is light power, is irradiation time, and is area receiving light. Here the light power coming from the objective was measured using an optical power meter (ThorLabs). The area receiving light was determined by the field of view of the objective. 2.5.Multimode Optical Imaging of HerGa-Treated CellsIn order to investigate the effect of light on HerGa-mediated cytotoxicity, mitochondrial membrane potential/morphology changes, which indicate cellular health status, of MDA-MB-435 cells before and after light irradiation (450 to 490 nm, energy density: ) were monitored using multimode optical imaging, including two-photon excited confocal fluorescence, DIC, and spectral imaging.17 MDA-MB-435 cells were plated at cells per Delta (Bioptechs) chamber and incubated at 37 °C for 36 h before adding TMRM at 20 nM into the chamber. The cells were exposed to HerGa for three hours after mitochondrial accumulation of TMRM equilibrated in treated cells, and two-photon excited fluorescence imaging of TMRM and DIC imaging were performed in order to measure mitochondrial membrane potential and morphology changes of the cells before and after light irradiation, sequentially. Here the light irradiation of HerGa-treated cells was performed in the presence of intracellular TMRM to measure mitochondrial membrane potentials of live-cells, and fs pulsed light at 830 nm, which can excite TMRM very efficiently while barely exciting HerGa, was utilized for two-photon excitation of TMRM. The emission from TMRM within the spectral range 550 to 590 nm, in which the wavelength selection for fluorescence detection was achieved by AOTF, was collected by an objective. For the quantitative analyses we acquired images (a objective, with an additional magnification on the image side) at 30 different focal points within the 12 to 18 μm depth of the specimen (depending on cell thickness); then, the -stack maximum intensity projection of images were constructed using an analysis program incorporated in the Leica system. In addition, in 30 min after the light irradiation, we acquired the TMRM two-photon excited images again and performed spectral imaging and analysis for the discrimination between HerGa and TMRM inside cells in order to validate the mitochondrial membrane potential disruption and particularly to assess its reversibility through examination of HerGa and TMRM localization in the cells. In particular, we utilized fs pulsed light at 780 nm for two-photon excitation of HerGa rather than using the fs pulsed light at 830 nm used for excitation of TMRM since the light at 830 nm barely excites HerGa. The emitted light within the 590 to 650 nm range was selected by AOTF for HerGa fluorescence detection. However, the fs pulsed light at 780 nm can still excite TMRM considerably. Thus, the spectral imaging and analysis was performed to discriminate between HerGa and TMRM. For the spectral imaging and analysis, 14 images were acquired within the spectral range of 550 to 680 nm with step size of 10 nm and followed by analysis using the spectral classification program we developed as previously described.14 2.6.Wavelength-Dependence of HerGa Photo-ReactivityTo assess wavelength-dependence of HerGa photo-reactivity, we monitored mitochondrial membrane potential changes of the cells pretreated with HerGa, S2Ga, and PBS for several light doses (, , , , , and ) at different wavelengths (425, 488, 530, and 640 nm), which were selected based on the absorption spectrum of HerGa. The wavelength selection for light dosimetry was performed using bandpass filters, through which the selected light was delivered to samples through a objective incorporated in the Nikon microscope. TMRM fluorescence images were recorded using the same objective and a Cy3 filter cube (ex: , em: ) to examine mitochondrial membrane potentials of the cells. In addition, for quantitative analysis, we calculated the fluorescence intensity ratios between mitochondria and cytoplasm sites, which represent the relative mitochondrial membrane potential value.8,9,18 For the calculation of the ratio, we measured average fluorescence intensity at 10 different mitochondrial regions and one mitochondria-free region for cytoplasm, which was selected around the nucleus, within the cells at three different fields of view (see Fig. 3). Fig. 3Light wavelength-dependent disruption of mitochondrial membrane potential in cells treated with HerGa or controls: TMRM fluorescence images of cells treated with HerGa (1 μM), S2Ga (1 μM), or PBS were obtained after light irradiation at different wavelengths (425, 488, 535, and 640 nm) and with different energies per area (, , , , , and ) using epi-fluorescence imaging (objective: , excitation: 535 nm and emission: 580 nm). Graphs depict the ratio of average fluorescence intensities for mitochondria:cytoplasm of selected cells ( cells per a field of view). Arrows indicate the cytoplasmic and mitochondrial regions, respectively.  2.7.Mitochondrial Damages of HerGa-treated Cells by Red LightIn addition, in order to examine whether red light (590 to 630 nm) also enhances HerGa-mediated mitochondrial damage, the pretreated cells with 1 μM HerGa and PBS received deep-blue light (414 to 434 nm, ) and red light (590 to 630 nm, ) at only confined areas through a objective respectively before TMRM addition and then 1 ml of 20 nM TMRM was added to the cells after they were washed with PBS. TMRM fluorescence and bright-field images of the cells were recorded using the system with a objective at two hours after the TMRM addition. The images of TMRM fluorescence were overlaid with bright-field images for topological comparison. In addition, for quantitative analysis, mean intensities of TMRM fluorescence of the areas receiving the light were calculated using Image J. 2.8.Fluorescence Lifetime Imaging of HerGaFluorescence lifetime imaging of HerGa was performed by exciting HerGa with 424 nm fs pulsed laser light in order to examine whether HerGa fluorescence lifetime could be used as a live-cell indicator to signal the optimal timing at which photoexcitation should be applied. The fluorescence lifetime images of HerGa were acquired at different time points (3, 10, 20, 40, 60, and 70 min) after the addition of 25 μM HerGa to cells growing in a Delta chamber to monitor internalization. A total of 28 images were acquired (; time step: 200 ps; gate width: 600 ps, Ex: 424 nm, Em: , light pulse width: 100 fs) and analyzed using the single-exponential decay fitting method, and then the (pseudocolor) fluorescence lifetime images were constructed. In addition, we evaluated the fitting significance by comparing the single and double-exponential fittings of the data obtained at 3 and 20 min, using MATLAB 7.8. 2.9.Examination of Light-Induced Cytotoxicity of HerGa During Internalization into MDA-MB-435 CellsIn addition to the fluorescence lifetime imaging of HerGa during uptake, light-induced cytotoxicity changes of HerGa were examined during internalization into MDA-MB-435 cells. The cells were plated at cells per Delta chamber and incubated at 37 °C for 36 h before adding TMRM at 20 nM into the chambers respectively. After mitochondrial accumulation of TMRM was equilibrated, TMRM and DIC images at different focal planes (thickness: , step: 1 μm) were acquired; then, 1 μM HerGa (final concentration) was added into the cells, and the cells in each chamber received light at 424 nm () at different time points (no treatment, 5, 30, 60 min) after HerGa addition respectively. After the light irradiation, TMRM and DIC images at the focal planes were acquired again and then the -stack maximum intensity projection images were constructed. For quantitative analysis, we also calculated the average fluorescence intensity ratio in between mitochondria and cytoplasm sites in the images obtained before and after light irradiation, as described previously, and then the average ratios were compared, after normalization by the average value obtained before light irradiation. 3.Results3.1.Light Specifically Increases HerGa-Mediated Mitochondrial Membrane Potential DisruptionTo assess the effect of light on HerGa-mediated cytotoxicity, mitochondrial membrane potential/morphology changes (indicating cellular health status) of MDA-MB-435 cells before and after light irradiation were monitored using multimode optical imaging, including two-photon excited confocal fluorescence, DIC, and spectral imaging.17 Two-photon imaging of live cells shows that HerGa treatment (1 μM) without light irradiation reduces TMRM accumulation in mitochondria in comparison to S2Ga-treated (1 μM) [Fig. 4(c), left panel] and control (PBS—treated) cells [Fig. 4(d), left panel]. Thus, TMRM fluorescence in HerGa-treated cells [Fig. 4(a), left panel] is relatively less than the fluorescence in S2Ga- and PBS-treated cells without light irradiation. However, this reduction in the HerGa-treated cells is enhanced further by light irradiation [Fig. 4(a), middle panel], and is accompanied by a rounded morphology [Fig. 4(b), right panel] consistent with detaching cells that is not observed in the cells treated without light [Fig. 4(b), left panel]. Importantly, light alone, or in combination with S2Ga and PBS, does not produce this significant effect [Figs. 4(c) and 4(d)] compared to HerGa. Fig. 4Mitochondrial membrane potential/morphologic changes of cells receiving HerGa treatment before and after light irradiation and spectral imaging to distinguish HerGa from TMRM: The TMRM fluorescence images of treated cells were acquired before and after light irradiation using two-photon excited confocal fluorescence imaging. Meanwhile, the DIC images were acquired before and after light irradiation using a CCD camera coupled with the two-photon imaging system. After the light irradiation, HerGa could be discriminated from TMRM by collecting the two-photon excited fluorescence images within the spectral range of 550 to 680 nm with a step size of 10 nm. (a) TMRM fluorescence images of HerGa-treated cells before (left) and after the light irradiation (middle and right at 30 min). (b) DIC images before and after light irradiation. (c) TMRM fluorescence images of S2Ga treated (left) and (d) control cells (PBS) (right) light (450 to 490 nm, ). (e) HerGa fluorescence image (left) and spectral classification image (right, red: HerGa, green: TMRM).  In addition, we further examined the mitochondrial membrane potential reversibility and the localization of HerGa and TMRM after the light irradiation. Particularly, the TMRM image [Fig. 4(a), right panel] acquired at 30 min after the light irradiation shows that TMRM does not redistribute across the mitochondrial membrane reversibly, thus indicating the nonreversibility of the mitochondrial changes. Additionally, to validate that the fluorescence acquired from this imaging reflects that emitted by TMRM rather than by HerGa, as well as to examine localization of TMRM and HerGa in the cells after the light irradiation, spectral imaging and analysis were performed to separate HerGa from spectrally overlapping TMRM fluorescence signals. The spectral classification images [Fig. 4(e), right panel] show that while HerGa is indeed accumulated inside cells that have undergone mitochondrial disruption, TMRM from mitochondria is diffused into the cytoplasm, as well as extracellularly, consistent with mitochondrial membrane potential collapse and in contrast to control (PBS-treated) cells. Taken together, these results show that two-photon/DIC/spectral imaging allows us to monitor and measure the mitochondrial membrane potential and morphologic changes of the HerGa-treated cells light. Thus, we can conclude that the mitochondrial membrane potentials of HerGa-treated cells are significantly disrupted by light irradiation and that this effect is not reversible after the light irradiation. 3.2.HerGa-Mediated Disruption of Mitochondrial Membrane Potential is Dependent on Photoactivating Light WavelengthWe next examined whether HerGa-mediated cytotoxicity is dependent on light wavelength by measuring the disruption of mitochondrial membrane potential at selected excitation wavelengths of 425, 488, 535, and 640 nm, chosen based on the absorbance peaks of HerGa. Figure 3 shows that the mitochondrial membrane potential of HerGa-treated cells dramatically decreases after of light irradiation at 425 nm compared to S2Ga and PBS-treated cells. In particular, light irradiation does not induce any detectable mitochondrial membrane potential disruption in PBS-treated cells. The mitochondrial fluorescence decrease of all treated cells is also shown in the 535 nm light irradiation, thus indicating that the change is mainly caused by photobleaching of TMRM due to the light irradiation since 535 nm wavelength of the light significantly overlaps the excitation wavelengths for TMRM. Finally, 640 nm moderately decreases the mitochondrial membrane potential of HerGa-treated cells. Altogether, these results show that light at 424 nm wavelength produces the most effective toxic effect in HerGa-treated cells, and the toxic effect is dependent on the absorption spectra of HerGa. 3.3.Long Wavelength Light Can Promote Mitochondrial Damage of HerGa-Treated CellsFigures 3 and 4 show that deep blue light promotes mitochondrial damage of HerGa-treated cells most effectively. However, this approach may not be suitable for in vivo applications since the penetration depth of the blue light through tissues is very limited (to a few millimeters at best,19 and typically much less). Longer wavelength light, on the other hand, would allow for excitation of HerGa in deep tissue. Fortunately, the gallium-metallated corrole used here exhibits a secondary absorption peak around 620 nm.20 Thus, we tested whether red light (590 to 630 nm) can also augment the mitochondrial damage of HerGa-treated cells. For a comparison, we applied deep blue light (414 to 434 nm) and red light (590 to 630 nm) on confined areas of 1 μM HerGa-pretreated cells through a objective, respectively, and then added TMRM to the cells for the measurement of mitochondrial membrane potential. While the mitochondrial membrane potential of the cells only receiving each light at respective wavelengths is disrupted, the cells outside of this field (i.e., not receiving the light) retained the mitochondrial membrane potential, as shown in Figs. 5(a) and 5(b). In contrast, the control cells (mock-treated) receiving the light at 590 to 630 nm did not exhibit any significant collapse of mitochondrial membrane potential [Fig. 5(c)]. In addition, as shown in the quantitative analysis Fig. 5(d)), while the mean intensity of TMRM fluorescence of the HerGa-treated cells receiving the blue light dose not differ significantly compared to the mean fluorescence intensity of the cells receiving the red light, it is much lower than that of the control (PBS) cells receiving the red light. Thus, these results indicate that red light (590 to 630 nm), able to penetrate deeper into tissue due to its significantly lower scattering, can also promote mitochondrial damage of HerGa-treated cells and suggests that it may be possible to introduce light-augmented cytotoxicity of HerGa in vivo. Fig. 5Mitochondrial disruption of HerGa-treated cells by red light. TMRM fluorescence images were acquired at two hours after the addition of TMRM to cells treated with 1 μM HerGa and PBS. Cells within the confined area only (delineated by a dotted line) received either deep blue light (414 to 434 nm) or red light (590 to 630 nm), where indicated. (a) Overlaid TMRM fluorescence and transmission image of HerGa-treated cells receiving deep blue light. (b) Overlaid TMRM fluorescence and transmission image of HerGa-treated cells receiving red light. (c) Overlaid TMRM fluorescence and transmission image of PBS-treated cells receiving red light. (d) Mean fluorescence intensities of the area received light. The bar graph represents the mean fluorescence intensity.  3.4.Fluorescence Lifetime Changes of HerGa During Internalization into MDA-MB-435 CellsOur previous studies have shown that internalization of HerGa is required for cancer cell damage.1 Specifically, we have shown that HerPBK10-mediated delivery yields accumulation in endocytic vesicles by after uptake, followed by sufficient cytosolic distribution of HerPBK10 by .1 Hence, we examined here whether HerGa fluorescence lifetime could be used as a live-cell indicator to signal the optimal timing at which photoexcitation should be applied. Figure 6(a) shows the fluorescence lifetime changes of HerGa during uptake. Although the average fluorescence lifetime of HerGa in the cells is approximately 861 ps at 3 min, this average lifetime of HerGa dramatically decreases to approximately 541 ps at 20 min and to approximately 533 ps at 40 min, respectively. These time points correlate with cell membrane binding and cytosolic uptake, respectively, as indicated by the fluorescence intensity images showing HerGa cellular localization during internalization [Fig. 6(a) inset, lower row].1 Consistent with previous observations,1,2 HerGa remains excluded from the nucleus after cytosolic entry. Figure 6(b) shows the gated images (left) and fluorescence decay curve fittings at the regions selected by the circles (right), which are obtained at 3 and 20 min respectively after HerGa addition to the cells. Here the fluorescence decay curves clearly show that fluorescence of HerGa obtained at 20 min decays faster than the fluorescence of HerGa at 3 min. In addition, the decay curve fitting significance was evaluated by comparing the single and double-exponential fits [Fig. 6(b), right]. While the single-exponential fitting provides a HerGa fluorescence lifetime of at 3 min around the selected region, the double-exponential fitting provides fluorescence lifetimes of and respectively. In contrast, while the single-exponential fitting provides a HerGa fluorescence lifetime of at 20 min around the selected regions, the double-exponential fitting provides a fluorescence lifetime of 831 ps and respectively. Altogether, these results show that HerGa uptake is fully achieved within after HerGa addition to cells, thus allowing us to identify the optimal timing for inducing photoexcitation-based damage. Fig. 6Fluorescence lifetime changes of HerGa during uptake in MDA-MB-435 cells: (a) fluorescence lifetime (inset, upper panels) and intensity (inset, lower panels) images of treated cells acquired at the indicated time points (3, 10, 20, 40, 60, and 70 min) of HerGa internalization. The plot shows the changes of average fluorescence lifetime of HerGa at the indicated time points. (b) Gated images (left) and single- and double-exponential fittings (right) obtained at 3 and 20 min after HerGa addition.  3.5.Monitoring of Light-Augmented Cytotoxicity of HerGa During UptakeFluorescence lifetime imaging of HerGa during uptake allows us to identify the optimal timing for inducing photoexcitation-based damage. We furthermore investigated the light-induced cytotoxicity changes of HerGa during uptake by monitoring mitochondrial membrane potential changes of the cells after light irradiation (424 nm, ). Figure 7(a) shows the TMRM fluorescence images obtained before and after light irradiation of the cells at the indicated time points (no treatment, 5, 30, 60 min) after HerGa addition. In the cells without HerGa treatment, the light irradiation does not induce any significant disruption of mitochondrial membrane potential of the cells [Fig. 7(a), first column]. In contrast, the cells receiving the light (424 nm, ) at 5 min after HerGa addition exhibit significant disruptions of mitochondrial membrane potential [Fig. 7(a), second column], and furthermore in the cells receiving the light at 30 and 60 min after the HerGa addition, more significant disruptions of mitochondrial membrane potential [Fig. 7(a), third and fourth columns] were observed than in the cells receiving light at 5 min. As shown in the quantitative analysis [Fig. 7(b)], which exhibits the average mitochondrial membrane potentials, while the average mitochondrial membrane potential of the cells decreases to approximately 50% by the light irradiation at 5 min after HerGa addition, the average mitochondrial membrane potentials decrease down to approximately 30% and 15% by the light irradiation at 30 and 60 min after the HerGa addition, respectively [Fig. 7(b)]. Altogether, these results show that the photo-augmented cytotoxicity of HerGa can be realized at about 5 min after HerGa addition to the cells, but the light-induced cytotoxicity of HerGa becomes enhanced as the HerGa treatment time increases. Fig. 7Mitochondrial disruption of HerGa-treated cells by light irradiation at the indicated time points after HerGa addition: (a) TMRM images obtained before and after light irradiation at 5, 30, and 60 min after HerGa addition and without HerGa treatment and overlaid TMRM and DIC image after light irradiation. (b) Quantitative analysis for mitochondrial membrane potential disruption. The bar graph represents the average mitochondrial membrane potential. The error bars indicate standard deviations. 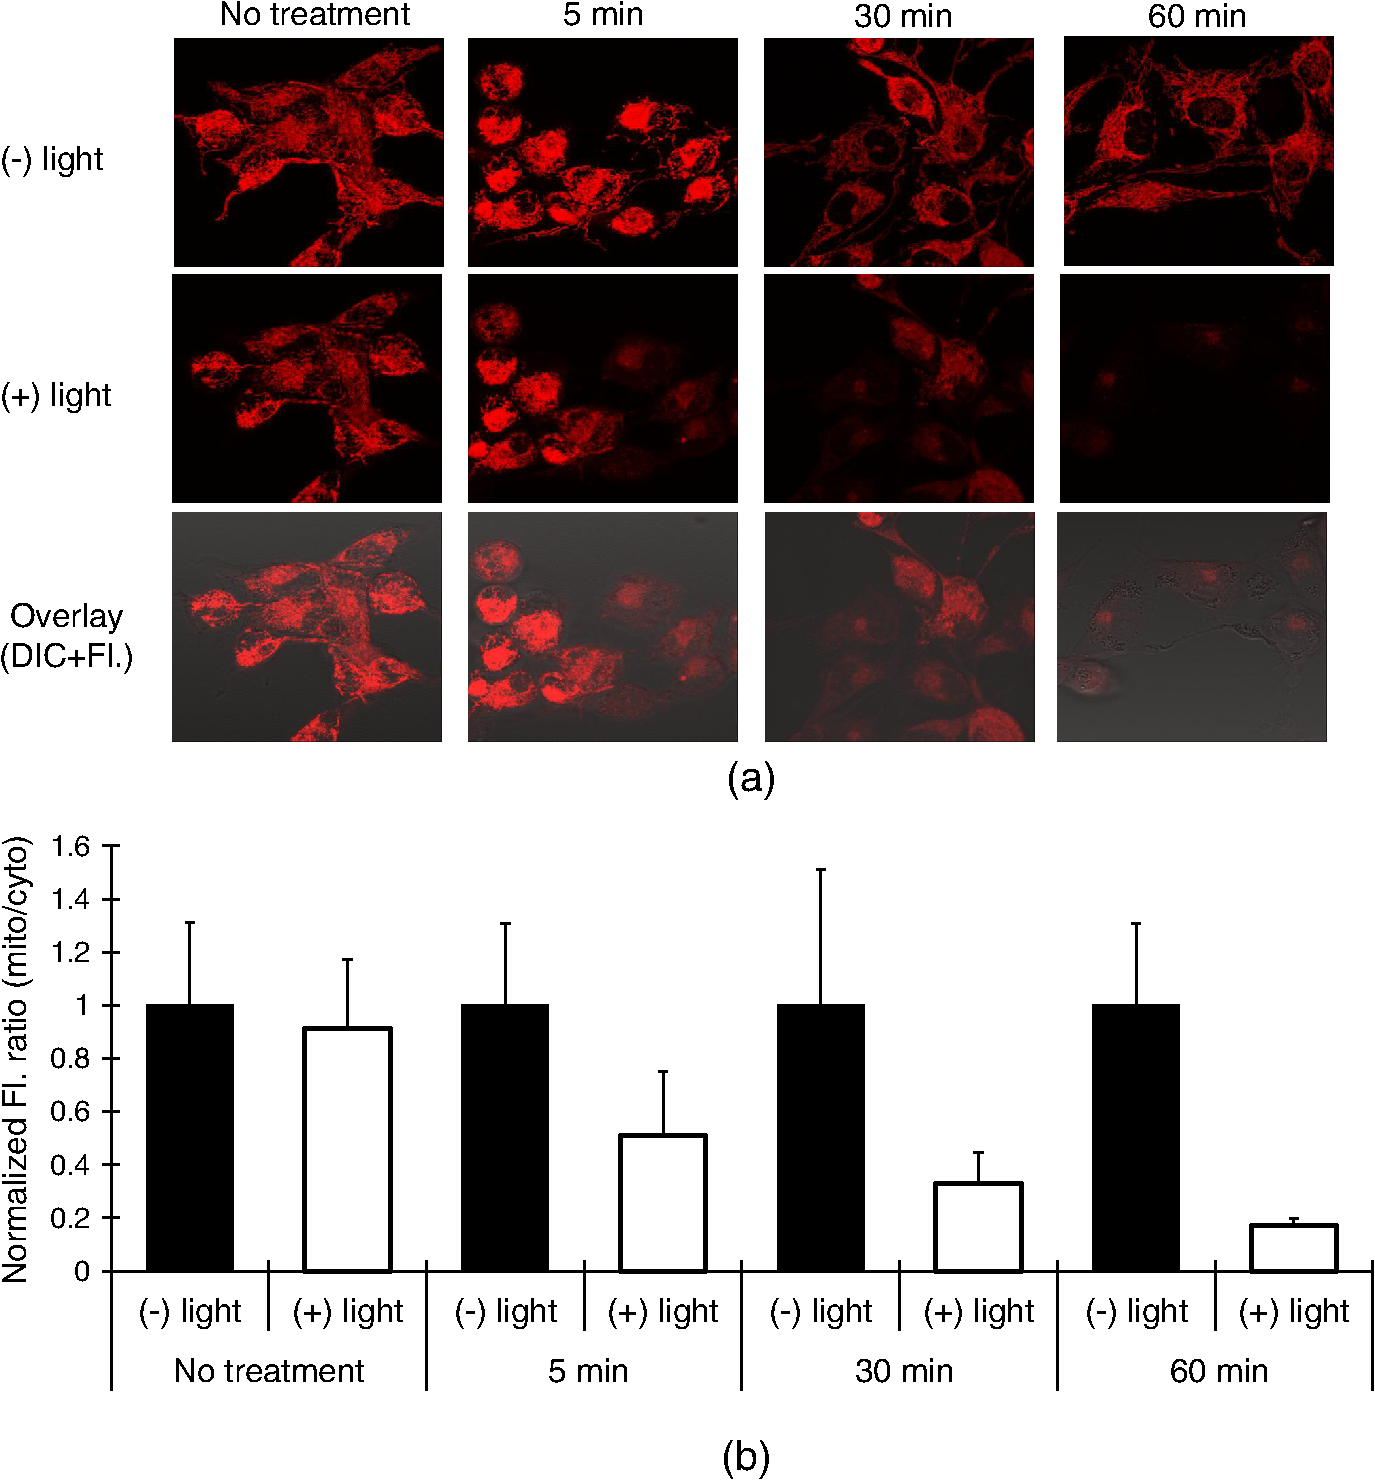 4.Discussion and ConclusionsThe present studies indicate that whereas HerGa at 1 μM concentration disrupts mitochondria without photoexcitation, additional light application (at specific wavelengths) augments mitochondrial membrane potential disruption even further, thus enhancing HerGa’s inherent cytotoxicity. Although light at 424 nm (which correlates with the peak absorption wavelength of HerGa) is most effective at augmenting this cytotoxicity, light at 535 nm also significantly lowered the TMRM fluorescence that reports on the mitochondrial membrane potential. However, the wavelength itself also overlaps with the absorption wavelength of TMRM [Fig. 1], and the apparent disruption observed at 535 nm is likely to be caused mainly by reactive oxygen species generated by TMRM although it is somewhat affected by HerGa photo-reactivity.21 In addition, light at 424 nm can induce moderate mitochondrial damage in S2Ga-treated cells, but considerably less compared to HerGa-treated cells [Fig. 3]. Whereas S2Ga alone can be endocytosed with serum albumin, it cannot effectively penetrate the plasma membrane and enter the cytosol without a membrane-penetrating agent. As cytosolic entry appears to be a requirement for S2Ga toxicity, S2Ga alone is fairly nontoxic to cancer cells unless used at excessive pharmacological concentrations ().1,2 In addition, light at 450 to 490 nm, which still excites HerGa but is not perfectly matched with the absorption peaks of HerGa, can also disrupt mitochondrial membrane potential of HerGa-treated cells with higher energy density () of light irradiation [Fig. 4(a)] than at 424 nm [. 3]. These results indicate that all light within wavelengths that can be absorbed by HerGa augments mitochondrial membrane potential disruption of HerGa-treated cells, with different light doses. Our previous study showed that HerGa molecules are diffusely localized in the cytoplasm. In this study, both HerGa fluorescence [. 4(e), left] and spectral classification imaging [Fig. 4(e), right] show that HerGa is broadly distributed in the cytoplasm before and after light irradiation. Whereas fluorescence imaging shows that HerGa overlaps with mitochondria (marked by TMRM fluorescence) [Fig. 4(a), left], the localization of HerGa is not exclusive to mitochondria and does not exhibit the punctuate fluorescence that would be suggestive of mitochondrial accumulation. Therefore, although it is unlikely that HerGa specifically enters the mitochondrion, it is probable that HerGa is in near enough proximity to elicit the results shown in this study. Further studies will help us elucidate the direct interactions facilitating HerGa-mediated reactive oxygen species formation. In Fig. 4(e), the region selected for should contain TMRM since TMRM accumulation in mitochondria and cytoplasm is governed by the Nernst equation; TMRM diffuses into the cytoplasm from mitochondria after mitochondrial disruption and subsequently diffuses out of cells. Meanwhile, HerGa, which is not internalized into the cells, still remains in the region. Therefore, the spectral signature labeled with [Fig. 4(e), middle] exhibits two peaks around 570 and 620 nm. While the first peak is likely to result from TMRM, the second peak is likely to result from HerGa. However, there are some mismatches in between the chosen spectral signature and the pure spectral signature of TMRM, which may result from a low fluorescence signal level. Therefore, it seems reasonable to have this labeled . For more versatile (and translational) in vivo application of the light-augmented toxicity of HerGa, the usage of light at longer wavelengths than the deep blue is required. Figure 5 shows that red light (590 to 630 nm) also enhances HerGa-mediated mitochondrial damage [Fig. 5(b)], suggesting that photoexcitation of HerGa may be implemented in vivo. Whereas the optimal wavelength for breast cancer phototreatment is reported to be 730 nm,22 the wavelength used here still lies partially within the red/NIR window (626 to 1316 nm) for breast tissue. Additionally, HerGa can be excited by fs pulsed light at 780 nm through the two-photon absorption process as shown in Fig. 4(b).23 This result indicates that the two-photon excitation may also be applicable to the photoexcitation of HerGa in vivo. Thus, it is possible that photoexcitation can enhance the inherent toxicity of HerGa and, when combined with tumor targeting in vivo,1 may present an effective alternative breast cancer treatment, especially for resistant disease states such as metastasis.24 However, although the red light () can also effectively yield mitochondrial disruption of HerGa-treated cells, the 640 nm (red) light wavelength as shown in Fig. 3, which is not perfectly matched with the second peak absorption wavelength (), does not induce a sharp decrease of Mito/Cyto ratio compared to the 425 nm light wavelength. These results indicate that the wavelength selection is a key factor to induce more effective mitochondrial damage in HerGa-treated cells by light irradiation. Interestingly, in Fig. 5(a), the area showing mitochondrial membrane potential disruption is not somewhat matched with the irradiation area. The mismatch is likely due to the light scattered from the focal spot. As shown in Fig. 3, the light-induced cytotoxicity of HerGa is dependent on the absorbance of HerGa. The absorbance spectra of HerGa have peaks at approximately 424 and 620 nm while the absorbance at 424 nm is over twice that at 620 nm. Thus, the deep blue light (414 to 434 nm) is more effective than the red light (590 to 630 nm) at the same energy density for augmenting the cytotoxicity of HerGa. Thus, the scattered deep blue light seemed to be capable of disrupting mitochondrial membrane potentials of cells adjacent to the area mainly receiving the light but not the red light at the light dose. Photoactivation of TMRM itself induces singlet oxygen21 and thus prolonged photoactivation of TMRM-loaded cells resulted in stronger NAD(P)H oxidation and the rapid onset of mitochondrial permeability transition. Thus, in the measurement of mitochondrial membrane potential using TMRM, careful determination of light dose for excitation of TMRM is needed. In this study, photoactivation of TMRM at the light dose utilized for imaging did not induce any significant mitochondrial membrane potential disruption (fluorescence intensity changes of TMRM after acquisition of 187 images: 630 to 612). In addition, the TMRM images, shown in Figs. 4 and 5, indicate that the light application augments mitochondrial membrane potential disruption although they were obtained through two different procedures: 1. ; 2. . Thus, these results suggest that the presence of TMRM while HerGa irradiation occurs does not have any significant effects on the light-augmented cytotoxicity of HerGa to cells. Therapeutic efficacy of HerGa requires membrane penetration of the therapeutic cargo. The membrane-penetrating segment of HerPBK10, the adenovirus-derived penton base, plays a critical role for the delivery of genes into cells as shown in our previous studies,14 and our more recent in vitro studies show that HerPBK10 enables passage of sulfonated corroles across the plasma membrane.2 Our present studies indicate that photoexcitation-enhanced mitochondrial disruption can occur at approximately five minutes after HerGa treatment as shown in Fig. 7. Moreover, the light irradiation at the longer time points after HerGa addition induces augmented mitochondrial membrane potential disruption of the cells. Concurrent fluorescence lifetime and intensity imaging indicate that internalization of HerGa is realized within approximately 40 min, during which the fluorescence lifetime of HerGa decreases, consistent with our previous observations.22 Altogether, these results indicate that the light irradiation at the longer time points after HerGa treatment provides more enhanced light-induced cytotoxicity of HerGa. Since our previous studies indicate that HerPBK10-mediated cell entry occurs by receptor-mediated endocytosis and endosomal escape,2,11 the fluorescence lifetime changes of HerGa during uptake may reflect intracellular microenvironmental changes encountered during its transit. As the microenviroment of the cytosol of tumor cells is less acidic than outside cells, this may be indicative of pH changes although this issue remains to be elucidated. In the fluorescence lifetime imaging of HerGa (Fig. 6), the fluorescence lifetimes obtained by using a single-exponential fitting method are shorter than the long-lived components of the double-exponential decay, possibly due to the constant short-lived component (260 ps) resolved by the double-exponential fitting method. Here, the short-lived component of the double-exponential decay may result from autofluorescence. In general, the double-exponential fitting method would provide a better fit than the single-exponential fitting method.25 However, it is important to note that the single exponential fitting still allows us to monitor the internalization of HerGa since it offers monitoring of the relative fluorescence lifetime changes of HerGa during the uptake with the similar trend to those obtained by the double-exponential fitting method. In conclusion, although we have previously reported that targeted corroles can eliminate tumor growth without photo-activation,1 we now report that photoexcitation augments corrole cytotoxicity by enhancing disruption of the mitochondrial membrane potential. These studies were enabled through multimode optical imaging, which allowed simultaneous examination of mitochondrial membrane potentials, cell morphology changes, discrimination between molecules with similar emissions, and HerGa internalization dynamics, yielding mechanistic and practical conclusions. The combination of the inherent targeted cytotoxicity of HerGa with its newly discovered photo-reactivity may facilitate an even greater potency and specificity for tumor cell destruction, thus yielding a therapeutic with optimized efficacy and safety.26 AcknowledgmentsWe thank Kevin Burton (Cedars-Sinai Medical Center) for providing valuable comments. This work was supported by grants from the U.S. Navy Bureau of Medicine and Surgery, the NIH (R21 CA116014, R01 CA140995, and R01 CA129822), the DoD (BC050662), the Susan G. Komen Breast Cancer foundation (BCTR0201194), and the Donna and Jesse Garber Award. Work at Caltech was supported by NIH DK019038 and the Arnold and Mabel Beckman Foundation. Work at the Technion was supported by The Herbert Irving Cancer and Atherosclerosis Research Fund and The United States-Israel Binational Science Foundation. ReferencesH. Agadjanianet al.,
“Tumor detection and elimination by a targeted gallium corrole,”
Proc. Natl. Acad. Sci. U. S. A., 106
(15), 6105
–6110
(2009). http://dx.doi.org/10.1073/pnas.0901531106 PNASA6 0027-8424 Google Scholar
H. Agadjanianet al.,
“Specific delivery of corroles to cells via noncovalent conjugates with viral proteins,”
Pharm. Res., 23
(2), 367
–377
(2006). http://dx.doi.org/10.1007/s11095-005-9225-1 PHREEB 0724-8741 Google Scholar
P. Limet al.,
“Differential cytostatic and cytotoxic action of metallocorroles against human cancer cells: potential platforms for anticancer drug development,”
Chem. Res. Toxicol.,
(in press). http://dx.doi.org/10.1021/tx200452w Google Scholar
L. K. Medina-Kauweet al.,
“Nonviral gene delivery to human breast cancer cells by targeted Ad5 penton proteins,”
Gene Ther., 8
(23), 1753
–1761
(2001). http://dx.doi.org/10.1038/sj.gt.3301583 GETHEC 0969-7128 Google Scholar
H. Agadjanianet al., Corrole Conjugates: A Unique Approach to Tumor Targeting, 2328 The American Association for Cancer Research, San Diego, CA
(2008). Google Scholar
J. Y. Hwanget al.,
“A mechanistic study of tumor-targeted corrole toxicity,”
Mol. Pharmacol., 8
(6), 2233
–2243
(2011). http://dx.doi.org/10.1021/mp200094w MOPMA3 0026-895X Google Scholar
D. L. Farkaset al.,
“Multimode light microscopy and the dynamics of molecules, cells, and tissues,”
Ann. Rev. Physiol., 55 785
–817
(1993). http://dx.doi.org/10.1146/annurev.ph.55.030193.004033 ARPHAD 0066-4278 Google Scholar
R. C. Scaduto Jr.et al.,
“Measurement of mitochondrial membrane potential using fluorescent rhodamine derivatives,”
Biophys. J., 76
(1), 469
–477
(1999). http://dx.doi.org/10.1016/S0006-3495(99)77214-0 BIOJAU 0006-3495 Google Scholar
D. L. Farkaset al.,
“Simultaneous imaging of cell and mitochondrial membrane potentials,”
Biophys. J., 56
(6), 1053
–1069
(1989). http://dx.doi.org/10.1016/S0006-3495(89)82754-7 BIOJAU 0006-3495 Google Scholar
H. Kawaiet al.,
“Simultaneous imaging of initiator/effector caspase activity and mitochondrial membrane potential during cell death in living HeLa cells,”
Biochim. Biophys. Acta, 1693
(2), 101
–110
(2004). http://dx.doi.org/10.1016/j.bbamcr.2004.05.009 BBACAQ 0006-3002 Google Scholar
J. Y. Hwanget al.,
“Multimodal wide-field two-photon excitation imaging: characterization of the technique for in vivo applications,”
Biomed. Opt. Express, 2
(2), 356
–364
(2011). http://dx.doi.org/10.1364/BOE.2.000356 BOEICL 2156-7085 Google Scholar
T. J. Doughertyet al.,
“Photodynamic therapy,”
J. Natl. Cancer Inst., 90 889
–905
(1998). http://dx.doi.org/10.1093/jnci/90.12.889 JNCIEQ 0027-8874 Google Scholar
L. D. ViaS. M. Magno,
“Photochemotherapy in the treatment of cancer,”
Curr. Med. Chem., 8 1405
–1418
(2001). CMCHE7 0929-8673 Google Scholar
L. K. Medina-Kauweet al,
“Non-viral gene delivery to human breast cancer cells by targeted Ad5 penton proteins,”
Gene Ther., 8 1753
–1761
(2001). http://dx.doi.org/10.1038/sj.gt.3301583 GETHEC 0969-7128 Google Scholar
M. Zochowskiet al.,
“Imaging membrane potential with voltage-sensitive dyes,”
Biol. Bull., 198
(1), 1
–21
(2000). BIBUBX 0006-3185 Google Scholar
A. Chunget al.,
“In vivo cytometry: a spectrum of possibilities,”
Cytometry A, 69
(3), 142
–146
(2006). http://dx.doi.org/10.1002/cyto.a.20220 BRPTDT 0144-8463 Google Scholar
G. Solainiet al.,
“Evaluating mitochondrial membrane potential in cells,”
Biosci. Rep., 27
(1–3), 11
–21
(2007). http://dx.doi.org/10.1007/s10540-007-9033-4 CYTODQ 0196-4763 Google Scholar
C. Finket al.,
“Intracellular fluorescent probe concentrations by confocal microscopy,”
Biophys. J., 75
(4), 1648
–1658
(1998). http://dx.doi.org/10.1016/S0006-3495(98)77607 BIOJAU 0006-3495 Google Scholar
J. Fuchset al.,
“Spectral-spatial electron paramagnetic resonance imaging (EPRI) in skin biopsies at 9.5 GHz,”
Meth. Mol. Biol., 196 221
–226
(2002). http://dx.doi.org/10.1385/1-59259-274-0:221 MMBIED 1064-3745 Google Scholar
J. Bendixet al.,
“Structural, electrochemical, and photophysical properties of gallium(III) 5,10,15-tris(pentafluorophenyl)corrole,”
Angew. Chem. Int. Ed., 39
(22), 4048
–4051
(2000). http://dx.doi.org/10.1002/1521-3773(20001117) ACIEAY 0570-0833 Google Scholar
F. Petratet al.,
“NAD(P)H, a primary target of 1O2 in mitochondria of intact cells,”
J. Biol. Chem., 278
(5), 3298
–3307
(2003). http://dx.doi.org/10.1074/jbc.M204230200 JBCHA3 0021-9258 Google Scholar
S. Niokaet al.,
“Simulation study of breast tissue hemodynamics during pressure perturbation,”
Adv. Exp. Med. Biol., 566 17
–22
(2005). http://dx.doi.org/10.1007/0-387-26206-7_3 AEMBAP 0065-2598 Google Scholar
A. Rebaneet al.,
“Two-photon absorption properties of meso-substituted A3-corroles,”
Chem. Phys. Lett., 462
(4), 246
–250
(2008). http://dx.doi.org/10.1016/j.cplett.2008.07.063 Google Scholar
M. Lapeset al.,
“Photodynamic therapy of cutaneous metastases of breast cancer after local application of meso-tetra-(para-sulphophenyl)-porphin (TPPS4),”
J. Photochem. Photobiol. B, 36
(2), 205
–207
(1996). JPPBEG 1011-1344 Google Scholar
K. C. Leeet al.,
“Application of the stretched exponential function to fluorescence lifetime imaging,”
Biophys. J., 81
(3), 1265
–1274
(2001). http://dx.doi.org/10.1016/S0006-3495(01)75784-0 BIOJAU 0006-3495 Google Scholar
I. Luobeznovaet al.,
“Synthesis and full characterization of molybdenum and antimony corroles and utilization of the latter complexes as very efficient catalysts for highly selective aerobic oxygenation reactions,”
Inorg Chem., 45
(1), 386
–394
(2006). http://dx.doi.org/10.1021/ic051483g Google Scholar
|