|
|
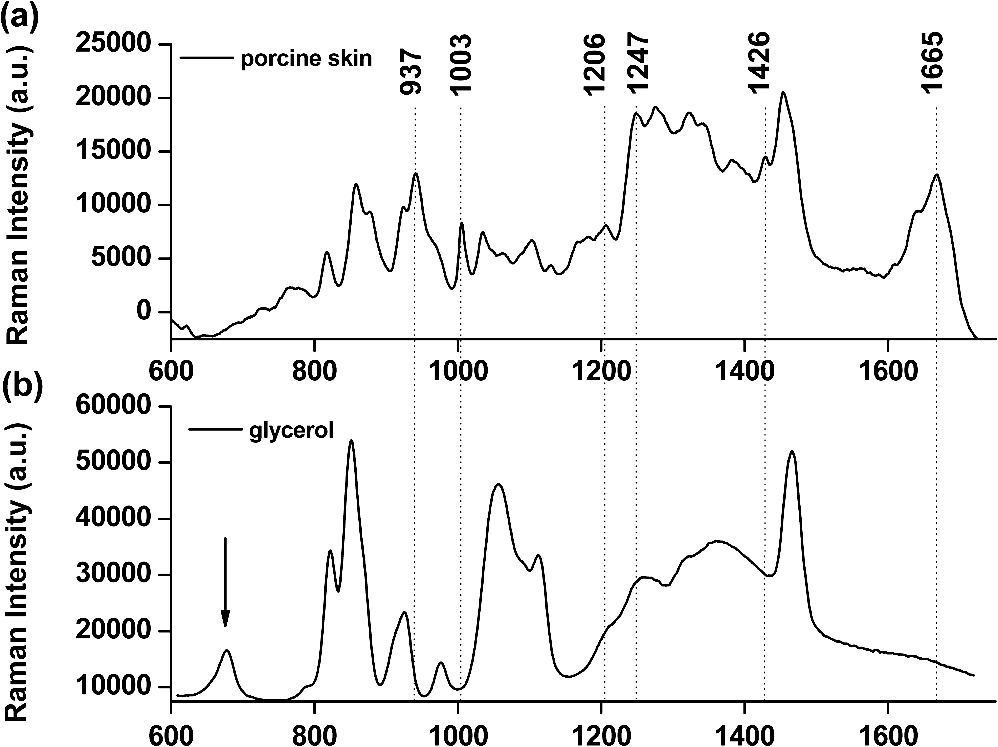
1.IntroductionRaman spectroscopy, which will be denoted as RS, is a potential non-destructive measurement technique for clinical diagnosis of multiple diseases with many advantages, including excellent sensitivity to small structural and molecular changes associated with tissue pathology, high spatial resolution, resistance to autofluorescence and photobleaching, relative insensitivity to water, simple to perform, and fully automated.1,2 Based on inelastic light scattering, RS measures molecular vibrations and provides fingerprint signatures for various biomolecules in tissues such as collagen, blood, proteins, lipids, and nucleic acids.3–6 In recent years, RS has been studied extensively for non-invasive medical diagnosis of a variety of diseases.7–24 As clinical disease symptoms are preceded by molecular changes, this technique could prove valuable for an early, in vivo diagnosis of a large class of skin diseases. Conventional RS is limited to the near-surface of diffusely scattering objects because of the high signal intensity in the region of laser excitation which that dominates the collected signal. However, the emergence of Spatially offset Raman spectroscopy, which will be referred to as SORS, permitted the non-invasive characterisation of diffusely scattering samples at depths not accessible by conventional RS.25,26 In imaging of turbid biological samples using optical techniques, optical clearing methods can compensate for the lack of light penetration due to strong attenuation.27 It is expected that the application of optical clearing agents, which can reduce random scattering to skin tissue, could decrease scattering of biological tissue, enhance the penetration depth of light in tissues, and then improve the measure performance for deeper acquisition, thus improving the capabilities of non-invasive optical diagnosis with RS.28,29 Although it has been rarely studied by RS, the effects of optical clearing of highly scattering biological tissue by use of optical clearing agents such as glycerol,30,31 glucose,32,33 and dimethyl sulfoxide,34,35 have been investigated by using a number of techniques.27,36–44 Examples of this include near-infrared spectrophotometers,43,45–47 optical coherence tomography imaging,36,39,41,46 and second harmonic generation imaging.44,48 The results demonstrated that the addition of optical clearing agents into scattering media increases the optical homogeneity of the sample and reduces its turbidity allowing for the increased light penetration. The explanations for this effect was proposed to be better refractive index matching and a dehydration action.49 Glycerol is one of the most commonly employed clearing agents for its nontoxic effect to human and high index of refraction, . For these reasons, we use glycerol as optical clearing agent in our work to improve the depth of RS measurement. The aim of this study was to investigate the effect of optical clearing on porcine skin with glycerol by Raman microspectroscopy at various time intervals of 0, 15, 30, 45, 60, and 75 min, respectively. Though it was impossible to recovery the full skin tissue spectra because of Raman spectra of skin tissue overlapped with the strong Raman bands of glycerol, certain skin Raman bands that were not overlapped with the glycerol Raman spectra could be quantified at deeper tissue layers with the help of glycerol based optical cleaning. As the results showed that the most effective optical clearing achieved at 60 min, further research was done to compare the Raman spectra collected from experimental analysis and the Raman spectra obtained from the skin slices at the same depth. It was found that the Raman signals resembled the native spectrum of the molecules in porcine skin with a negligible frequency shift. Moreover, we evaluated the extent of optical clearing in porcine skin by utilizing various concentrations of glycerol solution in order to choose a suitable concentration for RM measurement. The results showed that with the increase of concentration of glycerol, the optical clearing of skin was much improved. 2.Materials and Methods2.1.Reagents and SpecimensGlycerol, with 99.9% concentration, was purchased from the Tianjin Damao Chemical Reagent Factory and used in the Raman experiments without further purification. The concentration of the glycerol solutions used in this study was reduced to 40%, 60%, and 80% through mixing the agents with distilled water. Fresh porcine skin obtained from an accredited abattoir was cleaned with ultra-pure water and the hair was removed. The tissue samples were sealed for preventing natural dehydration and stored at 4 °C for no longer than 12 hours before use. The samples were allowed to equilibrate 30 min at room temperature prior to the experiments. Multiple cross sections of 20 µm thickness were cut with a microtome at for the experiments as a reference to different depth of skin. For RM analysis, each skin sample was cut into pieces by microtome before measurement. The underside of the skin was plunged in a PBS medium to maintain the hydration of the skin, and the epidermis was exposed to the air. Immediately after the first axial scanning from the skin surface to 400 μm was taken, approximately 0.03 ml of the glycerol solution was applied topically to the tissue surface and the tissue was allowed to absorb the chemical. A set of axial scanning from the skin surface to 400 μm was then taken at the same site at intervals of 15, 30, 45, 60, and 75 min after the topical application of glycerol. The glycerol solution on the sample was removed right before acquiring the spectrum and added again right after the measurement. In total, 75 spectra from normal sites at depths ranging from 0 to 400 µm below the skin surface were acquired, with 15 spectra being acquired for every 100ug increment. The cross sections of porcine skin were cut into 20 µm thick samples to obtain the Raman spectra from the skin slide at the depth of 100, 200, 300, 400 µm. The skin slices were deposited on Si substrates for all measurements. These slides were optimized for RM, they did not present any signal in the considered spectral range. 2.2.InstrumentationRaman spectral acquisitions were performed with a Raman microspectrometer that was purchased from Renishaw and manufactured by inVia Reflex, Gloucestershire, UK. To obtain profiles, samples were placed on the computer-controlled 3-axis motorized stage which allows vertical movements with a minimal step of 100 nm. The excitation source was a diode laser generating single mode laser light at 785 nm. Such a wavelength allows a good penetration of the light deeply into the skin, minimizes parasite fluorescence and does not cause any photochemical or thermal degradation. The power of the laser beam focalized on the sample was measured and maintained at 50 mW, which is non-destructive for biological samples. The microspectrometer, equipped with a Leica DM2500 microscope and a objective, was used to focus the laser beam and to collect all the Raman signals. The lateral and axial resolution of the instrument was about 1 μm and 2 μm, respectively. Light scattered by the tissue was collected through the same objective. The spectral range was from 600 to , the acquisition time of each spectrum was 2 times 10 s, Before every Raman obtained, the intensity of the Raman band of silicon, at ,was normalized and all the data were collected under the same conditions. 2.3.Data AnalysisThe final spectra presented in the following section were spectra of the integrins, with the background subtracted, on which a baseline correction routine was performed. The baseline correction routine used was a based routine, which was a built-in feature of the version 2.0 WiRE software that controlled the Raman spectrometer. The data from all samples were presented as and analyzed by an SPSS 10.0 software paired-test. The value indicated significant difference. 3.Results and Discussion3.1.Raman Spectra of Porcine Skin and GlycerolRaman spectra taken on the surface of porcine skin and glycerol solution were shown in Fig.1. CCD white light correction, dark current subtraction, and correction of spectrograph-induced curvature was applied, but no further processing was done. RS is an optical technique that probes the vibrational activity of chemical bonds, thus each molecule has a spectral signature characteristic of its modes of vibration. These spectral signatures can be used to identify unknown substances in a sample or to differentiate samples according to their chemical constituency. This part of our study consisted of establishing spectral signatures specific for the porcine skin and glycerol, which enabled us to determine the most pertinent spectral features to detect the optical clearing effect of the glycerol. Compared to glycerol, unique spectral features of porcine skin appeared at 937, 1003, 1206, 1247, 1426, and . Within these six peaks for porcine skin spectral makers, six bonds were responsible for the spectral peaks. These six bonds included the C-C stretch backbone at , phenylalanine at , hydroxyproline band at Amide III band at , C-C stretching vibrations at , and Amide Iband at .50–52 3.2.Raman Spectra of Porcine Skin at Different DepthFigure 2(a) showed a series of Raman spectra of porcine skin from 0 to 400 μm below, which can be identified definitely by the main peaks of the vibration modes at 937, 1003, 1206, 1247, 1426, and . The Raman signals were found to monotonically diminish with the increased depth of measurement due to the limited light penetration into porcine skin. The skin tissue is a highly scattering medium in the visible and near-infrared wavelengths due to variations in the indices of refraction of different components Scattering attenuated the excited light dose that reaches targeted region and the scatter light returned to the objective lens. That made the Raman spectrum get weaker as the probe penetrated deeper into the skin. It could be seen that the Raman peak could not be clearly observed at the depth of 300 to 400 μm, which may be attributed to the intensive fluorescence background. With 785 nm excitation, the most important source of fluorescence is melanin, which is located in the melanocytes. In porcine skin in humans and other mammals, the melanocytes lie just below the stratum corneum. A vertical section H&E stained histology image has been illustrated in Fig. 2(b) in order to demonstrate the thickness of each skin layer for the pig sample studied. Fig. 2(a) Raman spectra of porcine skin at different depthwhich were collected every 100 μm from the surface to 400 μm below the skin. The spectra have been offset vertically for visualization. The top spectrum was collected at the surface of the skin, the bottom one was collected 400 µm below the skin. The spectral signatures of porcine skin can be clearly seen at 937, 1003, 1206, 1247, 1426, and at 0 μm, but were monotonically diminished with the increased depth of measurement. (b) A vertical section H&E stained histology image of the porcine skin sample. 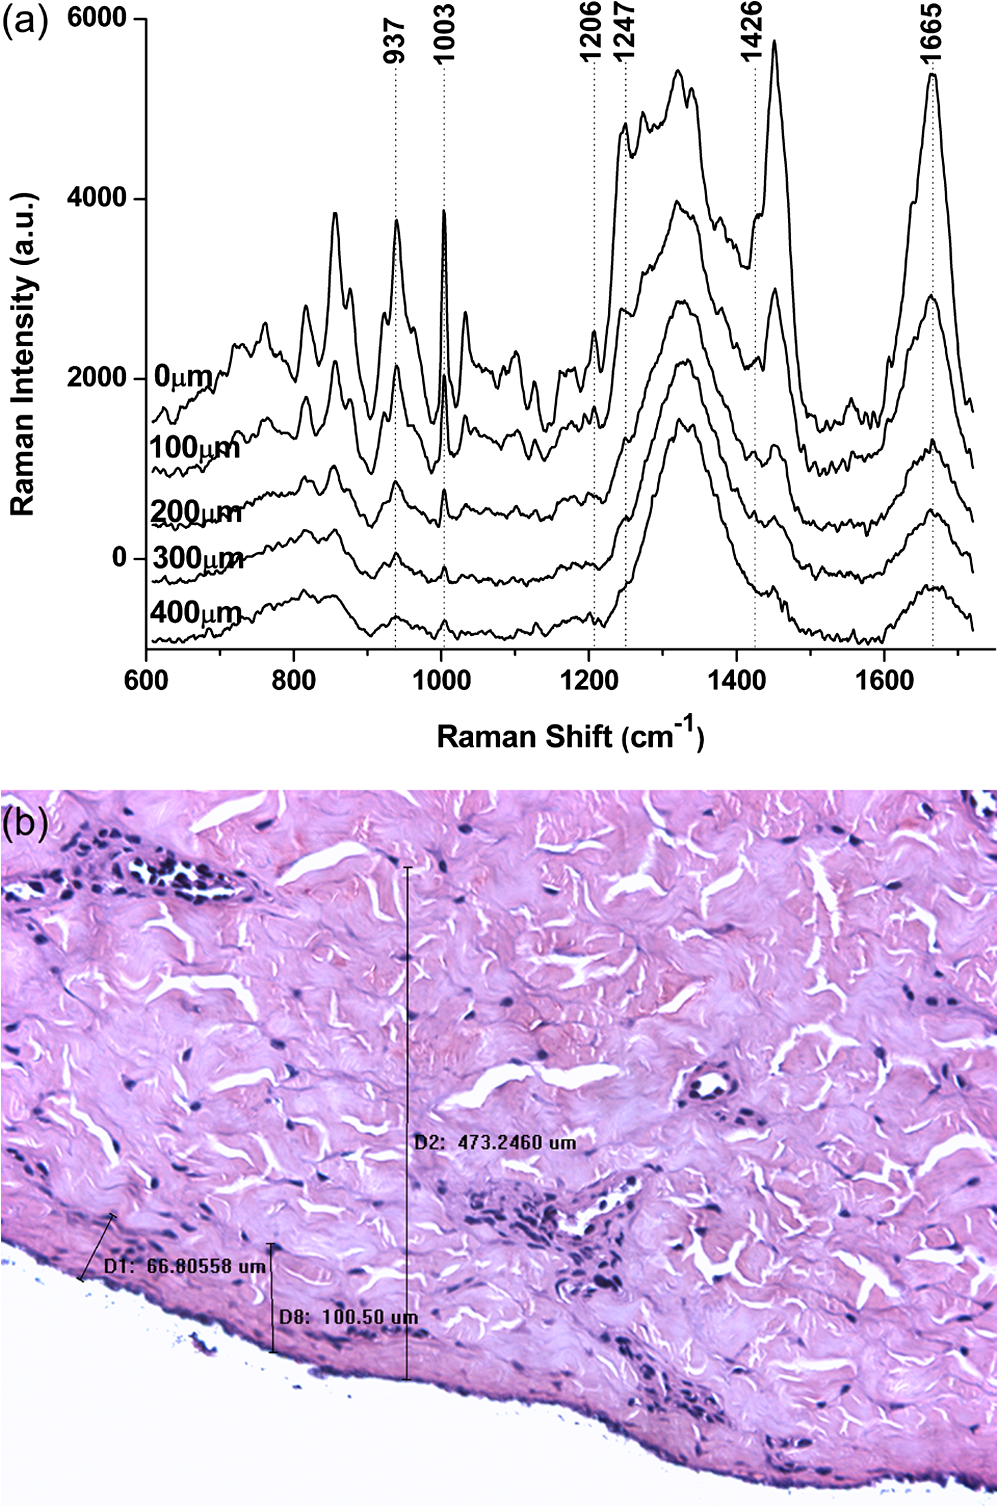 3.3.Raman Spectra of Porcine Skin at Different Depth with Application of GlycerolIn order to study the optical clearing process of glycerol solution into the porcine skin, a comparison of Raman spectra of porcine skin samples with application of 80% glycerol at various time intervals of 0, 15, 30, 45, 60, and 75 min were recorded in Fig. 3. Four representative images of the porcine skin, 100 μm, 200 μm, 300 μm and 400 μm below the surface, as illustrated in Figs. 3(a) through 3(d). In general, the intensities of the Raman signals decreased with the increase of the depth of porcine skin. At the depth of 400 μm, the signal was so weak that the peaks at 937, 1206, and were almost covered up by the fluorescence background. After application of glycerol solution, intensity of the bands at 1003, 1247 and were much higher than the intensity of the bands at about the same wave number in skin without using glycerol solution. In addition, the peaks at 937, 1206 and , which were disappeared at 400 μm beneath the skin, could even be clearly observed with the increase of time after being treated with glycerol. Fig. 3(a) Raman spectra of porcine skin at 100 μm, (b) 200 μm, (c) 300 μm, and (d) 400 μm after topically application of glycerol at different time intervals. (e) Raman spectra of porcine skin slide deposited on silicon substrates at different depth. 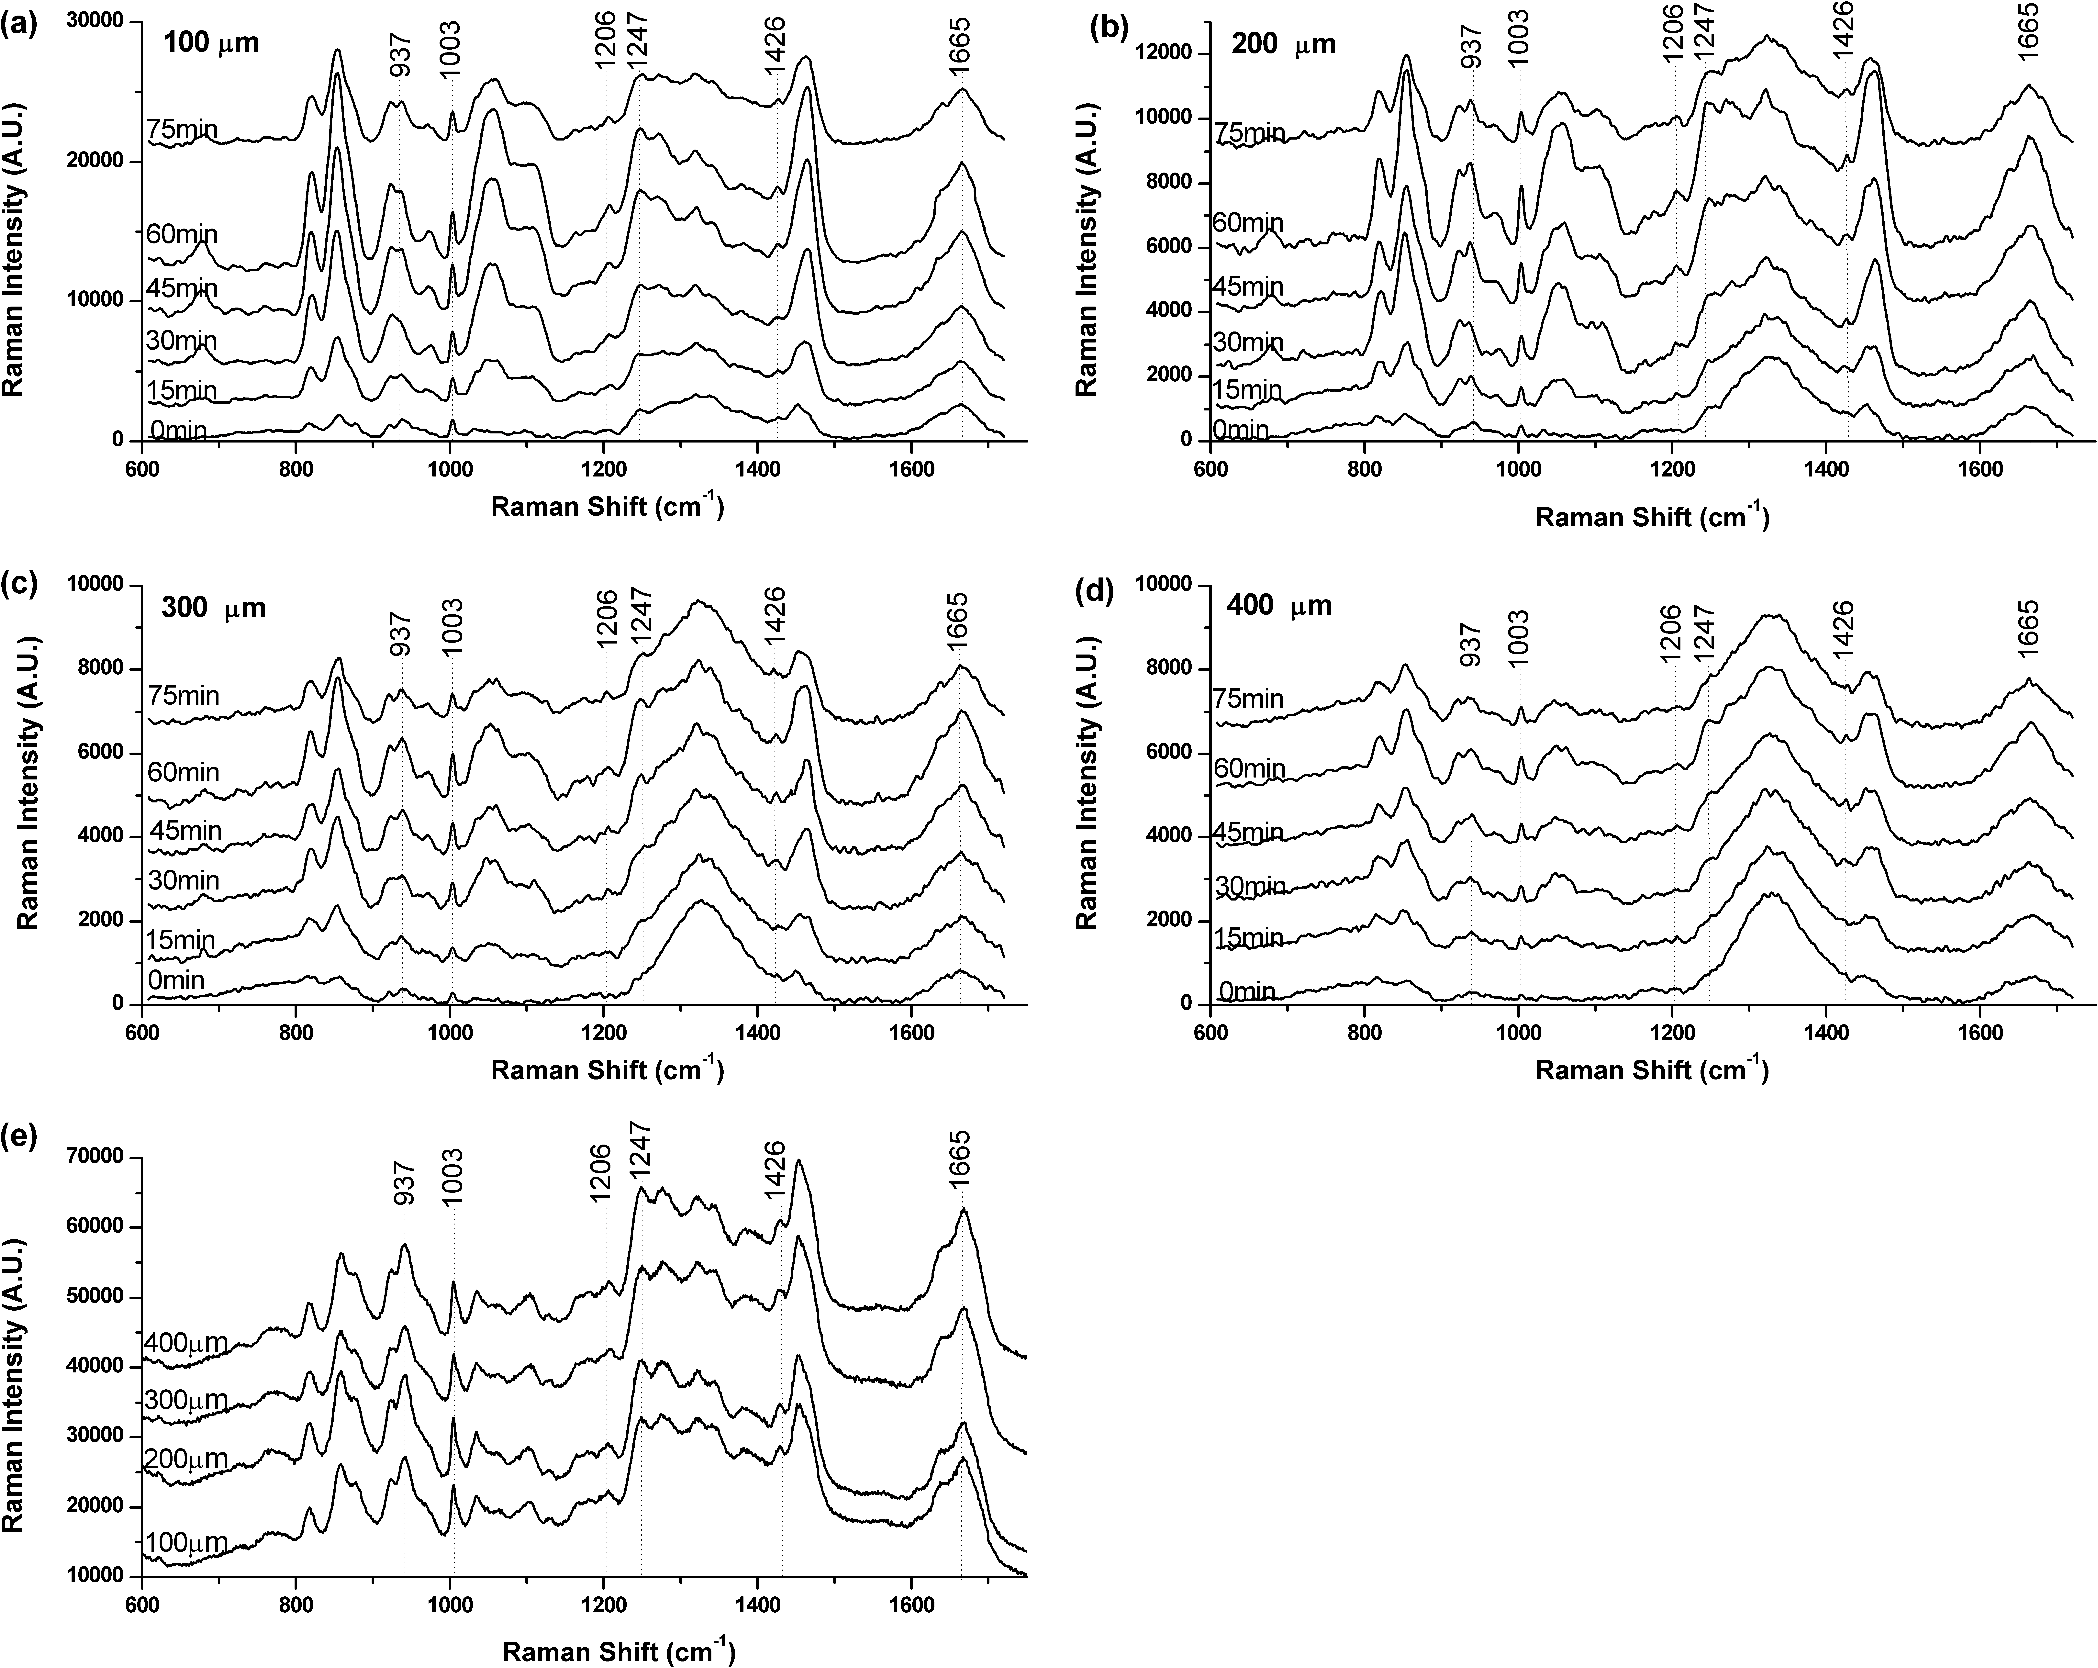 The Raman spectral markers for the glycerol was , which was marked by an arrow in Fig. 1b. From Fig. 3, we could see that the glycerol was diffused to 100 μm at the time of 15 min for the spectral marker of glycerol could be clearly observed at that time in the spectra of 100 μm, and further diffused to 200 μm and 300 μm as the time increased to 30 min. It could be seen from Fig. 3, that the effect of the glycerol was a function of time. Compared with the spectra at the time of 0, 15, 30, 45, and 75 min it was found that the peaks 1003, 1247, and were much stronger at the time of 60 min Also, there were some new peaks appearing such as those at 937, 1206 and . To compare the enhancement more quantitatively, we have calculated the peak intensities for the main Raman peaks of porcine skin at 100 μm, 200 μm, 300 μm, and 400 μm after application of glycerol for 0, 15, 30, 45, 60, and 75 min and these results are illustrated in Figs. 4(a) through 4(d). As shown in Fig. 4, all the peak intensity of porcine skin exhibited a monotonic increase with respect to time and reached maximum at 60 min. Then it began to decrease. Fig. 4(a) The Raman peak intensities of porcine skin at 100 μm, (b) 200 μm, (c) 300 μm, and (d) 400 μm corresponding to the Raman spectra in Fig. 3. As labeled on the left top corner of the figure, each symbol represents a characteristic peak of the porcine skin Raman spectrum. The data from all samples were presented as .  In the previous work on murine cortical bone tissue by transcutaneous Raman spectroscopy, it has been suggested that the use of glycerol increased the signal-to-noise ratio and reduces the systematic error incurred as a result of incompletely resolved surface and subsurface spectra.53 In this study, it has showed that the application of glycerol on porcine skin could improve the Raman to fluorescence ratio and signal contrast significantly. We attributed the Raman to florescence ratio improvement of optical clearing to reduced specimen fluorescence in the acquired spectra. Decreasing the scattering at, and just below the skin surface, decreased the amount of fluorescence that was generated and the amount reaching the collection fibers, thereby decreasing its contribution to the total collected signal. Some photobleaching might also be occurring during the first few minutes of laser illumination. The background decreased rapidly between the first and second spectrum acquisition, but slowly thereafter. The Raman signals contrast improvement was supposed to be caused by the reduction of light scattering of the skin. With the diffusion of the glycerol solution into the tissue, back scattering at the upper layers decreased by eliminating the refractive index mismatch at tissue and fluid interfaces and more photons could reach deeper tissue layers. As expected, the Raman signal of deeper tissue could be detected. 3.4.Raman Spectra of Porcine Skin with Application of Different Concentration of GlycerolOur study was focused on the performance of the optical clearing effect of glycerol at different concentrations. For this reason, we investigated the dynamics of enhancement in Raman signal at different depth of porcine skin after topical application of 40%, 60%, 80% glycerol solutions. Figure 5 showed a series of Raman spectra of porcine skin at different depth after application of 40% glycerol solution, 60% glycerol solution, and 80% glycerol solution. As show in Fig. 5, the intensity of the bands at 1003, 1247, and increased with a varying extent after different concentrations of glycerol application, with the 80% glycerol solution having the most improved spectrum. Fig. 5(a) Raman spectra of porcine skin at 100 μm, (b) 200 μm, (c) 300 μm, and (d) 400 μm after topically application of 40%, 60%, and 80% glycerol solutions for 60 min. 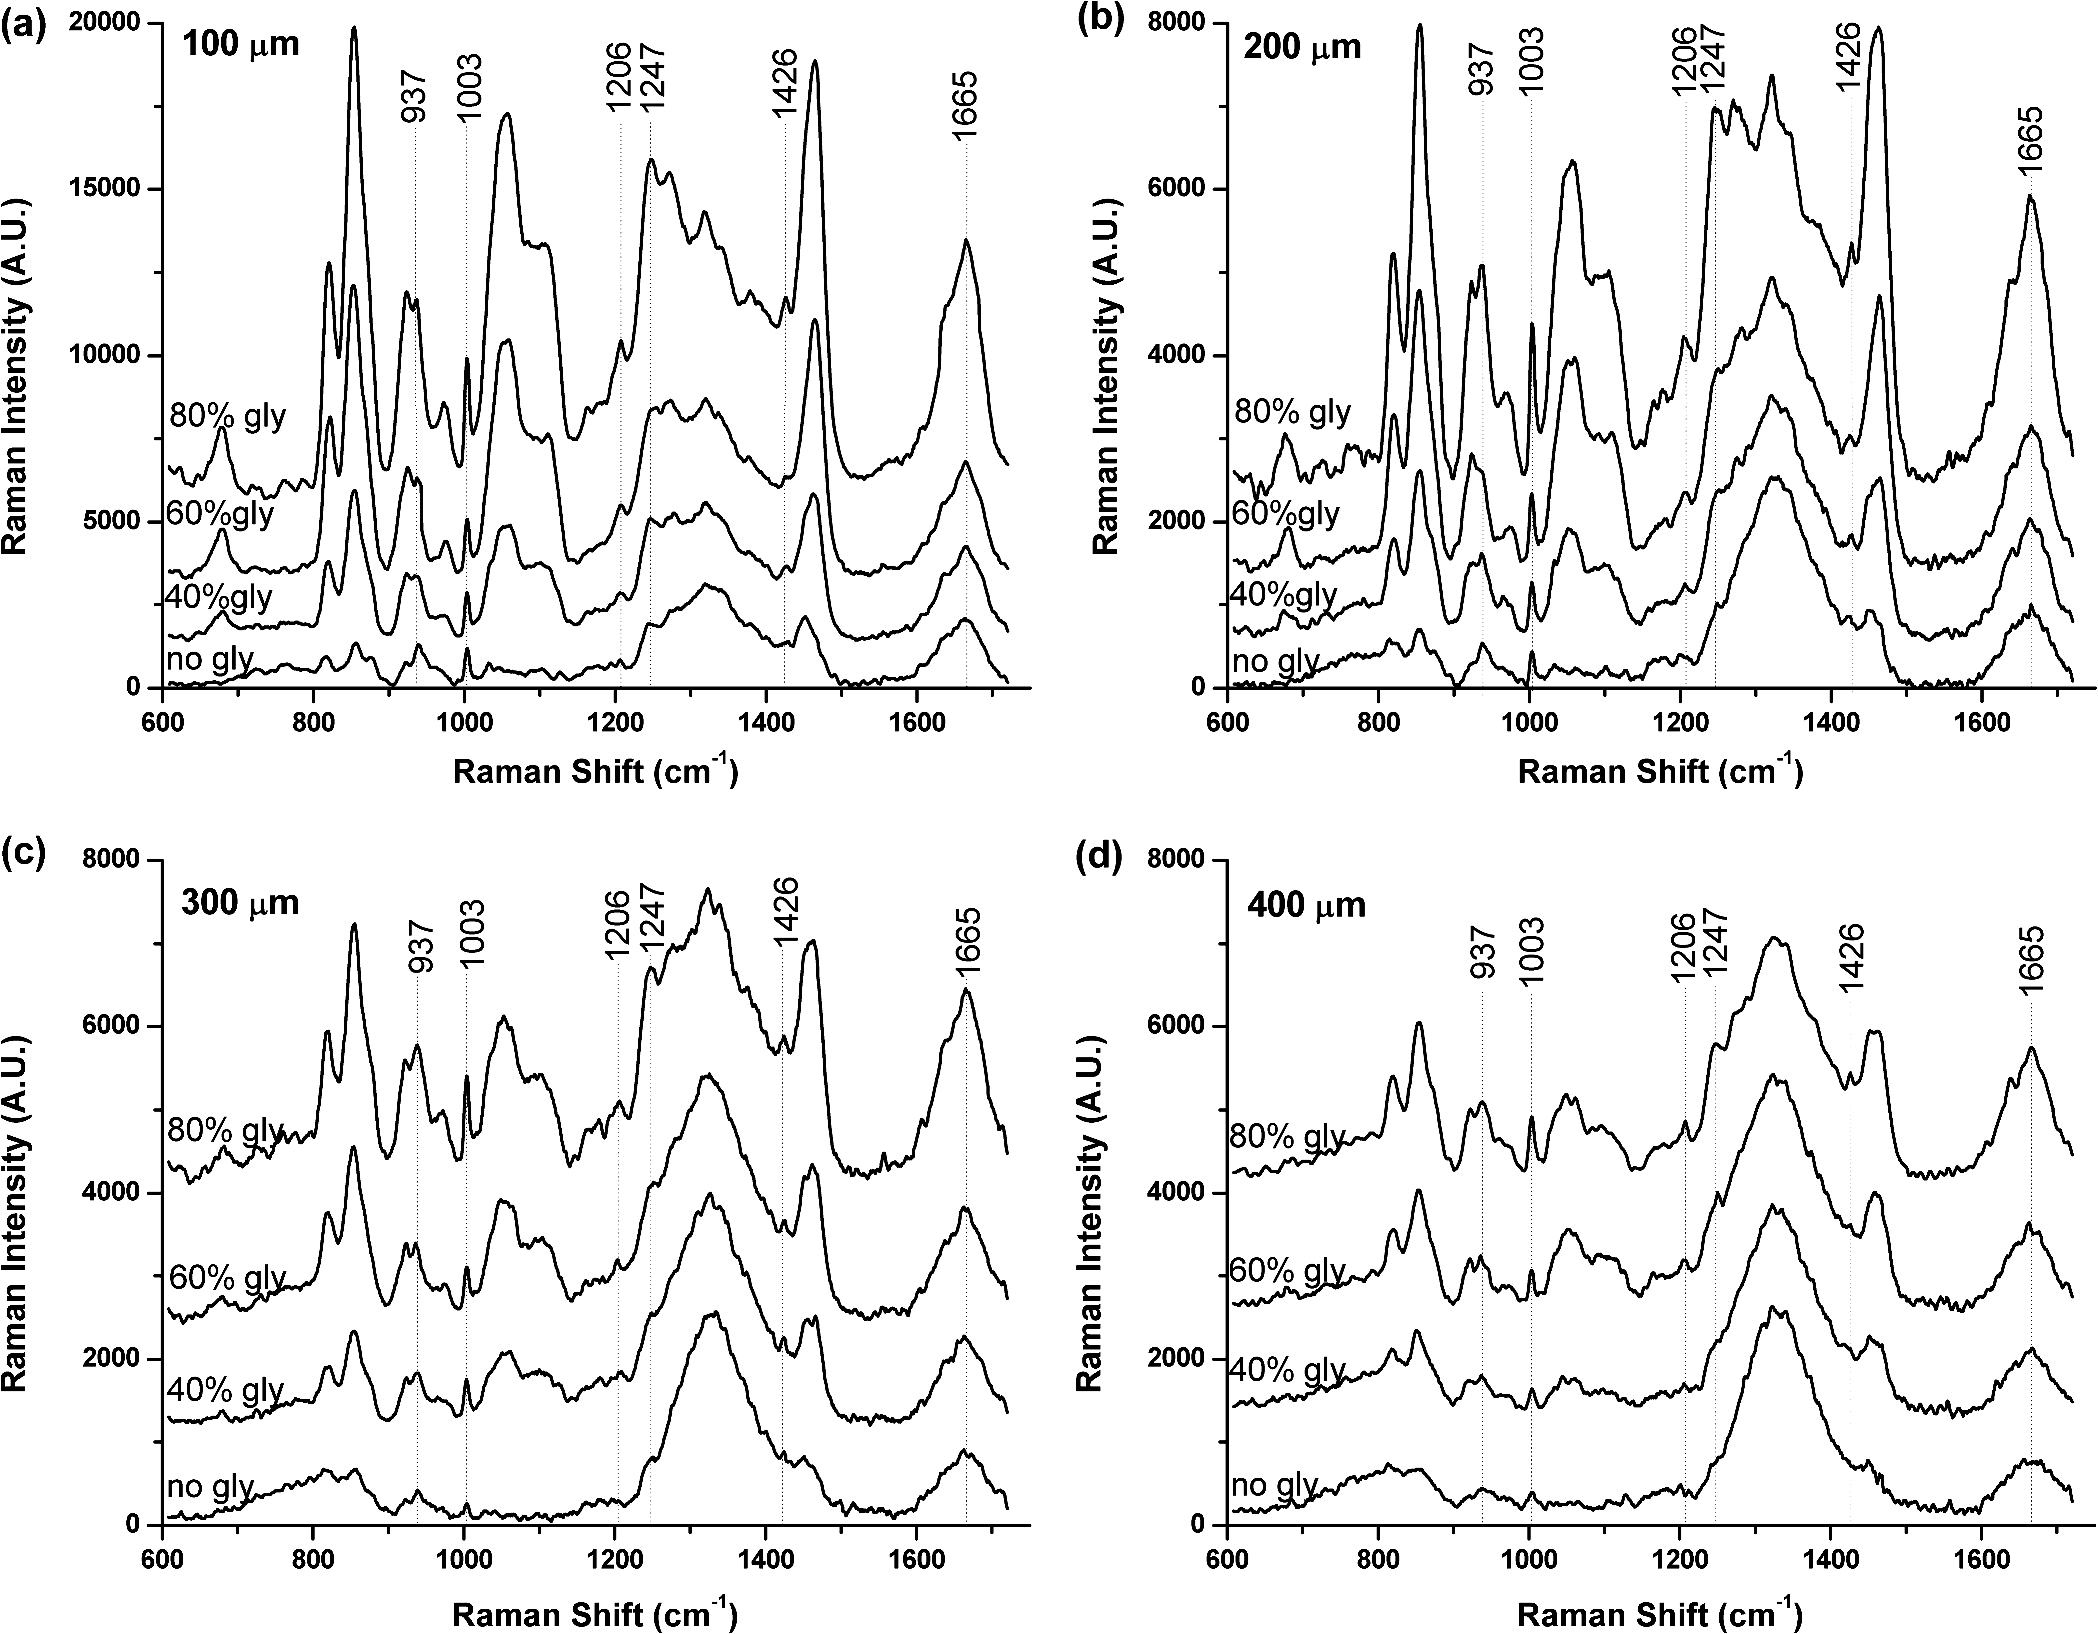 To compare the enhancement more quantitatively, we also calculated the peak intensity for the main Raman peaks of porcine skin at 100 μm [Fig. 6(a)], 200 μm [Fig. 6(b)], 300 μm [Fig. 6(c)], [Fig. 6(d)] 400 μm ( after application of different concentration of glycerol for 60 min, as illustrated in Figs. 6(a) through 6(d). As previously studied, the high-concentration solutions induced more transparency of skin than the surroundings. Therefore, the clearing capability of 80% glycerol was most improved over that of 40% glycerol and 60% glycerol alone with 40% glycerol having the lowest clearing effect. This means that with the increase of concentration of glycerol, the optical clearing of skin was more improved. The results obtained in our work were similar to these of Mao et al., who have demonstrated more optical skin clearing improvement than that with low-concentration glycerol injected into the dorsal dermas of SD rat from reflectance spectra.54 Fig. 6(a) Raman intensities of porcine skin at 100 μm, (b) 200 μm, (c) 300 μm, and (d) 400 μm corresponding to the Raman spectra in Fig. 5. As labeled on the left top corner of the figure, each symbol represents a characteristic peak of the porcine skin Raman spectrum. The data from all samples were presented as . 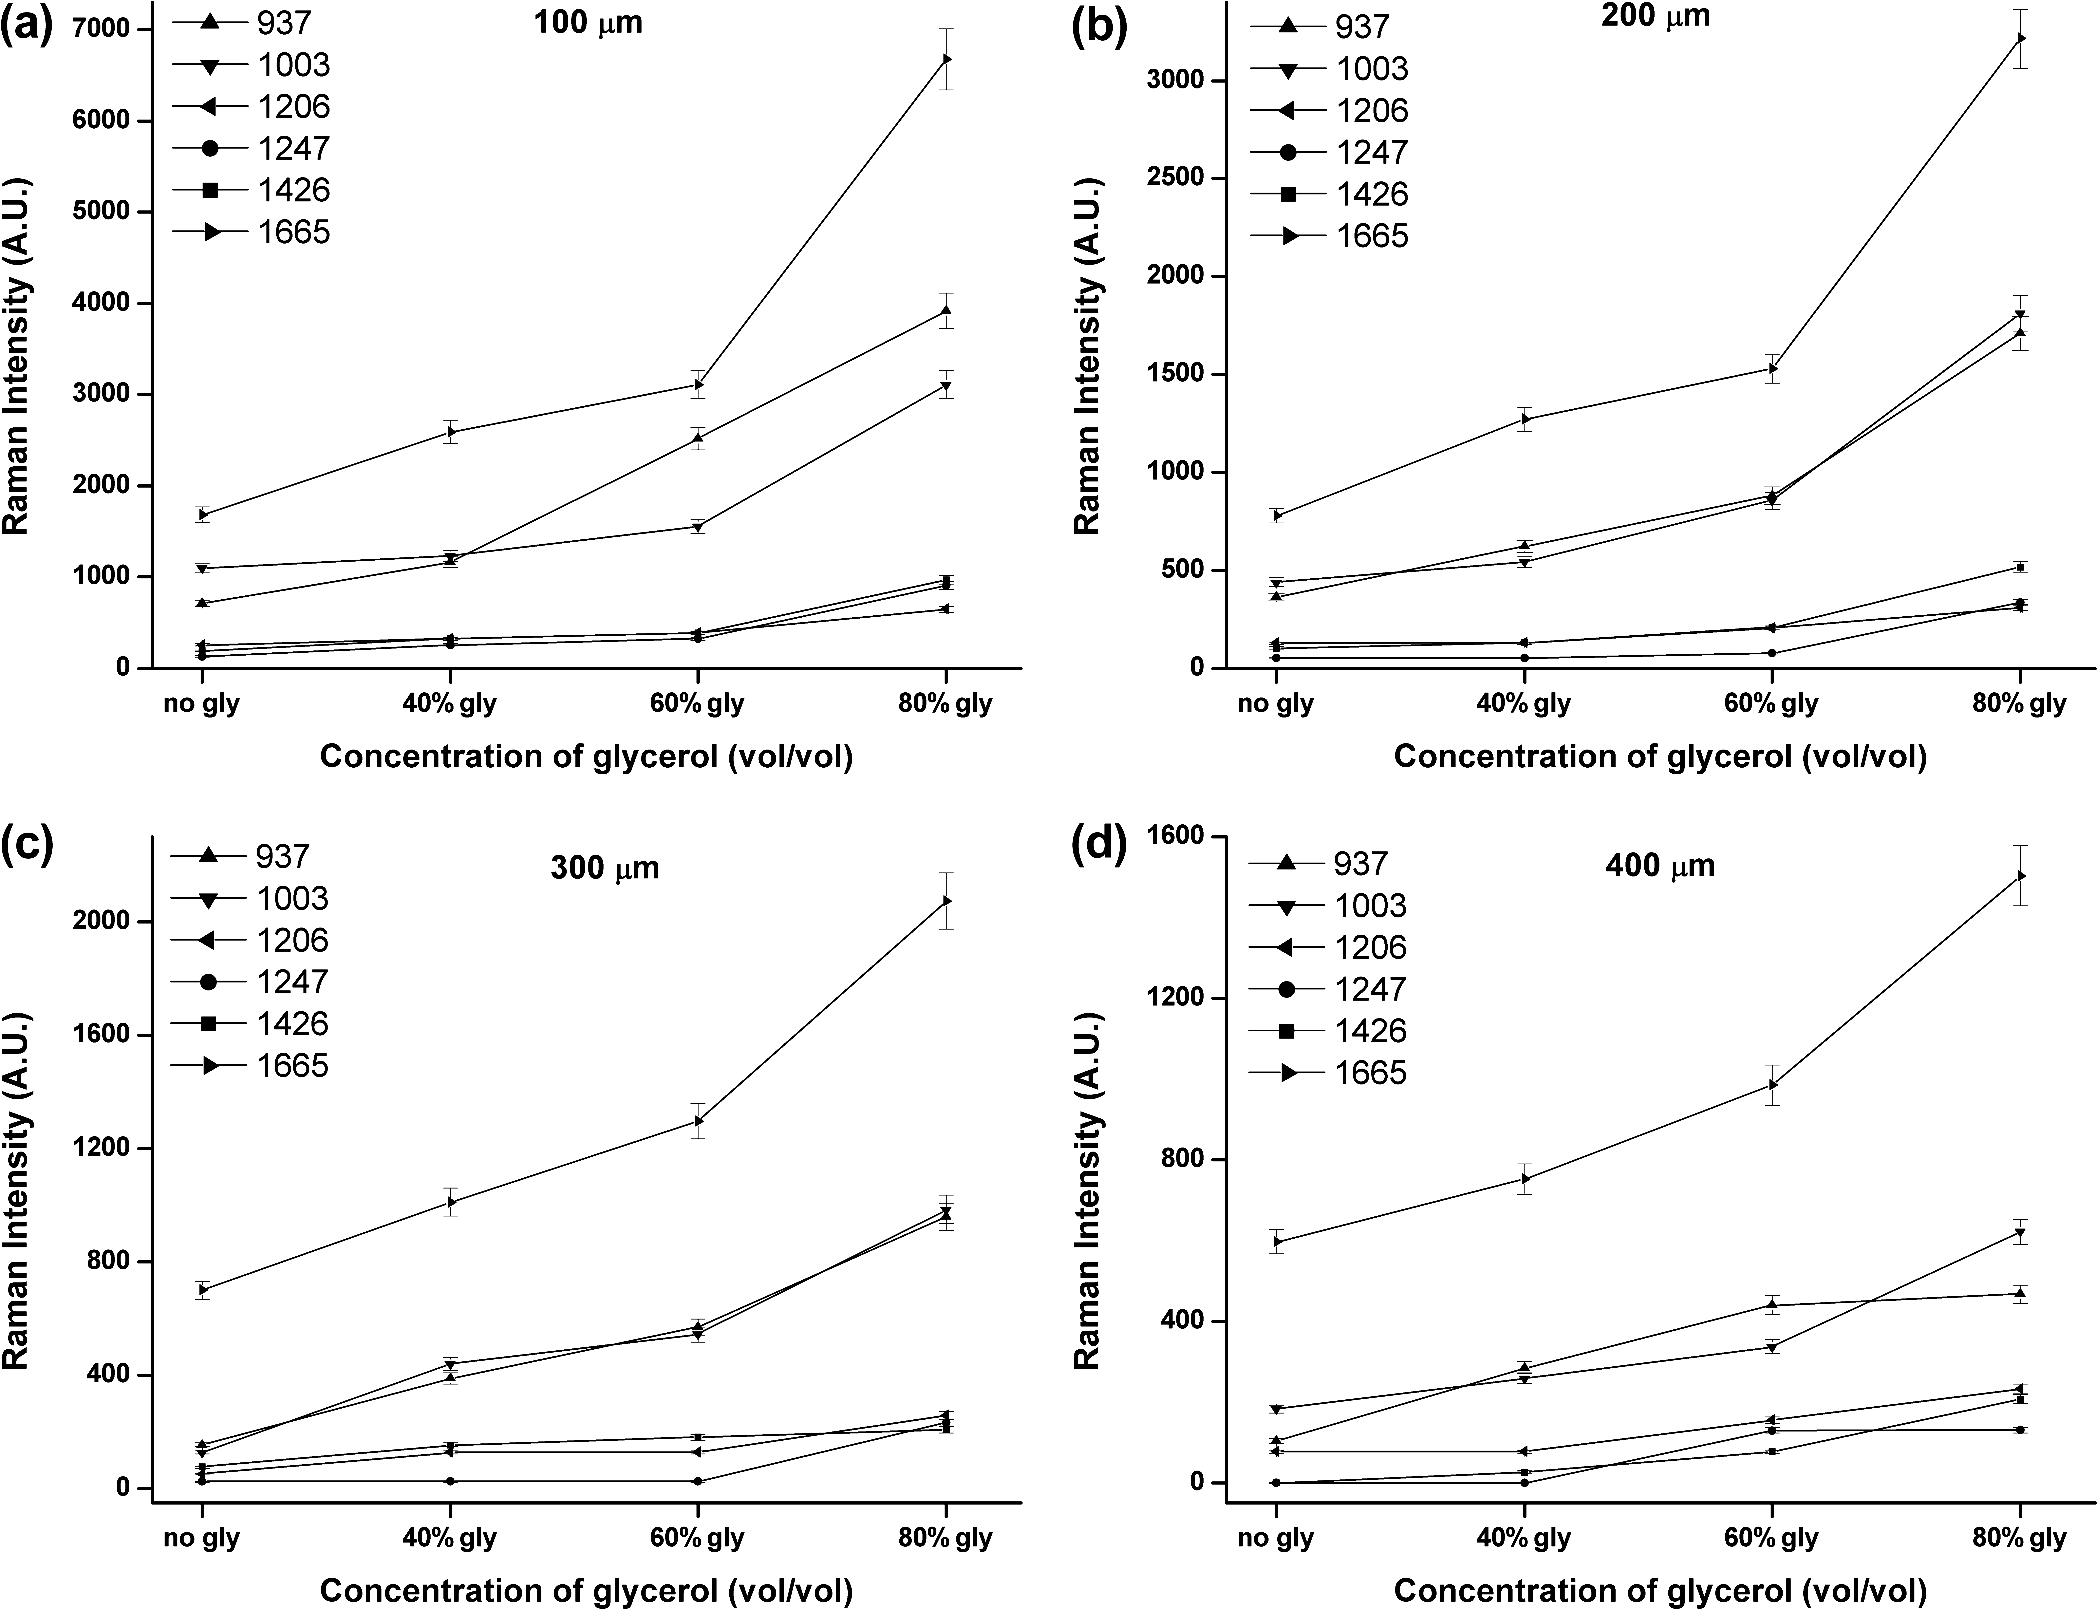 However, due to the diverse Raman responses of the different vibration modes, the main characteristic peaks and the Raman fingerprints of some molecules in porcine skin might be changed after being treated with glycerol. For comparison, we also prepared porcine skin tissue slide for Raman measurement and accorded its Raman spectra at the depth of 100, 200, 300, and 400 μm, as illustrated in (Fig. 3(c)). Apart from the greatly improved enhancement, the most striking observation was that, under all conditions, each Raman peak remained at the same positionwhich indicates that the optical clearing agent glycerol had little effect on the recovery of Raman spectra of porcine skin. The slight peak shifts of porcine skin after being treated with different concentration of glycerol were summarized and shown in Table 1. For all of these spectra, the peaks showed one-to-one correspondence and there was almost no peak shift. This is very useful for practical applications because it can provide clear molecular identification without any complications. Table 1Raman peak positions (in cm−1) of porcine skin at different depth and the relative spectral shifts after being treated with 40%, 60%, and 80% glycerol solution for 60 min
4.ConclusionWe have systematically examined the optical clearing of porcine skin by Raman microspectroscopy after application of different concentration of glycerol solution. The results reported here indicated that glycerol, with high-concentration, could markedly increase the detection depth of the RM in the skin, and could increase the intensity of the band of which played an important role in detection of cancers. Moreover, a unique property of the optical clearing effect of glycerol has been discovered. It was found, that the Raman signals resembled well the native spectrum of the molecules in porcine skin with a negligible frequency shift. The peculiar advantages of Raman penetration depth enhancement, signal contrast improvement, and non-destructive features make glycerol useful for applications of Raman measurement in life science. AcknowledgmentsThis work was supported by the National Natural Science Foundation of China (No. 60778047), the Natural Science Foundation of Guangdong Province (No. 9251063101000009) and Specialized Research Fund for the Doctoral Program of Higher Education of China (No. 200805740003). ReferencesA. C. WilliamsH. G. M. EdwardsB. W. Barry,
“Fourier transform Raman spectroscopy: a novel application for examining human stratum corneum,”
Int. J. Pharm., 81
(2–3), R11
–R14
(1992). http://dx.doi.org/10.1016/0378-5173(92)90022-T IJPHDE 0378-5173 Google Scholar
A. G. Ryder,
“Surface enhanced Raman scattering for narcotic detection and applications to chemical biology,”
Curr. Opin. Chem. Biol., 9
(5), 489
–493
(2005). http://dx.doi.org/10.1016/j.cbpa.2005.07.001 COCBF4 1367-5931 Google Scholar
J. G. GrasselliB. J. Bulkin, Analytical Raman Spectroscopy, JohnWiley & Sons, New York
(1991). Google Scholar
A. Mahadevan-JansenR. R. Richards-Kortum,
“Raman spectroscopy for the detection of cancers and precancers,”
J. Biomed. Opt., 1
(1), 31
–70
(1996). http://dx.doi.org/10.1117/12.227815 PSISDG 0277-786X Google Scholar
R. R. Richards-Kortum,
“Raman spectroscopy for the detection of cancers and precancers,”
J. Biomed. Opt., 1
(1), 41
(1996). JBOPFO 1083-3668 Google Scholar
X. M. DouY. Ozaki,
“Raman study of enzyme reactions using potassium ferricyanide as a reaction mediator: quantitative analysis of substrates and measurement of enzyme activity for glucose oxidase and lactate oxidase,”
Appl. Spectrosc., 52
(6), 815
–819
(1998). http://dx.doi.org/10.1366/0003702981944544 APSPA4 0003-7028 Google Scholar
A. Mahadevan-Jansenet al.,
“Development of a fiber optic probe to measure NIR Raman spectra of cervical tissue in vivo,”
Photochem. Photobiol., 68
(3), 427
–431
(1998). http://dx.doi.org/10.1111/php.1998.68.issue-3 PHCBAP 0031-8655 Google Scholar
P. J. Casperset al.,
“Automated depth-scanning confocal Raman microspectrometer for rapid in vivo determination of water concentration profiles in human skin,”
J. Raman Spectrosc., 31
(8–9), 813
–818
(2000). http://dx.doi.org/10.1002/(ISSN)1097-4555 JRSPAF 0377-0486 Google Scholar
M. G. Shimet al.,
“In vivo near-infrared Raman spectroscopy: demonstration of feasibility during clinical gastrointestinal endoscopy,”
Photochem. Photobiol., 72
(1), 146
–150
(2000). http://dx.doi.org/10.1562/0031-8655(2000)0720146IVNIRS2.0.CO2 PHCBAP 0031-8655 Google Scholar
H. P. Buschmanet al.,
“Raman microspectroscopy of human coronary atherosclerosis: biochemical assessment of cellular and extracellular morphologic structures in situ,”
Cardiovasc. Pathol., 10
(2), 69
–82
(2001). CATHE8 1054-8807 Google Scholar
P. J. Casperset al.,
“In vivo confocal Raman microspectroscopy of the skin: noninvasive determination of molecular concentration profiles,”
J. Invest. Dermatol., 116
(3), 434
–442
(2001). http://dx.doi.org/10.1046/j.1523-1747.2001.01258.x JIDEAE 0022-202X Google Scholar
Z. W. Huanget al.,
“Rapid near-infrared Raman spectroscopy system for real-time in vivo skin measurements,”
Opt. Lett., 26
(22), 1782
–1784
(2001). http://dx.doi.org/10.1364/OL.26.001782 OPLEDP 0146-9592 Google Scholar
P. J. Casperset al.,
“Monitoring the penetration enhancer dimethyl sulfoxide in human stratum corneum in vivo by confocal Raman spectroscopy,”
Pharmaceut. Res., 19
(10), 1577
–1580
(2002). http://dx.doi.org/10.1023/A:1020481305420 PHREEB 0724-8741 Google Scholar
P. J. CaspersG. W. LucassenG. J. Puppels,
“Combined in vivo confocal Raman spectroscopy and confocal microscopy of human skin,”
Biophys. J., 85
(1), 572
–580
(2003). http://dx.doi.org/10.1016/S0006-3495(03)74501-9 BIOJAU 0006-3495 Google Scholar
A. Molckovskyet al.,
“Diagnostic potential of near-infrared Raman spectroscopy in the colon: differentiating adenomatous from hyperplastic polyps,”
Gastrointest. Endosc., 57
(3), 396
–402
(2003). http://dx.doi.org/10.1067/mge.2003.105 GAENBQ 0016-5107 Google Scholar
Z. W. Huanget al.,
“Raman spectroscopy of in vivo cutaneous melanin,”
J. Biomed. Opt., 9
(6), 1198
–1205
(2004). http://dx.doi.org/10.1117/1.1805553 JBOPFO 1083-3668 Google Scholar
N. S. EikjeK. AizawaY. Ozaki,
“Vibrational spectroscopy for molecular characterisation and diagnosis of benign, premalignant and malignant skin tumours,”
Biotechnol. Annu. Rev.Elsevier, 191
–225
(2005). Google Scholar
Z. W. Huanget al.,
“Raman spectroscopy in combination with background near-infrared autofluorescence enhances the in vivo assessment of malignant tissues,”
Photochem. Photobiol., 81
(5), 1219
–1226
(2005). http://dx.doi.org/10.1562/2005-02-24-RA-449 PHCBAP 0031-8655 Google Scholar
F. M. Lynget al.,
“Vibrational spectroscopy for cervical cancer pathology, from biochemical analysis to diagnostic tool,”
Exp. Mol. Pathol., 82
(2), 121
–129
(2007). http://dx.doi.org/10.1016/j.yexmp.2007.01.001 EXMPA6 0014-4800 Google Scholar
A. Nijssenet al.,
“Discriminating basal cell carcinoma from perilesional skin using high wavenumber Raman spectroscopy,”
J. Biomed. Opt., 12
(3), 034004
(2007). http://dx.doi.org/10.1117/1.2750287 JBOPFO 1083-3668 Google Scholar
C. A. Lieberet al.,
“Raman microspectroscopy for skin cancer detection in vitro,”
J. Biomed. Opt., 13
(2), 024013
(2008). http://dx.doi.org/10.1117/1.2899155 JBOPFO 1083-3668 Google Scholar
M. A. Shortet al.,
“Development and preliminary results of an endoscopic Raman probe for potential in vivo diagnosis of lung cancers,”
Opt. Lett., 33
(7), 711
–713
(2008). http://dx.doi.org/10.1364/OL.33.000711 OPLEDP 0146-9592 Google Scholar
M. Larraona-Puyet al.,
“Development of Raman microspectroscopy for automated detection and imaging of basal cell carcinoma,”
J. Biomed. Opt., 14
(5), 054031
(2009). http://dx.doi.org/10.1117/1.3251053 JBOPFO 1083-3668 Google Scholar
J. Maet al.,
“Near-infrared Raman spectroscopy for detection of gastric cancer peritoneal dissemination in vivo,”
Proc. SPIE, 808714
(2011). http://dx.doi.org/10.1117/12.889431 PSISDG 0277-786X Google Scholar
K. BuckleyP. Matousek,
“Non-invasive analysis of turbid samples using deep Raman spectroscopy,”
Analyst, 136
(15), 3039
–3050
(2011). http://dx.doi.org/10.1039/c0an00723d ANLYAG 0365-4885 Google Scholar
N. Stoneet al.,
“Surface enhanced spatially offset Raman spectroscopic (SESORS) imaging—the next dimension,”
Chem. Sci., 2
(4), 776
–780
(2011). http://dx.doi.org/10.1039/c0sc00570c 1478-6524 Google Scholar
V. V. Tuchinet al.,
“Optical clearing of tissues and cells,”
J. Biomed. Opt., 13
(2), 021101
(2008). http://dx.doi.org/10.1117/1.2903745 JBOPFO 1083-3668 Google Scholar
V. V. Tuchin,
“A clear vision for laser diagnostics,”
IEEE J. Select. Topics on Quantum Electronics, 13
(6), 1621
–1628
(2007). http://dx.doi.org/10.1109/JSTQE.2007.911313 IJSQEN 1077-260X Google Scholar
E. A. GeninaA. N. BashkatovV. V. Tuchin,
“Tissue optical immersion clearing,”
Expert Rev. Med. Devices, 7
(6), 825
–842
(2010). http://dx.doi.org/10.1586/erd.10.50 ERMDDX 1743-4440 Google Scholar
J. Jianget al.,
“Penetration kinetics of dimethyl sulphoxide and glycerol in dynamic optical clearing of porcine skin tissue in vitro studied by Fourier transform infrared spectroscopic imaging,”
J. Biomed. Opt., 13
(2), 021105
(2008). http://dx.doi.org/10.1117/1.2899153 JBOPFO 1083-3668 Google Scholar
H. Zhonget al.,
“In vitro study of ultrasound and different-concentration glycerol—induced changes in human skin optical attenuation assessed with optical coherence tomography,”
J. Biomed. Opt., 15
(3), 036012
(2010). http://dx.doi.org/10.1117/1.3432750 JBOPFO 1083-3668 Google Scholar
A. N. Bashkatovet al.,
“Optical clearing of skin tissue produced by application of glucose solution: in vivo study,”
Proc. SPIE, 6163 616313
(2006). http://dx.doi.org/10.1117/12.697313 PSISDG 0277-786X Google Scholar
M. KinnunenR. MyllylaS. Vainio,
“Detecting glucose-induced changes in in vitro and in vivo experiments with optical coherence tomography,”
J. Biomed. Opt., 13
(2), 021111
(2008). http://dx.doi.org/10.1117/1.2904957 JBOPFO 1083-3668 Google Scholar
W. K. den Otteret al.,
“Modulating the skin barrier function by DMSO: molecular dynamics simulations of hydrophilic and hydrophobic transmembrane pores,”
Chem. Phys. Lipids, 154
(S2–S3),
(2008). http://dx.doi.org/10.1016/j.chemphyslip.2008.05.007 CPLIA4 0009-3084 Google Scholar
R. A. McClureet al.,
“Revisiting optical clearing with dimethyl sulfoxide (DMSO): in vitro and in vivo studies,”
Proc. SPIE, 7187 718707
(2009). http://dx.doi.org/10.1117/12.810888 PSISDG 0277-786X Google Scholar
H. Liuet al.,
“Dependence of tissue optical properties on solute-induced changes in refractive index and osmolarity,”
J. Biomed. Opt., 1
(2), 200
–211
(1996). http://dx.doi.org/10.1117/12.231370 JBOPFO 1083-3668 Google Scholar
O. Vargaset al.,
“Use of an agent to reduce scattering in skin,”
Lasers Surg. Med., 24
(2), 133
–141
(1999). http://dx.doi.org/10.1002/(ISSN)1096-9101 LSMEDI 0196-8092 Google Scholar
R. K. Wanget al.,
“Concurrent enhancement of imaging depth and contrast for optical coherence tomography by hyperosmotic agents,”
J. Opt. Soc. Am. B, 18
(7), 948
–953
(2001). http://dx.doi.org/10.1364/JOSAB.18.000948 JOBPDE 0740-3224 Google Scholar
V. V. TuchinX. Q. XuR. K. Wang,
“Dynamic optical coherence tomography in studies of optical clearing, sedimentation, and aggregation of immersed blood,”
Appl. Opt., 41
(1), 258
–271
(2002). http://dx.doi.org/10.1364/AO.41.000258 APOPAI 0003-6935 Google Scholar
R. K. WangJ. B. Elder,
“Propylene glycol as a contrasting agent for optical coherence tomography to image gastrointestinal tissues,”
Lasers Surg. Med., 30
(3), 201
–208
(2002). http://dx.doi.org/10.1002/(ISSN)1096-9101 LSMEDI 0196-8092 Google Scholar
X. Q. Xuet al.,
“Effect of dextran-induced changes in refractive index and aggregation on optical properties of whole blood,”
Phys. Med. Biol., 48
(9), 1205
–1221
(2003). http://dx.doi.org/10.1088/0031-9155/48/9/309 PHMBA7 0031-9155 Google Scholar
J. Y. JiangR. K. Wang,
“Comparing the synergistic effects of oleic acid and dimethyl sulfoxide as vehicles for optical clearing of skin tissue in vitro,”
Phys. Med. Biol., 49
(23), 5283
–5294
(2004). http://dx.doi.org/10.1088/0031-9155/49/23/006 PHMBA7 0031-9155 Google Scholar
J. JiangL. ZhangR. K. Wang,
“Synergistic effect of hyperosmotic agents under topical application on optical clearing of skin tissue in vitro,”
Proc. SPIE, 5696 80
–90
(2005). http://dx.doi.org/10.1117/12.589674 PSISDG 0277-786X Google Scholar
S. Plotnikovet al.,
“Optical clearing for improved contrast in second harmonic generation imaging of skeletal muscle,”
J. Biophys., 90
(1), 328
–339
(2006). http://dx.doi.org/10.1529/biophysj.105.066944 JBOIDZ 1687-8019 Google Scholar
V. V. Tuchinet al.,
“Light propagation in tissues with controlled optical properties,”
J. Biomed. Opt., 2
(4), 401
–417
(1997). http://dx.doi.org/10.1117/12.281502 JBOPFO 1083-3668 Google Scholar
X. XuQ. Zhu,
“Skin optical clearing enhancement with penetration enhancer azone using spectroscopy and optical coherence tomography,”
Proc. SPIE, 6791 67910F
(2008). http://dx.doi.org/10.1117/12.803974 PSISDG 0277-786X Google Scholar
A. MatsuiS. J. LomnesJ. V. Frangioni,
“Optical clearing of the skin for near-infrared fluorescence image-guided surgery,”
J. Biomed. Opt., 14
(2), 024019
(2009). http://dx.doi.org/10.1117/1.3103317 JBOPFO 1083-3668 Google Scholar
R. LaCombet al.,
“Quantitative second harmonic generation imaging and modeling of the optical clearing mechanism in striated muscle and tendon,”
J. Biomed. Opt., 13
(2), 021109
(2008). http://dx.doi.org/10.1117/1.2907207 JBOPFO 1083-3668 Google Scholar
X. XuQ. Zhu,
“Feasibility of sonophoretic delivery for effective skin optical clearing,”
IEEE Trans. Biomed. Eng., 55
(4), 1432
–1437
(2008). IEBEAX 0018-9294 Google Scholar
R. EllisE. GreenC. P. Winlove,
“Structural analysis of glycosaminoglycans and proteoglycans by means of Raman microspectrometry,”
Connect. Tissue Res., 50
(1), 29
–36
(2009). http://dx.doi.org/10.1080/03008200802398422 CVTRBC 0300-8207 Google Scholar
K. A. Dehringet al.,
“Correlating changes in collagen secondary structure with aging and defective type II collagen by Raman spectroscopy,”
Appl. Spectrosc., 60
(4), 366
–372
(2006). http://dx.doi.org/10.1366/000370206776593582 APSPA4 0003-7028 Google Scholar
K. A. Dehringet al.,
“Identifying chemical changes in subchondral bone taken from murine knee joints using Raman spectroscopy,”
Appl. Spectrosc., 60
(10), 1134
–1141
(2006). http://dx.doi.org/10.1366/000370206778664743 APSPA4 0003-7028 Google Scholar
M. V. Schulmerichet al.,
“Optical clearing in transcutaneous Raman spectroscopy of murine cortical bone tissue,”
J. Biomed. Opt., 13
(2), 021108
(2008). http://dx.doi.org/10.1117/1.2892687 JBOPFO 1083-3668 Google Scholar
Z. Maoet al.,
“Influence of glycerol with different concentrations on skin optical clearing and morphological changes in vivo,”
Proc. SPIE, 7278 72781T
(2008). http://dx.doi.org/10.1117/12.823310 PSISDG 0277-786X Google Scholar
|