
|
|
1.IntroductionSurface plasmon resonance (SPR) is a well-known and surface-sensitive optical technique for monitoring biomolecular interactions. SPR has developed rapidly as a biosensor1 since it was first used for biosensing purposes 27 years ago.2 SPR sensor technology has been commercialized. For label-free and rapid real-time detection, SPR biosensors have become powerful tools for characterizing and quantifying biomolecular interactions.3–6 Current SPR devices, such as the Spreeta™ (Texas Instruments. Corporation) and FT-SPR100 (GWB Technologies Corporation), mainly use a single monitoring tunnel for measuring two kinds of specific biomolecular interactions. A few SPR devices, including Biacore 4000 (BIAcore AB Corporation) with four SPR channels in one chip,7 monitor multiple biomolecular interactions in series using various tunnels, in which each tunnel corresponds to two kinds of specific biomolecular interactions. These SPR devices all use flowing bioreactors by continuously injecting a mixed solution of the sample and reagents. Several milliliters of the mixed solution are consumed in one test assay. Integrated with a charge-coupled device (CCD) to obtain images, SPRi is well suited for simultaneously monitoring several chemically different surfaces that comprise a photo-patterned array8,9 in a high-throughput manner.4,10,11 In addition, higher throughput with this image-based readout method can be achieved by enlarging the imaged area. However, imaging in solution is characterized by low sensitivity because there is a low refractive index difference between the binding molecules and the blank area in the solution compared to in the air. Most current SPRi performs endpoint detection in the air to detect biomolecular interactions instead of dynamic monitoring in solution. For example, SPRi Array Platform (Horiba Co. Ltd.) only provides images at the beginning and at the end of the experiment and displays a real-time profile of the reaction process without its dynamic details.12 Interactions between antibodies and antigens are widely used in many methods, such as western blotting, immunofluorescence, and enzyme linked immuno sorbent assay (ELISA). However, these protein detection methods are black boxes with low throughput and a high sample cost. Therefore, developing a high-throughput polypeptide detection and visualization platform for drug discovery is needed. Screening polypeptides with a high-throughput method and many simultaneous antibodies is desirable. We achieved this goal using SPRi and microarrays. In addition to being high throughput, this method is label-free, rapid, and economical and can achieve real-time monitoring of antibody-polypeptide binding. In this work, we established a SPRi system and a peptide microarray chip for real-time and high-throughput monitoring of antibody-polypeptide binding in solution. A series of microarrays with various peptide concentrations were used to analyze the detection limit and specificity of antibody-polypeptide binding. Smart images processing software was developed for the SPRi system to provide three kinds of visualization information for high-throughput antibody-polypeptide binding: real-time imaging of the polypeptide microarray, three-dimensional histograms of dynamic binding process of all microarray tunnels, and specific profiles of antibody-peptide interactions in each tunnel. 2.Material and Methods2.1.Chemicals and ReagentsWe purchased 11-Mercaptoundecanoic acid (MUA), N-hydroxysuccinimide (NHS), and 10 nm streptavidin-coated colloidal gold nanoparticles from Sigma—Aldrich (China). Shanghai Sangon (China) provided N-(3-Dimethylaminopropyl)-N’-ethylcarbodiimide hydrochloride (EDC). The polypeptides and their relevant antibodies were supplied by Capitalbio (China). A biotin-coupled antirabbit antibody was purchased from Zsbio (China). Phosphate-buffered saline (PBS, pH 7.4) was used as the flow solution and dilution buffer for the SPRi analysis. Ultrapure water (18 MΩ) was obtained using an ultrapure water system from Milli-Q (Millipore Billerica, USA) and used for all of the aqueous solutions and rinses. 2.2.Antibody Preparation and PurificationThe peptide information is shown in Table 1. The peptides and their corresponding antibodies were randomly selected from the Capitalbio peptide-antibody library. The original proteins from which the selected peptides were derived are involved in various biochemical reactions, such as phosphorylation, deubiquitination, and ubiquitination. Table 1Peptide information.
The antibodies were produced by injecting the peptides into rabbits. After two months, the blood was collected and the antibodies were purified from the rabbit serum using immunoprecipitation. 2.3.Optimizing the SPRi ConditionsA five-layer mechanical model [Fig. 1(a)] was used to analyze the relationships among the reflectivity, incidence angle, and wavelength. The Fresnel equation and reflectivity equation for a single layer was used to calculate the complex reflection coefficient .13 Here: Where represents the incident angle (°), is the incident wavelength (nm), denotes the dielectric coefficient, and is the thickness (nm).Fig. 1(a) A mechanical model for the MATLAB simulation. (b) The simulated SPR results fell within angle and wavelength ranges. (c) The simulated SPR results occurred with a prism dielectric coefficient of ε1 and a sample change in the buffer solution. 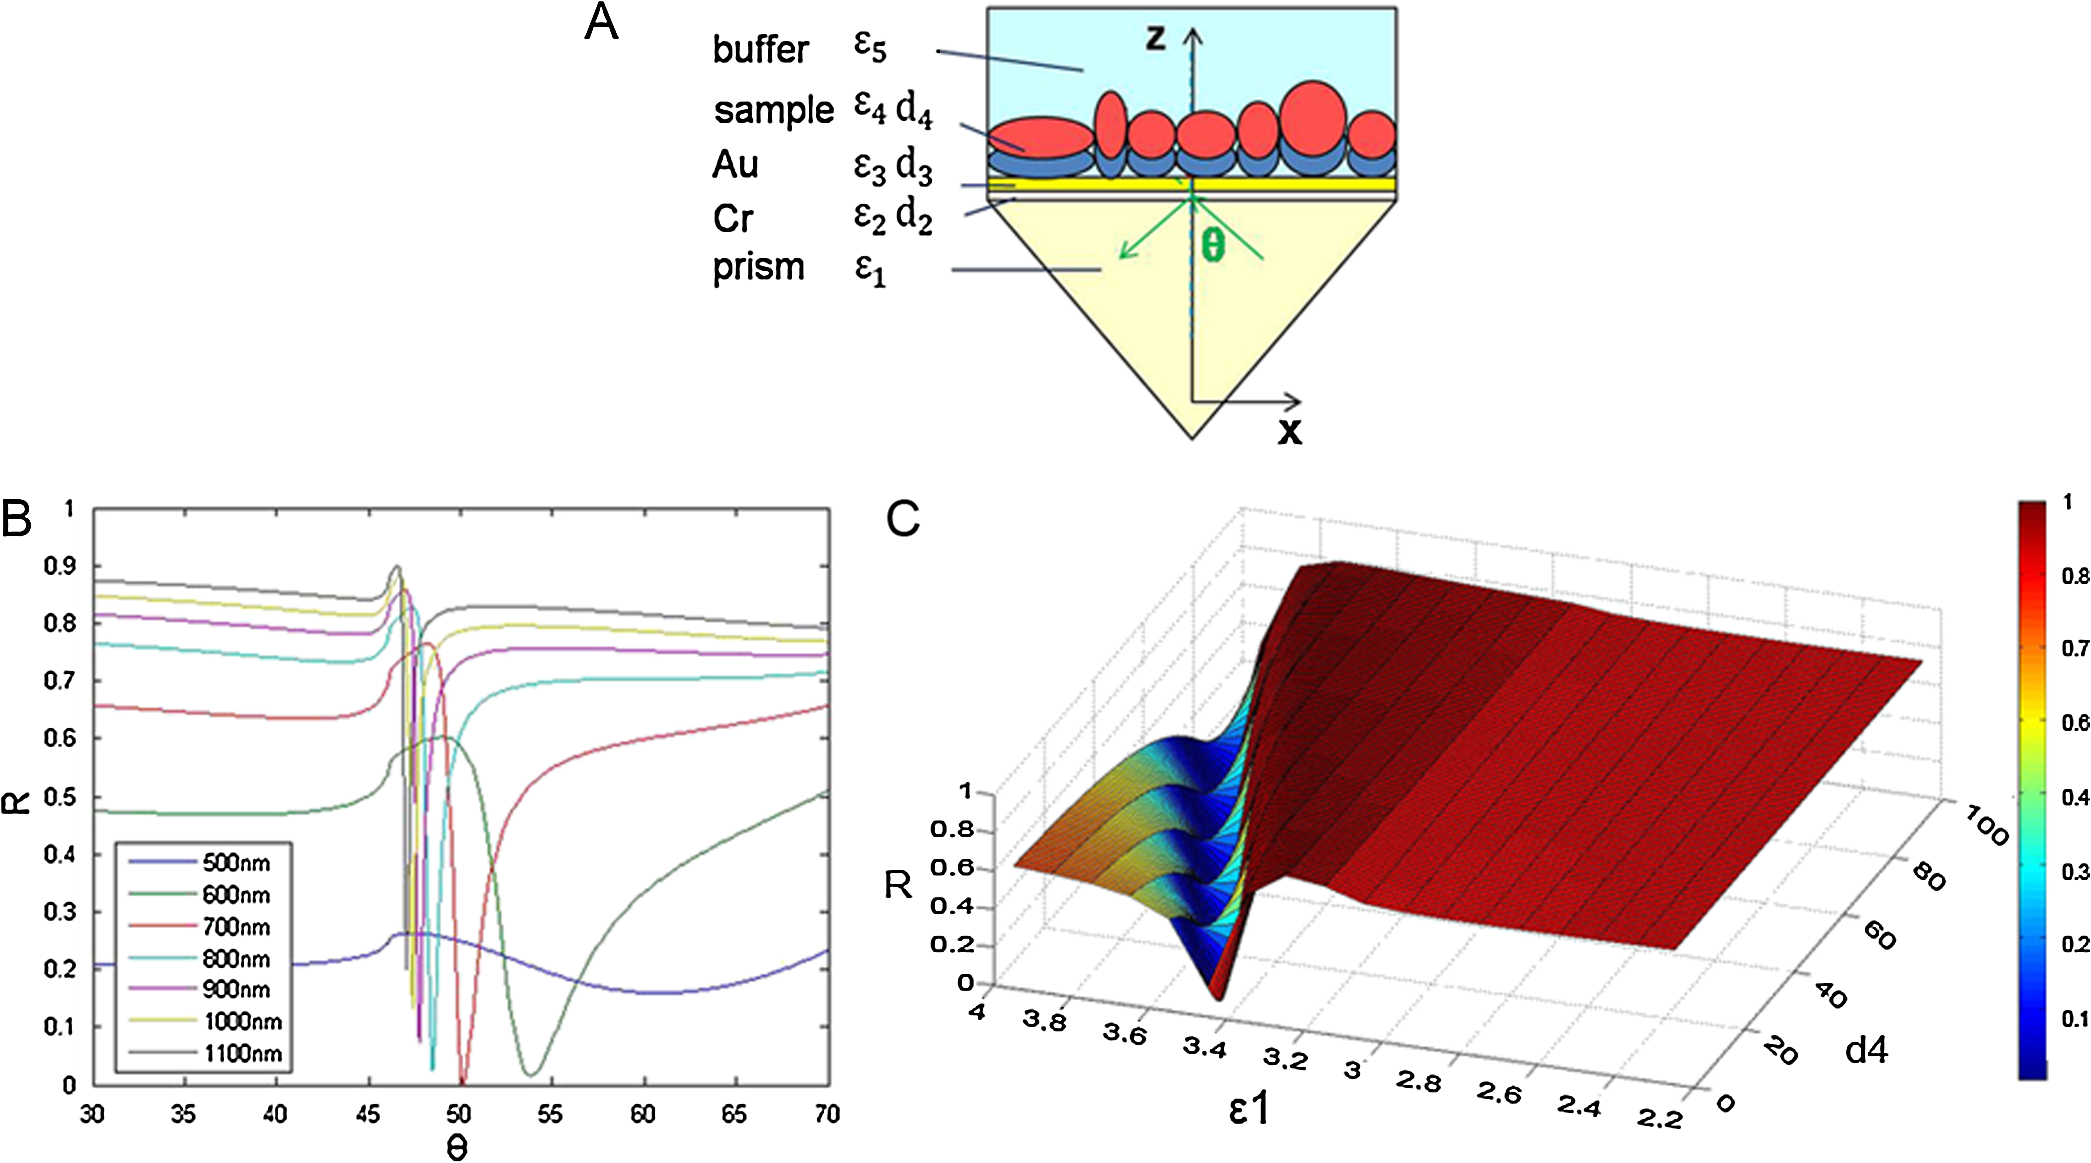 We used MATLAB to calculate the appropriate incident angle and incident wavelength, which were used to approximate the SPR angle and SPR wavelength associated with the background buffer. When the buffer was water, we obtained curves for the background , which correspond to the various incident angles and wavelengths shown in Fig. 1(b). Next, we chose an appropriate incident angle in the range of 45 to 50 deg and an incident wavelength in the range of 700 to 900 nm [Fig. 1(b)] to perform SPRi detection of antibody-polypeptide binding. Based on these experiments, an optimized SPR incident angle of 49.8 deg and an incident wavelength of 800 nm were selected for the subsequent experiments in the actual reaction solution. By holding the optimized SPRi incident angle and incident wavelength constant, the prism and chip materials were further optimized. Although they are rarely reported, these parameters are important for dynamic SPRi detection in solution. In order to obtain a high SPRi sensitivity of binding molecules in solution, instead of end-detection in the air, a simplified model using a single material for the prism and floor plate of the SPRi chip was used to analyze the complex reflection coefficient . The simulated results of the complex reflection coefficient with a dielectric coefficient for the prism and a sample thickness of are shown in Fig. 1(c). The dielectric coefficients of the sample () and buffer () were held constant, such that a change in the sample thickness () represented a change in the sample. The curved 3D face in Fig. 1(c) demonstrates that the dielectric coefficient of the prism () should be in the narrow range of 3.4 to 3.6 to achieve a sensitive response when the sample thickness () in the buffer solution changes. The prism and chip materials were optimized using ZF17 glass () in our SPRi system. 2.4.Preparation of the SPRi ChipFirst, a chromium layer with a thickness of 3 nm was vapor-deposited onto a ZF17 glass slide (). Second, a gold layer with a thickness of 47 nm was vapor-deposited onto the chromium layer. Next, the slide was immersed into a 2 mM ethanolic solution for 12 h. An alkanethiol monolayer of MUA was formed on the gold film. After thorough rinsing with both ethanol and water, a mixture of 0.05 M NHS and 0.2 M EDC was added to surface-activate the gold chip. A stick-on rubber tie plate with a thickness of 0.5 mm was pasted onto the surface of the gold chip to insulate the entire chip with the 12 isolated biological microreaction cells. A probe array (corresponding to 25 monitoring tunnels) was printed inside each cell using a commercial microarray robot spotter (Capitalbio, China), and a SPRi gold chip with 300 SPR monitoring tunnels was obtained [shown in Fig. 2(a)]. The gold SPRi chip was incubated for 2 h in a moist box and then blocked with 1% BSA. A schematic diagram of the probe array in each cell is shown in Fig. 2(b). Five identical spots are found in each row and correspond to five repeated tunnels for a single molecular probe. The five rows represent five different molecular probes (peptide 283-2, peptide 204-2, peptide 200-2, buffer as a negative control, and BSA as a positive control). Except for the negative control in the fourth row (1× PBS), the other rows were spotted with a concentration of . The diameter of each spot was 150 μm, and the distance between any two spots was 300 μm. The probe array used only 30% of the space in the microreaction cell. In addition, arrays of probes can be printed inside the microreaction cell using the Capitalbio microarray robot spotter (Capitalbio, China). 2.5.The Custom-Made SPRi Analysis SystemThe SPRi system shown in Fig. 3 was composed of a wavelength-tunable monochromator (ZhuoLiHanGuang Corp., Beijing, China), a prism-coupled SPRi device, a microfluidic pump (Harvard, USA) and a PC (Dell, China) with smart images processing software to analyze the imaging results in real time. To better visualize the results achieved with the prism-coupled SPRi device in real time, polarized imaging was used to drop the influence of light diffusion, a telecentric imaging lens with 8 mm-wide depth of field was designed with diffusion extraction for the tilted imaging, and the whole imaging road was sealed extinction. The numerical aperture of the telecentric imaging lens was 0.3. A 16-bit cooled CCD was used to improve the molecular binding resolution from the change of light intensity of spots on the microarray. The smart images processing software was joined with some filter processing to improve signal-to-noise ratio and to correct the distribution of images, Uneven illumination on the chip and the effect of liquid were corrected by reducing the change of light intensity on buffer spots as a negative quality management marker on the microarray chip. All images, profiles, and histograms were processed in real time before display. During SPR imaging, an incidence-polarized monochromatic light beam is passed through the prism and excites the gold SPRi chip. Some of the incident light is reflected by the gold layer. Some is absorbed by the thin gold-coated layer and produces a surface plasmon wave in the thin gold-coated layer. When the sample solution injected from the inlet flows on the gold layer surface of the SPRi chip, the resonance frequency of the surface plasmon wave in the gold layer changes based on the concentration of the sample solution and molecular binding onto the surface of the gold layer. A series of reflected light intensities from the gold layer (detected by a CCD) can be obtained by changing the incidence angle and wavelength of the incidence-polarized monochromatic light. The greatest absorbing excitation of the surface plasmon wave at the gold/sample solution interface results in a nearly complete attenuation of the reflected light intensity when the incident angle and wavelength are approximately the same as the surface plasmon resonance angle and wavelength, respectively. Fig. 3(a) A schematic diagram of the self-made SPRi system. (b) The three-dimensional structure of the microfluidic bioreactor (microarray design, dynamic imaging, dynamic 3D histogram, and dynamic profile). 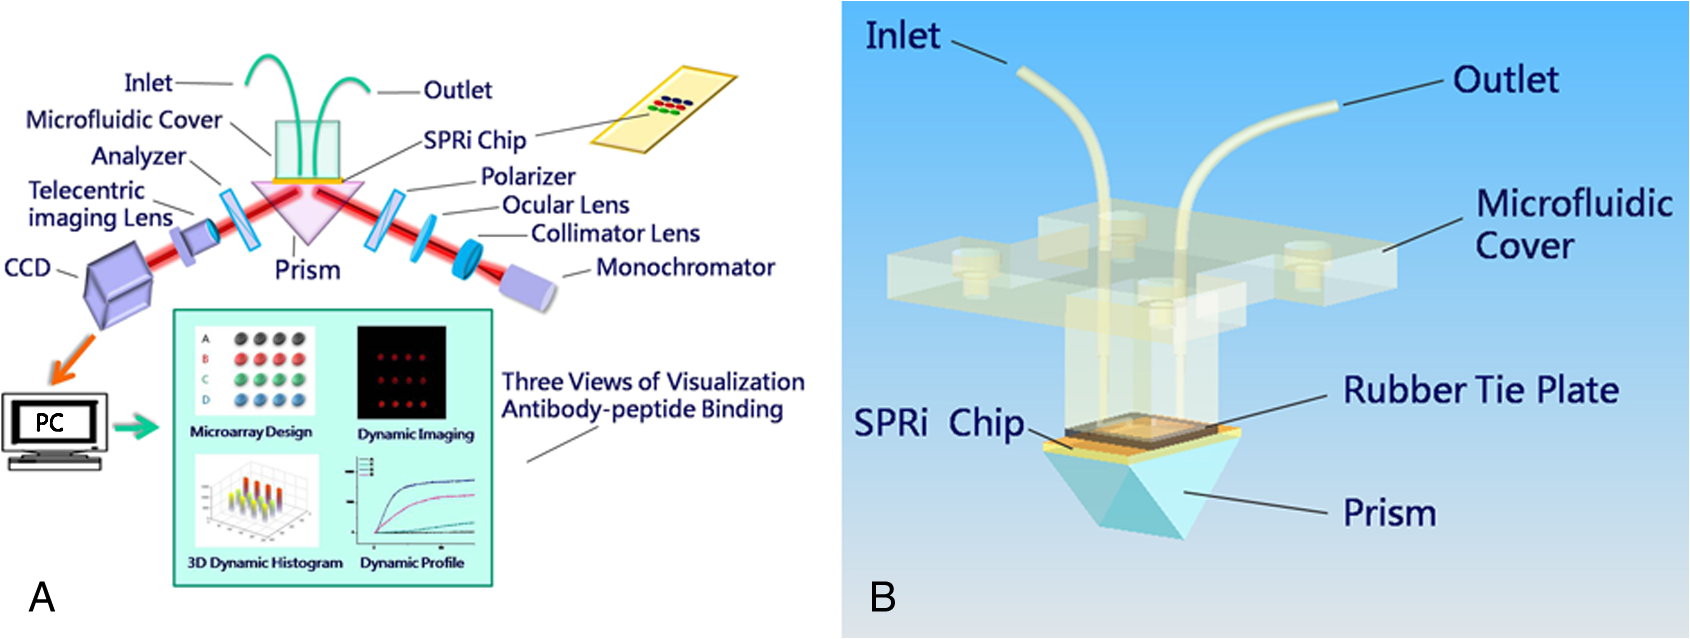 When the incident angle and wavelength are fixed to be the surface plasmon resonance angle and wavelength, respectively, the reflected light intensity detected by the CCD can be used to monitor molecular binding on the surface of the gold layer. A series of dynamic images are sent to a PC. The software developed by the PC programming tool can be used to display dynamic images of molecular binding onto the surface of the gold layer and visualize the peptide binding in each tunnel. In addition, three-dimensional histograms of the dynamic combinations in the whole microarray tunnels of the SPRi peptide chip are also produced. A key feature of the software is its ability to show dynamic intensity changes in many of the selected regions of the biological microreaction cell of the SPRi gold chip and plot/store the intensity of the region versus time in real time. The gold SPRi chip was matched to the prism using a refractive index matching that of oil. A microfluidic polymethyl methacrylate (PMMA) cover was used to stabilize the chip and simultaneously constitute a biological microreaction cell () for the sample solution to contact the peptide microarray on the surface of the SPRi chip. The sample solution was impelled into the bioreaction cell from the inlet by a microflow pump, filled the microreaction cell, and finally retreated from the outlet. The microflow velocity was . The entire experiment was performed at the appropriate temperature (40°C, the internal temperature of a rabbit). To reduce sample and reagent consumption, we performed reciprocal flow between the inlet and outlet instead of continuous flow from the inlet to the outlet. The diameter of the optical beam was 20 mm. The diameter of the field of view was 15 mm. The microarray was spotted in a square area of . The design of the imaging area, field of view and optical beam, from small to large, was for the purpose of improving the quality of images. The total sample and reagent consumption was less than 30 μl for one test, indicating that the maximum number of tunnels () in a microreaction cell and fewer than 80 nL of sample and reagent consumption per monitoring tunnel can be realized for visualizing high-throughput biomolecule interactions for biological and medical applications. 3.Results and Discussion3.1.Verification of Antibody Binding Peptides on a Microarray Chip using the SPRi SystemThe antibody-binding peptide on the microarray chip was directly imaged in real time to visualize dynamic antibody-antigen interactions and verify the SPRi system. Before detection, the background was adjusted to the state of the minimum damping of the reflected light intensity. Because the peptide probe was too small to create a visible spot image, the reflected light intensity of the peptide probe region was almost identical to the background before antibody binding. When the mixture of the reagent and antibody sample (e.g., anti-283-2, anti-204-2, and anti-200-2) was injected into the microreaction cell, the antibody migrated and specifically bound to the peptide probe on the surface of microarray chip and changed the reflected light intensity in the corresponding probe region. A series of antibody-binding peptide probes was imaged in real time using the SPRi system, as shown as Fig. 4. The concentration of the antibody solution was . All the images were detected 5 min after the start of the reaction, and 1× phosphate-buffered saline (PBS, pH 7.4) was used as a negative control [Fig. 4(e)]. The peptide microarray chip and SPRi system exhibited excellent specificity for the high-throughput visualization of antibody-peptide interactions. Fig. 4Visible imaging of the antibody-binding peptide probe on the peptide microarray chip. (a) A schematic diagram of the peptide probe array. (b) The anti-283-2-binding peptide probe on the peptide microarray chip. (c) The anti-204-2-binding peptide probe on the peptide microarray chip. (d) The anti-200-2-binding peptide probe on the peptide microarray chip. (e) The 1× PBS buffer-binding peptide probe on the peptide microarray chip. (f) A mixture of the anti-283-2- and anti-204-2-binding peptide probes on the peptide microarray chip. (g) A mixture of the anti-283-2- and anti-200-2-binding peptide probes on the peptide microarray chip. (h) A mixture of the anti-204-2- and anti-200-2-binding peptide probes on the peptide microarray chip. (i) A mixture of the anti-283-2-, anti-204-2-, and anti-200-2-binding peptide probes on the peptide microarray chip.  3.2.High-Throughput Visualization of Antibody-Peptide Binding for Protein Drug ScreeningPeptides are important molecules in protein drug screening. Using the software that we developed, high-throughput antibody-peptide binding can be visualized for drug screening, including dynamic imaging of antibody-peptide binding for studying specific interactions, visualizing the dynamic profile of antibody-peptide binding in each tunnel to analyze dynamic mechanical processes, and producing three-dimensional histograms of whole tunnels in the SPRi peptide microarray chip for high-throughput drug screening. Figure 5 shows the visualization of antibody-peptide binding, in which the entire antibody-peptide binding process was monitored continuously about 140 min. Figure 5(a) shows 10 images of the mixture of three antibodies (anti-283-2, anti-204-2, anti-200-2) binding to the peptide probe array at 10 different time points (0, 1, 5, 20, 30, 40, 60, 120, 130, and 140 min). The dynamic monitoring signals from the five different probes during antibody-peptide binding correspond to anti-283-2 binding to peptide 283-2, anti-204-2 binding to peptide 204-2, anti-200-2 binding to peptide 200-2, and no molecular binding to the buffer and BSA probes [Fig. 5(b)]. These results indicate that antibody-peptide binding can be detected within 1 min [Fig. 5(a), II]. The signals rose continuously for 120 min and reached a plateau phase at the end [Fig. 5(b)]. The change in the reflected light intensity due to antibody-peptide binding reached an exponential stage within 30 min [Fig. 5(b)]. Figure 5(b) indicates that anti-204-2 binding to peptide 204-2 was the most rapid, and anti-283-2 binding to peptide 283-2 was the strongest. Fig. 5High-throughput visualization of dynamic antibody-peptide binding to five different probes within 140 min. (a) Images of antibody-peptide binding for the mixtures of three antipeptide antibodies at 10 different time points and a three-dimensional visual histogram. (b) The entire dynamic binding processes of the three pairs of antibodies and peptides.  3.3.Analyzing the Limit of Detection of Antibody-Peptide BindingA platform’s detection sensitivity is very important. Antibody (anti-200-2) concentrations from to were prepared to test the limit of detection of the peptide microarray chip and the SPRi system. Figure 6 shows the results of the detection limit experiments. In Fig. 6, the limit of detection of antibodies is , which corresponds to more than a twofold improvement in the signal-to-noise ratio compared to the negative control. 3.4.A Potential Method to Improve SensitivityTo amplify the original response signal, one or two additional modifications were used. A tagged secondary antibody was added to the primary antibody, and the corresponding ligand that binds to the tag was then added. Because the peptide antibody was entirely rabbit IgG, it was capable of binding to antirabbit IgG. If the secondary antibody were modified by biotin, it could be bound by gold nanoparticles coated with streptavidin. The first binding signal was amplified to obtain to increase the sensitivity. Figure 7 shows a three-step cascade-binding process for peptide detection. Four identical arrays were taken through a four-step binding process. Figure 7(a) shows the peptide probe and the positive control (BSA) spots visible when the microreaction cell was immersed in PBS. After the microreaction cell was injected with the mixture of the reagent and the rabbit anti-204-2 antibody, one row of spots (corresponding to peptide-204-2) was visible due to the binding between anti-204-2 and peptide-204-2 as shown in Fig. 7(b), the relative signal intensity was 67.2. For two-step cascade binding, a mixture of the reagent and the biotin-coupled antirabbit antibody was injected into the microreaction cell. The anti-204-2 that was bound to the peptide-204-2 probe on the microarray bound to the biotin-coupled antirabbit antibody, and the signal intensity increased [Fig. 7(c)]. Finally, streptavidin-coated gold nanoparticles were added to the microreaction cell, and the signal intensity increased again, as shown in Fig. 7(d); the relative signal intensity was 5370.8. The relative signal intensity was amplified more than 100-fold from Fig. 7(b) to Fig. 7(d), suggesting that a high-throughput ultrasensitive peptide detection on the order of could be performed using the peptide microarray chip and SPRi system via a three-step cascade binding process. Fig. 7Multiple cascade binding to improve the sensitivity of peptide detection. (a) The peptide probe alone. (b) The peptide probe after binding to the rabbit antipeptide antibody. (c) The peptide probe after binding to the biotin-coupled antirabbit antibody. (d) The final binding to the streptavidin-coated gold nanoparticles. 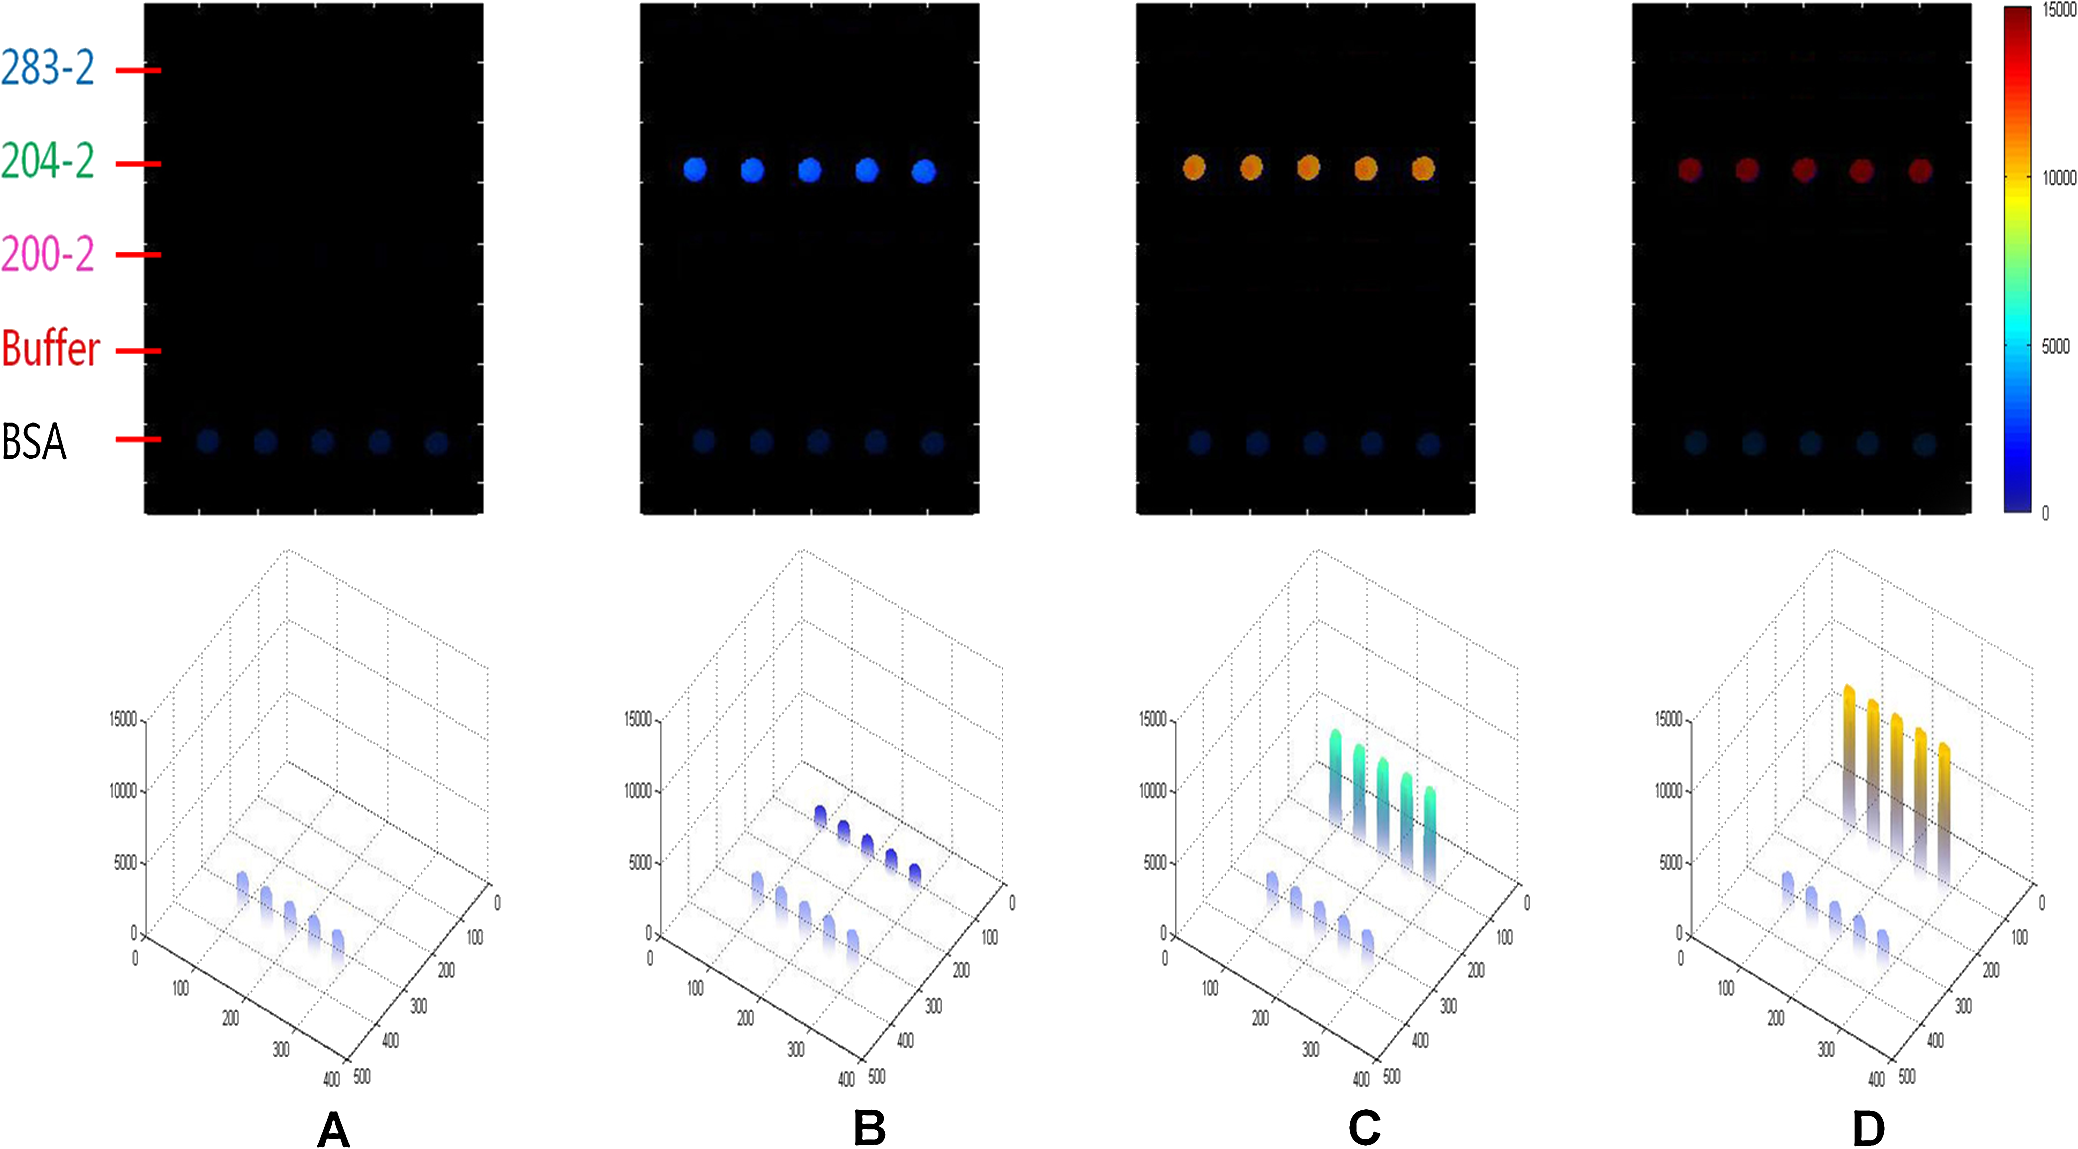 4.ConclusionsThe SPRi microarray chip and system were developed to detect antibody-peptide binding in a more high-throughput, real-time, and label-free manner compared to ELISA/radio immunoassay (RIA) methods. The SPRi peptide microarray chip can be used to meet the potential needs of drug development and drug screening, including studying specific antibody-peptide interactions and analyzing dynamic mechanical processes. The prism and chip materials were optimized for dynamic SPRi detection in solution. Dynamic three-dimensional histograms of antibody-peptide binding in whole tunnels in the SPRi peptide microarray chip provide a new perceptual view of the process of high-throughput drug screening. The detection limit of antibody-peptide binding reached , although the detection limit could be further improved to the level of using a three-step cascade binding process. The maximum size () probe array can be printed inside a microreaction cell, and 400 parallel peptide-antibody binding tunnels can be dynamically monitored. Moreover, the sample and reagent consumption can be reduced to 80 nL for one testing tunnel. All results obtained in this paper by SPR imager, including images, profiles and histograms, only indicate a relative intensity change of spots in dynamic process of molecular binding, which are qualitative analysis or semi quantitative analysis. When the relative intensity change was used to calculate the molecular concentration, some molecular concentrations to have been known should be used to demarcate the relation of intensity change to molecular concentration in advanced, and then, the images processing software will integrate the demarcated relation and calculate automatically molecular concentration from real intensity change to be measured, which is our next work to improve SPR imager for quantitative analysis to binding molecules of different analytes. Our experimental results indicate that the peptide microarray chip and SPRi system are well suited for visualization multiplex immunoassays of peptide-antibody interactions. Furthermore, the SPR imager supported multiple expression forms suitable for real-time experiments in solution, including dynamic images of the microarray, 3D histograms for real-time monitoring reaction details on the surface, and the time course of each spot (corresponding one analyzing tunnel) for dynamic analysis, which is important evolution to make the current black-box biochemical reaction visualizing for widely application in life science and medicine. AcknowledgmentsThis work was supported by the National Supporting Plan of China (2011BAZ03288), the National Program on Key Basic Research Projects 973 of China (2011CB707701), the National Natural Science Foundation of China (60978064), the Science Plan Foundation of Zhejiang (2012C31G321000*), and the TSINGHUA-SIEMENS Collective Foundation (20103000273). ReferencesB. LiedbergC. NylanderI. Lundström,
“Biosensing with surface plasmon resonance—how it all started,”
Biosens. Bioelectron., 10
(8), i
–ix
(1995). http://dx.doi.org/10.1016/0956-5663(95)96965-2 BBIOE4 0956-5663 Google Scholar
B. LiedbergC. NylanderI. Lunström,
“Surface plasmon resonance for gas detection and biosensing,”
Sens. Actuators, 4 299
–304
(1983). http://dx.doi.org/10.1016/0250-6874(83)85036-7 SEACDX 0250-6874 Google Scholar
C. E. Jordanet al.,
“Surface plasmon resonance imaging measurements of DNA hybridization adsorption and streptavidin/DNA multilayer formation at chemically modified gold surfaces,”
Anal Chem, 69
(24), 4939
–4947
(1997). http://dx.doi.org/10.1021/ac9709763 ANCHAM 0003-2700 Google Scholar
A. J. Thielet al.,
“In situ surface plasmon resonance imaging detection of DNA hybridization to oligonucleotide arrays on gold surfaces,”
Anal. Chem., 69
(24), 4948
–4956
(1997). http://dx.doi.org/10.1021/ac9708001 ANCHAM 0003-2700 Google Scholar
X. D. HoaA. G. KirkM. Tabrizian,
“Towards integrated and sensitive surface plasmon resonance biosensors: a review of recent progress,”
Biosens. Bioelectron., 23
(2), 151
–160
(2007). http://dx.doi.org/10.1016/j.bios.2007.07.001 BBIOE4 0956-5663 Google Scholar
M. A. Cooper, Label-Free Biosensors: Techniques and Applications, 1st ed.Cambridge University Press, New York
(2009). Google Scholar
C. E. JordanR. M. Corn,
“Surface plasmon resonance imaging measurements of electrostatic biopolymer adsorption onto chemically modified gold surfaces,”
Anal. Chem., 69
(7), 1449
–1456
(1997). http://dx.doi.org/10.1021/ac961012z ANCHAM 0003-2700 Google Scholar
S. D. Evanset al.,
“Surface plasmon resonance imaging of liquid crystal anchoring on patterned self-assembled monolayers,”
J. Phys. Chem. B, 101
(12), 2143
–2148
(1997). http://dx.doi.org/10.1021/jp9633411 JPCBFK 1520-5207 Google Scholar
H. J. LeeT. T. GoodrichR. M. Corn,
“SPR imaging measurements of 1-D and 2-D DNA microarrays created from microfluidic channels on gold thin films,”
Anal. Chem., 73
(22), 5525
–5531
(2001). http://dx.doi.org/10.1021/ac010762s ANCHAM 0003-2700 Google Scholar
C. Nogueset al.,
“Characterisation of peptide microarrays for studying antibody-antigen binding using surface plasmon resonance imagery,”
PLoS ONE, 5
(8), e12152
(2010). http://dx.doi.org/10.1371/journal.pone.0012152 POLNCL 1932-6203 Google Scholar
E. Suranitiet al.,
“Real-time detection of lymphocytes binding on an antibody chip using SPR imaging,”
Lab Chip, 7
(9), 1206
–1208
(2007). http://dx.doi.org/10.1039/b708292d LCAHAM 1473-0189 Google Scholar
A. Ishimaru, Electromagnetic Wave Propagation, Radiation, and Scattering, 1st ed.Prentice Hall, Englewood Cliffs
(1991). Google Scholar
|


