
|
|
1.IntroductionBioluminescence imaging (BLI) has been widely used for in vivo tracking of transplanted stem cells, including hematopoietic,1 embryonic,2 mesenchymal,3 and neural stem cells.4,5 Introduced expression of luciferase enables researchers to observe luminescence upon injection of its substrates and therefore to monitor the survival, migration, or differentiation of stem cells over time with high sensitivity. Two major directions of improvements have been pursued for optimization of luciferase genes for in vivo imaging. One is the optimization of expression in mammalian cells. Since the first report of the firefly luciferase cDNA sequence,6 the gene reporter has undergone several important modifications to optimize its expression in mammalian cells, including optimized mammalian codon usage, removal of peroxisome targeting sites, cryptic regulatory sequence removal, and degradation signal addition.7 A commercially available optimized firefly luciferase (luc2) is the latest version of such an effort, which is now prevalently used for tracking transplanted cells.8,9 The second improvement is the development of a BLI reporter that is shifted toward the red-shifted spectrum, avoiding blood hemoglobin and myoglobin that represent the main endogenous absorbers of BLI signal in vivo. Absorption of blue and green light is very efficient, but it is considerably less so at wavelengths above 600 nm.10 As such, the development of red-shifted luciferase for BLI has been intensively pursued over recent years. For instance, amino acid substitutions are made so that the wavelength of emission is shifted toward the red region of the visible spectrum.1112.–13 Undoubtedly, for in vivo imaging of stem cells, the availability of a reliable red-shifted luciferase could make the luminescent signal more reproducible between in vitro and in vivo data, reduce the variation of signal from different depths and locations, and render the bioluminescent signal a more accurate and reliable reflection of cell numbers or status. Taking advantage of a recent report on a mutant of firefly luciferase (Ppy RE9, PRE9) developed by Branchini et al.,13 we aimed to investigate its properties in C17.2 mouse neural stem cells (NSC) and compare its sensitivity and stability with luc2. In vitro and in vivo experiments in this study composed a comprehensive comparison of the two luciferases in terms of sensitivity, reliability, and stability at different conditions. We believe it will help researchers intending to use bioluminescence as readouts to take into account all possible aspects involved in the analysis of signal output of bioluminescence. 2.Materials and Methods2.1.Preparation of DNA Constructs and Lentiviral VectorsThe luciferase mutant Ppy RE9 (GenBank accession numbers GQ404466) in pGEX-6P-2 (kindly provided by Branchini) was cloned into the lentivector FM-1,14 which was verified by sequencing. FM-1 is a modified version of FUGW, a promoter for human ubiquitin that is used to drive the expression of the gene of interest), without a drug resistant cassette for mammalian cell selection. The firefly luciferase from pgl4-luc2 (Promega) was also cloned into the FM-1 vector, with the resulting expression vector verified by sequencing. Lentivirus was produced by co-transfecting the expression vector containing the gene of interest, the VSVG envelope glycoprotein (MD2G), and the packaging vector PAX2 at a ratio of into 293FT cells (Invitrogen) using lipofectamine 2000 (Invitrogen). Virus supernatant was concentrated by ultrafiltration using Centricon Plus-70 filter units (Millipore). 2.2.Culture and Labeling of C17.2 NSCsC17.2 NSCs stably expressing LacZ (courtesy of Evan Y. Snyder) were grown in Dulbecco’s modified Eagle’s medium (DMEM) supplemented with 10% fetal bovine serum (Gibco), 5% horse serum (Gibco), 2 mM L-glutamine (Gibco), 1% penicillin/streptomycin (Sigma), at 37°C in a humidified 5% atmosphere. For transfection, cells cells were incubated in 24-well plates with lentiviral particles and Polybrene (Sigma). The medium was changed the next day. Cells were expanded to flasks and then sorted according to the expression level of fluorescent protein using flow cytometry. 2.3.Flow Cytometry and Western BlottingTo minimize experimental variability and loss of cell viability, all experiments were performed on C17.2 cell suspensions harvested shortly before analysis and sorting on flow cytometry, which was performed using an FACSAria cell sorter (Becton Dickinson). Cells were pelleted, resuspended in PBS at a concentration of , and kept on ice. Naive, non-fluorescent cells were used as controls. A minimum of 10,000 events were counted for each analysis. In cell-sorting experiments, each cell population underwent two consecutive rounds of purification (double sorting), achieving a final average purity of . Cell lysates from PRE9 and luc2 expressing C17.2 cells were analyzed by western blot. The protein lysates were run with SDS-PAGE under reducing conditions and transferred to a nitrocellulose membrane probed with a dilution of polyclonal antibody anti-luciferase (Promega) diluted in 5% nonfat milk. Reactions were detected with a secondary antibody conjugated to horseradish peroxide (Bio-Rad) by means of enhanced chemiluminescence (Vector Labs). Image J was used to quantify the protein expression level by measuring band density and thickness. The densitometry value for Luc2 or PRE9 was normalized by the value of -actin to generate the relative protein density. 2.4.Cell TransplantationAll animal procedures were approved and conducted in accordance with our institutional guidelines for the care of laboratory animals. Immunodeficient Rag2-/- mice (, 8 to 12 weeks old, Taconic) were anesthetized with 2% isoflurane, shaved, and placed in a stereotaxic device (Stoelting). The cells expressing different luciferases were harvested, washed, and suspended in phosphate-buffered saline (PBS) with calcium and magnesium at a density of . Then, 3 μl cell suspension was injected into the right striatum (; ; ) at a rate of using a Hamilton 31G microinjection needle (Hamilton). The needle was withdrawn slowly after the injection was complete. 2.5.BLI of Cultured Cells and MiceBLI was performed using an IVIS 200 (Caliper Life Sciences) optical imaging device equipped with a high-sensitivity, cryogenically-cooled, charge-coupled device detection system. For BLI of living cells, an identical number of cells (, , and in 100 μl culture medium) from the two groups was pipetted in 96 well plates (in triplicates). Accurate cell counts were made using a cell counting kit (cck8, Dojindo). Two to three hours later, the medium was replaced by PBS (with calcium and magnesium) containing luciferin, and the luminescence was collected at various time points. The photon signal was integrated over one second. For BLI of mice (), imaging was performed one day after cell transplantation. Before imaging, each mouse was intraperitoneally injected with of luciferin (Caliper Life Sciences) to detect firefly luciferase activity. Mice were anesthetized with 12% isoflurane and imaged at 10, 15, and 20 min after luciferin injection with 1-min exposure time. Peak emission values through the observation window were used for quantification. Images were acquired and processed using LIVINGIMAGE® software (version 2.50) (Caliper Life Sciences). For quantification, the photon signal expressed as total flux () was measured from a region of interest, which was kept constant in area and positioning for all experiments. For spectral imaging, filter sets ranging from 500 to 720 nm were used with a 1-s period for each filter. 3.Results3.1.Expression of PRE9 and Luc2 in C17.2 Cells and Normalization of Expression LevelsTwo versions of luciferase, PRE9 and luc2, were cloned into FM-1 lentivectors, in which a constitutive promoter (the human ubiquitin C promoter) is used to drive the bicistronic expression of luciferase and Venus separated by an internal ribosome entry site (IRES). The virus was packaged and used to infect C17.2 NSCs [Fig. 1(a)]. We first confirmed the successful expression of both constructs. Cells in both groups displayed a normal morphology with cytoplasmic and nuclear Venus expression [Figs. 1(b) and 1(c)]. Luciferase expression was confirmed by adding luciferin to cell cultures, followed by BLI (data not shown). No significant difference was found between the doubling time () of transduced C17.2 cells and non-transduced cells (data not shown). Since the expression level of target genes usually varies due to vector insertion sites and multiple transfections, cells were sorted according to the expression level of Venus in PRE9 and luc2 expressing cells using flow cytometry. Sorted cells showed near-identical levels of fluorescence (mean fluorescent intensity of 639.2 and 663.6 for PRE9 and luc2, respectively), indicating a comparable expression of the amount of gene construct [see Fig. 1(d)]. To verify the flow cytometry results, a western blot of cell lysates with anti-luciferase and anti-green fluorescent protein (GFP) antibodies was performed [see Fig. 1(e)]. While Venus levels were identical in both groups, the luciferase level in luc2 expressing cells was only about 60% of that in PRE9 expressing cells [Fig. 1(f)]. The two populations of cells expressing Luc2 or PRE9 after flow cytometry cell-sorting were used for further analysis in the following studies. Fig. 1Expression of the two luciferase variants in C17.2 cells. (a) Diagram of lentiviral vector used in this study to express PRE9 or luc2 with Venus as an additional reporter gene. (b, c) Expression of Venus in C17.2 cells transduced by FM-PRE9 (b) and FM-luc2 (c). . (d) Flow cytometry diagram for sorted cells, with a median fluorescent intensity for PRE9 and luc2 expressing cells of 639.2 and 663.6, respectively. The contour histogram of untransfected cells is in blue. (e) Western blot of cell lysates from sorted PRE9 and luc2 expressing cells. (f) Quantification of western blot. Results are expressed as the ratio of luc2 to PRE9 protein density with -actin expression as an internal reference.  3.2.PRE9 versus Luc2 in Vitro Bioluminescence StudiesThe magnitude and spectral dependence of BLI signal was measured for live NSCs. PRE9- and luc2-expressing cells were analyzed for total light output at different cell densities and time points after luciferin addition. Since phenol red present in a culture medium absorbs blue and green light and was found to interfere with the luc2 emission spectrum (data not shown), the culture medium was temporarily replaced with 10 mM PBS, , supplemented with luciferin. We found that the BLI signal for both groups reached a plateau stage at 5 min after the addition of luciferin, followed by a relatively stable phase lasting around 30 min and a gradual increase phase afterward [Fig. 2(a)]. Despite some fluctuations, the signal gradually increased over time, with PRE9 being a stable reporter similar to luc2. The variation in stability of PRE9 enzyme activity was between measurements at 10 and 30 min, following the addition of luciferin (), which is the relevant time span for in vivo transplantation studies. Fig. 2BLI signal intensity of PRE9- (solid lines, left -axis) and luc2 (dashed lines, right axis) expressing cells in culture. (a) Time course of a bioluminescent signal in living cells after the addition of luciferin () in PBS (). Left axis was for PRE9 cells. Right axis was for luc2 cells. (b) Comparison of the magnitude of luminescence from a different density of cells in 96 well plates, 10 min after the addition of luciferin () in PBS (). (c) Quantitative analysis of luminescence from PRE9 and luc2 cells, showing the fold of increase of light output from luc2 cells compared to PRE9 cells. 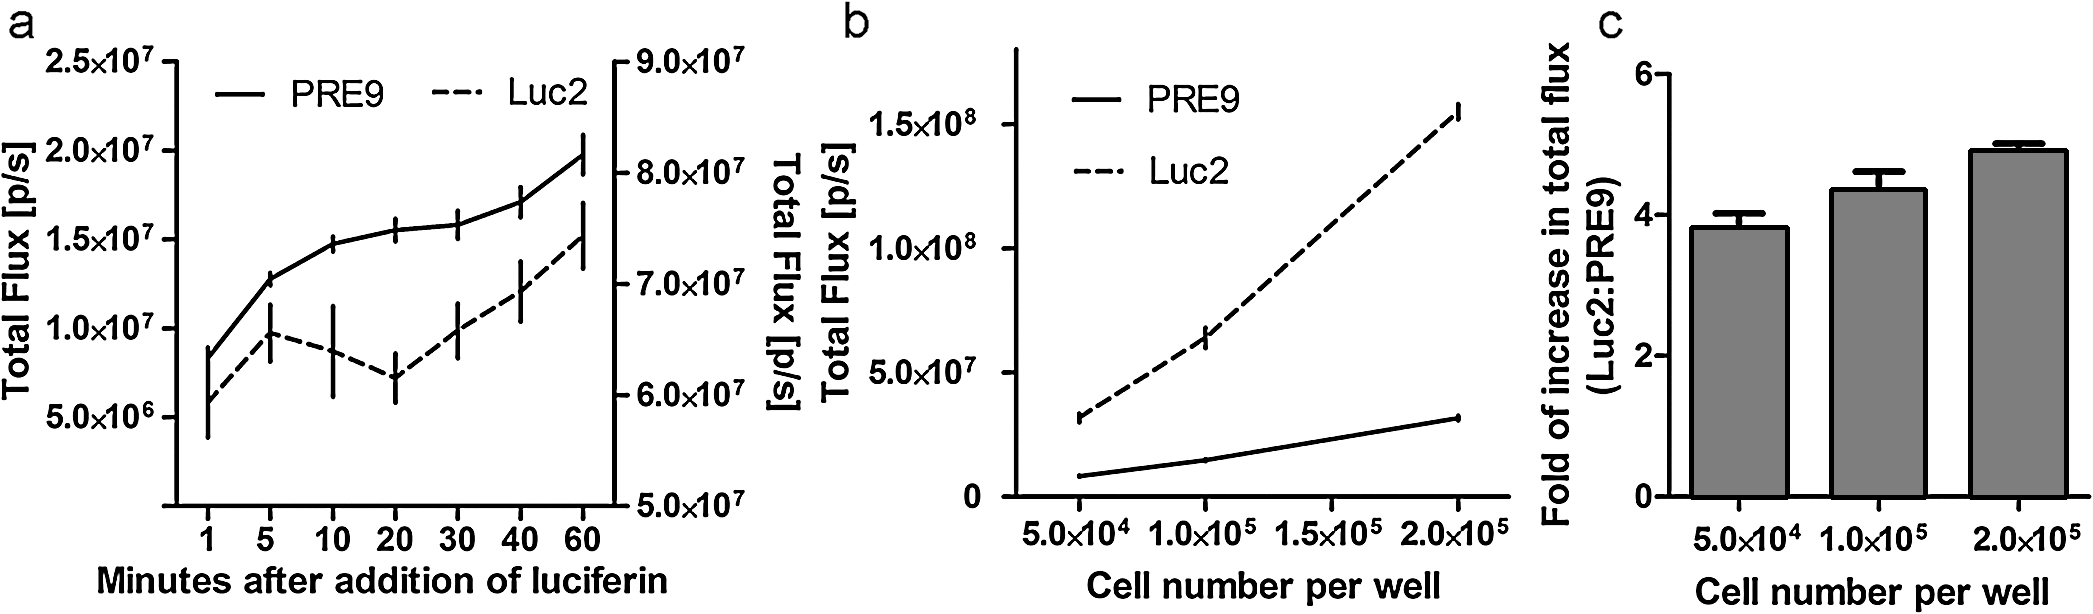 According to the time course of radiance, we chose a time point of 10 min to further compare the activity of PRE9- versus luc2-expressing cells. A dilution series was assayed in triplicate, and we found that the total flux from the cells was directly proportional to the number of viable cells [, Fig. 2(b)]. For each cell density, the luc2 light output was higher than that of PRE9. Interestingly, higher cell densities resulted in a relative higher amount of bioluminescent signal for luc2 as compared to PRE9 [Fig. 2(c)]. The emission spectrum of luc2- and PRE9-expressing cells was measured at 35°C in 10 mM PBS, . Peak emission of luc2 was broadly located between 580 and 600 nm. In contrast to the broad peak emission of luc2 between 580 and 600 nm, PRE9 exhibited a narrow emission with a steep slope [Fig. 3(a)], indicative of its red-shifted emission spectrum. Fig. 3In vitro emission spectrum of PRE9- and luc2-transduced cells. (a) Spectrum of luc2 and PRE9 cells in PBS, . (b, c) pH dependence of spectrum for luc2 (b) and (c) PRE9 cells. For both groups, measurements were obtained 10 min after the addition of luciferin ().  We then analyzed the effects of pH on the emission spectrum of the two luciferase enzymes. The culture medium of transduced C17.2 cells was replaced with 10 mM PBS, , 6.6, 7.0, 7.4, 7.8, or 8.2. The luminescence spectrum was acquired from 500 to 720 nm, 10 min after the addition of 100 μl luciferin () at 35°C. The spectrum of luc2-expressing cells was shifted toward the red from around 580 nm at to around 620 nm at [Fig. 3(b)]. In contrast, the peak emission of PRE9-expressing cells at 620 nm did not change throughout the entire pH range studied [Fig. 3(c)]. The overall emission spectrum curve remained stable, with only a small variation at the lower wavelengths. 3.3.PRE9 versus Luc2 in Vivo Bioluminescence StudiesC17.2 cell is a well-characterized murine immortalized neural stem cell line that can self-renew, differentiate into all neural lineages, and populate developing or degenerating regions of the central nervous system (CNS).15,16 It therefore is a widely used source of cell grafts in rodent models of CNS trauma and neurodegenerative diseases.8,17 C17.2 cells engineered to stably express PRE9 or luc2 were transplanted into the mouse striatum. BLI was then performed to compare light output from the two groups. Luc2-expressing cells were found to emit significantly more photons [Fig. 4(a)]. Quantification revealed a 2.26-fold increase in total flux for luc2 as compared to PRE9 [Fig. 4(b)]. The luminescent signal from the two groups of mice was monitored for more than two months, and no signs of changes in optical properties in either luc2 or PRE9 could be observed (data not shown). Fig. 4In vivo imaging of transplanted PRE9 and luc2 cells. (a) BLI of cells transplanted in the striatum. Green circles: ROIs for mice () injected with luc2 cells; red circles: ROIs for mice () injected with PRE9-cells. (b) Quantitative analysis of total flux for each ROI, showing a significant difference between the two groups (). 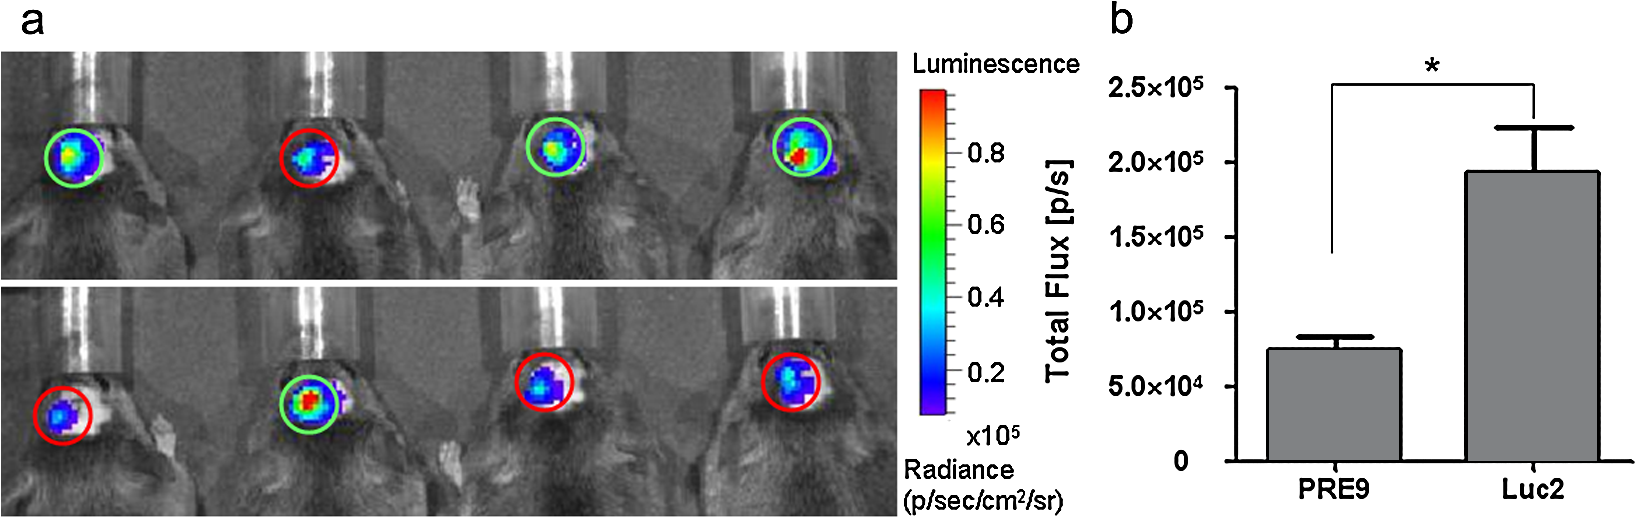 We then compared the photon emission magnitude for both variants of luciferase under in vitro or in vivo conditions. For in vitro study, the total light output of luc2 was -fold that of PRE9 [for , Fig. 5(a)]. In vivo, however, the amount of increase of luc2 over PRE9 was lowered to [Fig. 5(a)]. This result implies that the relative increase in sensitivity of luc2 was hindered by in vivo attenuation of signal. This finding was further confirmed by comparing the emission spectrum of luc2 and PRE9 in vitro and in vivo. For PRE9, the spectrum was unchanged between the in vitro and in vivo conditions [Fig. 5(b)]; in contrast, the emission spectrum of luc2 was greatly reduced in vivo [Fig. 5(c)], displaying a similar curve as that of PRE9 in vivo [Fig. 5(d)]. Thus, given that the emission spectrum for in vitro and in vivo conditions was nearly identical, signal quantification in vivo is more robust for PRE9. Fig. 5Head-to-head comparison of in vitro and in vivo data. (a) Luc2:PRE9 ratio of in vitro and in vivo photon radiance ( cells each). (b) Emission spectrum for PRE9 cells (in vitro: solid lines, in vivo:dashed lines, ). (c) Emission spectrum for luc2 cells (in vitro: solid lines, in vivo:dashed lines, ). (d) In vivo comparison of PRE9 (solid lines) and luc2 (dashed lines) emission spectrum. 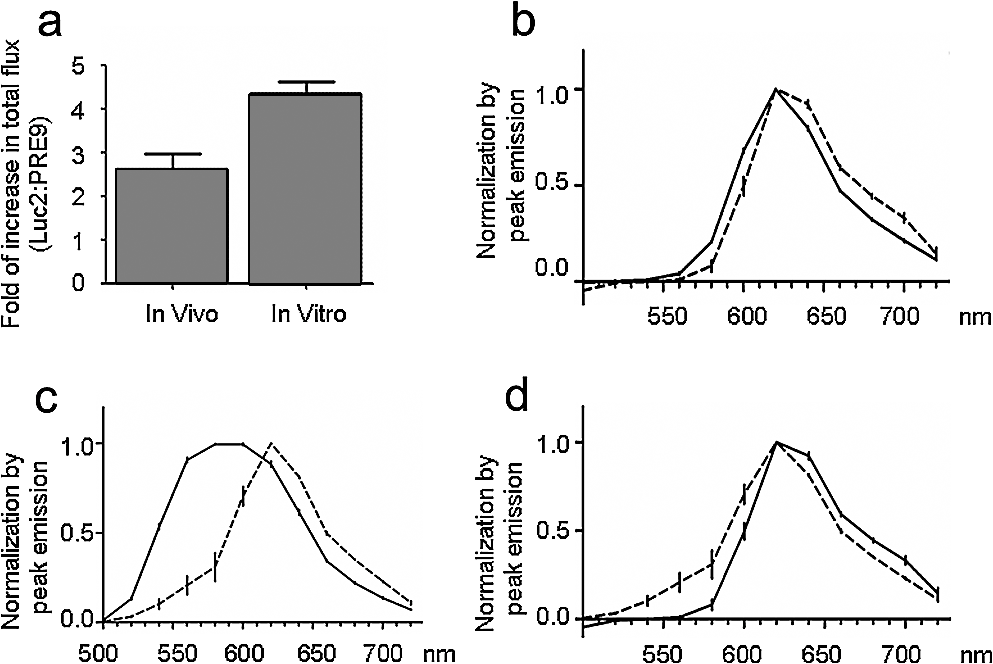 4.DiscussionC17.2 is multipotent neural precursor cell line that has been widely used as a neural stem cell source to evaluate cell-based therapeutic strategies for CNS disorders.18 To monitor the survival and migration of implanted stem cells, it is often preferable to transduce them with reporter genes, such as luciferase, to make them visible under in vivo imaging paradigms. In our study, we compared a new version of luciferease mutant, PRE9, with commonly used luc2 by introducing them into C17.2 cells and evaluated the luminescence intensity and spectra of resultant cell lines under in vitro and in vivo conditions. For any convincing comparative analysis, it is critical to use cells expressing equimolar amounts of the two luciferase proteins. However, luciferases from different species of insects are usually expressed at different levels in mammalian cells. Even when using the same vector, the codon-optimized or structure-optimized luciferases can be expressed at different levels (commonly higher for luc2) as compared to non-optimized transgenes.19 In the past, this has complicated a direct comparison of light output for luciferases derived from different insect species, such as renilla, click beetles, and fireflies. Zhao et al. inserted different luciferases into the same expression vector (pcDNA3.0) for transduction of mammalian cells.20 Although they thoroughly compared emission spectra and used an in vivo cell transplantation model to analyze the tissue absorbance of emission from those luciferases, it is uncertain if the luciferase expression levels were the same. To address this problem, Miloud et al. used “self-cleaving” 2A sequences from viruses to achieve a stoichiometric co-expression of luciferase and fluorescent protein.21 An alternative strategy is to build a bicistronic construct with the IRES located in between luciferase and GFP. Separate expression of each cDNA will ensure that the individual genes of luciferase or GFP are minimally affected. Although a gene transcribed upstream of IRES can be translated at a much higher level than the downstream gene,22 there was evidence that the ratio of translation between each gene remained pretty much stable.23,24 The bicistronic FM-1 lentivector in our study enables the independent expression of the BLI gene in conjunction with the fluorescent probe Venus, a variant of GFP. 14 The bicistronic nature of this lentivector also allows standardization of the luciferase expression levels. We took advantage of this lentivector and sorted out transduced C17.2 cells with a similar expression level of Venus from each group. Western blot data verified our successful cell-sorting since Venus protein level in the two groups was the same. However, we did not observe an identical luciferase protein level in the two groups of cells. Since Venus and luciferase genes were in the same transcript, the transcription of the luciferase gene should be the same in luc2 and PRE9 expressing cells. We suspected post-transcriptional regulation, protein translation, or post-translational events may be responsible for this discrepancy. PRE9 is a novel red-emitting mutant of luciferase that has been codon-optimized for mammalian cell expression.13 A comparison between PRE9 and Promega’s commercially available codon-optimized click beetle red (CBR) luciferase, avoiding the overall tissue absorbance by having a spectrum peak at 618 nm, revealed that the integrated activity of CBR was approximately two-fold lower than that of PRE9 when an equal amount of purified luciferases was measured using saturating levels of LH2 and Mg-ATP. Even the same vector pGEX-6P-2, CBR was expressed at a lower level than PRE9, resulting in a 50-to 100-fold smaller integrated light intensity as compared to PRE9, as calculated using the relative bioluminescence of soluble cell lysates from equivalent numbers of HEK293 cells expressing both genes.13 Those experiments suggest that PRE9 is superior over CBR as a bioluminescent reporter for in vivo imaging. Nevertheless, CBR has still been reported to be a suitable red light-emitting BLI reporter.25 To further test the potential advantage of PRE9 as a BLI reporter gene, we compared it with luc2, a recently developed synthetic firefly luciferase gene.19 The luminescence from PRE9 was found to be as stable as luc2, starting at 1 min after the addition of the luciferin substrate, reaching a plateau at 5 min with a continuous increase over a period of 60 min. The intensity curve of luc2 expressing cells did not differ much from that of PRE9 expressing cells, indicating that the superior thermostability of PRE9 at 37°C makes it suitable as a reporter for in vivo imaging. However, the luminescence intensity of PRE9-expressing cells was four- to five-fold lower than luc2-expressing cells, depending on the cell numbers in each assay, with more light output of luc2 over PRE9 for higher numbers of cells. The overall low yield of light may be explained by the compromised specific activity of PRE9 compared to its unmodified template Ppy RE-TS. To develop thermostable Luc mutants with spectral emissions maximally shifted to red, mutations were induced into Ppy RE-TS for screening of mutants with better properties. PRE9 was found to be the best variant, with a red-shifted spectrum (from 610 to 617 nm) exhibiting a robust thermostability, albeit with a 71% reduced relative specific activity.13 Historically, the development of Ppy RE-TS as a thermostable red-emitting mutant of fLuc was also accompanied by a reduction in specific activity (15% of wild-type luciferase, as observed in pure protein assays.12 A recently study comparing Ppy RE-TS to wild-type Ppy luciferase expressed in human hepatoblastoma (HepG2) and acute monocytic leukemia (Thp1) cell lines reported a lower emission intensity of Ppy RE-TS relative to wild-type luciferase, with the reduction in BLI signal being dependent on the cell line, i.e., two-fold for HepG2 and 33-fold for Thp1.26 Thus, it appears that each round of mutation toward creating a maximal red spectrum is associated with a drop in relative specific activity, resulting in red-shifted but less bright versions of luciferase. Our 620-nm emission peak for PRE9 is consistent with that of 617 nm reported by Branchini et al. while luc2 exhibited a broad spectrum peaking at 580 to 590 nm. We tested the sensitivity of PRE9 and luc2 to pH changes by incubating cells in buffers with different pH values. Unlike luc2, the emission curve of PRE9 was pH-independent. Although PRE9 had not been tested for pH sensitivity before, its precursor Ppy RE-TS did show the same result.12 The spectrum of the railroad worm and click beetle enzymes is also not pH-dependent and persists in mutants of these enzymes.27 This property of PRE9 is of particular importance for in vivo cell tracking. The local host environment may undergo substantial changes in pH in certain conditions, such as a tumor,28 rendering the collected luminescent signal an inaccurate reflection of the actual cell number in the graft. The emission spectrum of PRE9 would provide a more stable luminescent signal and thus render a more accurate estimation of the number of viable cells. The in vivo properties of the two luciferases were evaluated following stereotaxic injection of the same number of PRE9-and luc2-expressing C17.2 cells into mouse brain striatum. Since cells were normalized for expression of the Venus fluorescent tag, they expressed a comparable level of luciferase, making a direct comparison possible. One day after transplantation, the BLI signal produced by the red-emitting cells was around 2.5-fold lower than that from luc2-expressing cells. This is in contrast to the 4.5-fold difference from the in vitro culture studies and can be explained by analyzing the shape of the emission spectra. While it was similar for both the in vitro and in vivo experiments for PRE9, a significant in vivo tissue absorbance was observed for luc2. The consistent emission spectrum of PRE9 under in vitro and in vivo conditions makes it an ideal reporter gene for the quantification of living cells in vivo. Zhao et al. compared the relative in vitro signal intensity for different luciferase genes (fLuc, CBGr68, CBR, and hRLuc) when they are expressed in C6 cells,20 but the expression levels were not normalized. Miloud and colleagues made a more accurate comparison of relative activity of luciferases by using a 2A sequence and reported that the relative signal intensity ratio of CBG99 to CBR and fLuc was 4- and 1.5-fold, respectively.21 For those comparisons, the luciferase gene was from pGL3 as the previous generation for luc2. Since luc2 is emitting at a 4-to 11-fold higher rate than fLuc in several cell lines,19 all these luciferases are theoretically inferior to luc2. Taken together, it is clear that luc2 is currently the most sensitive BLI reporter. In this respect, a recent study using luc2 reported light emission in the range of up to , enabling high-sensitivity imaging of transplanted cells.9 5.ConclusionAfter comparing the in vitro and in vivo BLI properties of luc2 and the red-emitting mutant PRE9 from the same species, we conclude that each luciferase has its own advantage and disadvantage. While luc2 still remains unrivaled in terms of the intensity of light emission, PRE9 produces a narrower BLI signal, making it a more reliable candidate for in vivo signal quantification without unwanted tissue absorbance. Further studies are warranted toward creating luciferase mutants having a high enzymatic activity in the red-emitting spectrum in order to reliably quantify the survival and expansion of transplanted stem cells. AcknowledgmentsWe thank Dr. Bruce Branchini for providing the PRE9 cDNA and Dr. Jeff Milbrandt for providing the lentivector (FM-1). We are also grateful to Mary McAllister for editorial assistance. This work was supported by 2RO1 NS045062 and MSCRFII-0193. ReferencesY. LinJ. MolterZ. LeeS. L. Gerson,
“Bioluminescence imaging of hematopoietic stem cell repopulation in murine models,”
Methods Mol. Biol., 430 295
–306
(2008). http://dx.doi.org/10.1007/978-1-60327-475-3 MMBYBO 0097-0816 Google Scholar
K. D. WilsonM. HuangJ. C. Wu,
“Bioluminescence reporter gene imaging of human embryonic stem cell survival, proliferation, and fate,”
Methods Mol. Biol., 574 87
–103
(2009). http://dx.doi.org/10.1007/978-1-60327-321-3_8 MMBYBO 0097-0816 Google Scholar
Z. Loveet al.,
“Imaging of mesenchymal stem cell transplant by bioluminescence and PET,”
J. Nucl. Med., 48
(12), 2011
–2020
(2007). http://dx.doi.org/10.2967/jnumed.107.043166 JNMEAQ 0161-5505 Google Scholar
F. Sheret al.,
“Bioluminescence imaging of Olig2-neural stem cells reveals improved engraftment in a demyelination mouse model,”
Stem Cells, 27
(7), 1582
–1591
(2009). http://dx.doi.org/10.1002/stem.v27:7 1066-5099 Google Scholar
S. C. Bermanet al.,
“Long-term MR cell tracking of neural stem cells grafted in immunocompetent versus immunodeficient mice reveals distinct differences in contrast between live and dead cells,”
Magn. Reson. Med., 65
(2), 564
–574
(2011). http://dx.doi.org/10.1002/mrm.22613 MRMEEN 0740-3194 Google Scholar
J. R. de WetK. V. WoodD. R. HelinskiM. DeLuca,
“Cloning of firefly luciferase cDNA and the expression of active luciferase in Escherichia coli,”
Proc. Natl. Acad. Sci. U. S. A., 82
(23), 7870
–7873
(1985). PNASA6 0027-8424 Google Scholar
B. A. SherfK. V. Wood,
“Firefly luciferase engineered for improved genetic reporting,”
Promega Notes Magazine, 49 14
(1994). Google Scholar
D. E. Kimet al.,
“Imaging of stem cell recruitment to ischemic infarcts in a murine model,”
Stroke, 35
(4), 952
–957
(2004). http://dx.doi.org/10.1161/01.STR.0000120308.21946.5D SJCCA7 0039-2499 Google Scholar
J. B. Kimet al.,
“Non-invasive detection of a small number of bioluminescent cancer cells in vivo,”
PLoS ONE, 5
(2), e9364
(2010). http://dx.doi.org/10.1371/journal.pone.0009364 1932-6203 Google Scholar
B. W. RiceM. D. CableM. B. Nelson,
“In vivo imaging of light-emitting probes,”
J. Biomed. Opt., 6
(4), 432
–440
(2001). http://dx.doi.org/10.1117/1.1413210 JBOPFO 1083-3668 Google Scholar
B. R. Branchiniet al.,
“Red- and green-emitting firefly luciferase mutants for bioluminescent reporter applications,”
Anal. Biochem., 345
(1), 140
–148
(2005). http://dx.doi.org/10.1016/j.ab.2005.07.015 ANBCA2 0003-2697 Google Scholar
B. R. Branchiniet al.,
“Thermostable red and green light-producing firefly luciferase mutants for bioluminescent reporter applications,”
Anal. Biochem., 361
(2), 253
–262
(2007). http://dx.doi.org/10.1016/j.ab.2006.10.043 ANBCA2 0003-2697 Google Scholar
B. R. Branchiniet al.,
“Red-emitting luciferases for bioluminescence reporter and imaging applications,”
Anal. Biochem., 396
(2), 290
–297
(2010). http://dx.doi.org/10.1016/j.ab.2009.09.009 ANBCA2 0003-2697 Google Scholar
T. ArakiY. SasakiJ. Milbrandt,
“Increased nuclear NAD biosynthesis and SIRT1 activation prevent axonal degeneration,”
Science, 305
(5686), 1010
–1013
(2004). http://dx.doi.org/10.1126/science.1098014 SCIEAS 0036-8075 Google Scholar
E. Y. Snyderet al.,
“Multipotent neural cell lines can engraft and participate in development of mouse cerebellum,”
Cell, 68
(1), 33
–51
(1992). http://dx.doi.org/10.1016/0092-8674(92)90204-P CELLB5 0092-8674 Google Scholar
B. D. YandavaL. L. BillinghurstE. Y. Snyder,
“‘Global’ cell replacement is feasible via neural stem cell transplantation: evidence from the dysmyelinated shiverer mouse brain,”
Proc. Natl. Acad. Sci. U. S. A., 96
(12), 7029
–7034
(1999). http://dx.doi.org/10.1073/pnas.96.12.7029 PNASA6 0027-8424 Google Scholar
M. Y. Ryuet al.,
“Brain transplantation of neural stem cells cotransduced with tyrosine hydroxylase and GTP cyclohydrolase 1 in Parkinsonian rats,”
Cell Transplant., 14
(4), 193
–202
(2005). http://dx.doi.org/10.3727/000000005783983133 CTRAE8 0963-6897 Google Scholar
P. Walczaket al.,
“Applicability and limitations of MR tracking of neural stem cells with asymmetric cell division and rapid turnover: the case of the shiverer dysmyelinated mouse brain,”
Magn. Reson. Med., 58
(2), 261
–269
(2007). http://dx.doi.org/10.1002/(ISSN)1522-2594 MRMEEN 0740-3194 Google Scholar
Promega, pGL4 Luciferase Reporter Vectors, Promega Corporation, Madison, Wis.
(2007). Google Scholar
H. Zhaoet al.,
“Emission spectra of bioluminescent reporters and interaction with mammalian tissue determine the sensitivity of detection in vivo,”
J. Biomed. Opt., 10
(4), 41210
(2005). http://dx.doi.org/10.1117/1.2032388 JBOPFO 1083-3668 Google Scholar
T. MiloudC. HenrichG. J. Hammerling,
“Quantitative comparison of click beetle and firefly luciferases for in vivo bioluminescence imaging,”
J. Biomed. Opt., 12
(5), 054018
(2007). http://dx.doi.org/10.1117/1.2800386 JBOPFO 1083-3668 Google Scholar
H. Mizuguchiet al.,
“IRES-dependent second gene expression is significantly lower than cap-dependent first gene expression in a bicistronic vector,”
Mol. Ther., 1
(4), 376
–382
(2000). http://dx.doi.org/10.1006/mthe.2000.0050 MTOHCK 1525-0016 Google Scholar
C. Allera-Moreauet al.,
“Long term expression of bicistronic vector driven by the FGF-1 IRES in mouse muscle,”
BMC Biotechnol., 7 74
(2007). http://dx.doi.org/10.1186/1472-6750-7-74 BBMIE6 1472-6750 Google Scholar
A. Delluc-Claviereset al.,
“Efficient gene transfer in skeletal muscle with AAV-derived bicistronic vector using the FGF-1 IRES,”
Gene Ther., 15
(15), 1090
–1098
(2008). http://dx.doi.org/10.1038/gt.2008.49 GETHEC 0969-7128 Google Scholar
H. Masudaet al.,
“Noninvasive and real-time assessment of reconstructed functional human endometrium in NOD/SCID/gamma c(null) immunodeficient mice,”
Proc. Natl. Acad. Sci. U. S. A., 104
(6), 1925
–1930
(2007). http://dx.doi.org/10.1073/pnas.0604310104 PNASA6 0027-8424 Google Scholar
L. Mezzanotteet al.,
“In vivo bioluminescence imaging of murine xenograft cancer models with a red-shifted thermostable luciferase,”
Mol. Imag. Biol., 12
(4), 406
–414
(2010). http://dx.doi.org/10.1007/s11307-009-0291-3 1536-1632 Google Scholar
Y. Nakajimaet al.,
“Improved expression of novel red- and green-emitting luciferases of Phrixothrix railroad worms in mammalian cells,”
Biosci. Biotechnol. Biochem., 68
(4), 948
–951
(2004). http://dx.doi.org/10.1271/bbb.68.948 BBBIEJ 0916-8451 Google Scholar
R. A. CardoneV. CasavolaS. J. Reshkin,
“The role of disturbed pH dynamics and the exchanger in metastasis,”
Nat. Rev. Cancer, 5
(10), 786
–795
(2005). http://dx.doi.org/10.1038/nrc1713 NRCAC4 1474-175X Google Scholar
|


