|
|
1.IntroductionSeptic reactions from bacterial contamination of blood products are considered to be one of the most frequent complications of blood transfusion.1,2 The U.S. Food and Drug Administration reported bacterial contamination as the third most frequent cause of death related to transfusion,3 and data compiled from 11 prospective studies showed that, on average, there is about one case of sepsis per 2695 units transfused.4 Such bacterial contamination may be caused by bacteremia (i.e., the presence of bacteria in donor’s blood), the introduction of contaminants such as skin commensals during donor venipuncture, or the incomplete disinfection of processing equipment, etc.5–7 One of the measures taken against this problem is to limit the shelf life of the blood supply. For example, in the U.S. the storage time of platelet (PLT) concentrates was reduced from seven to five days in 1986 due to a higher risk of bacterial sepsis with older units,8 and in Japan the retention period for red cell concentrations (RCC) was reduced from 42 days to 21 days in 1995. This reduction of storage life, though, may cause shortages in blood supply in countries such as Japan, where the population is aging.9,10 Therefore, a prolongation of the shelf life of blood components would become useful in maintaining a stable supply of transfusion blood. In some European countries bacterial screening tests are employed before transfusion to reduce the occurrence of bacterial sepsis.11–13 For instance, in one such bacteria-detecting system, a small amount of blood is drawn from the transfusion bag into a smaller pouch and incubated. Inside the pouch oxygen () consumption is monitored and used as a marker for bacterial contamination.11 This method requires the use of an additional sample pouch as a surrogate indicator for bacteria. This is an extra and inessential step as there is a method that enables the detection of bacteria directly from the transfusion bag. Besides level, glucose consumption is also found to increase in bacterially contaminated blood samples.14 For example, one study showed that the glucose level of RCC contaminated with Yersinia enterocolitica decreased by nearly (from to ) whereas that of a sterile sample decreased by around (from to ).15 This result suggests that the detection of glucose levels could serve as a useful indicator for bacterial contaminations in blood components. One of the most promising methods for the nondestructive measurement of blood glucose levels is near-infrared (NIR) spectroscopy because the NIR region contains the overtone and combination bands for glucose absorption.16,17 One important contributor in a successful component analysis using NIR spectroscopy is the selection of a suitable measurement system (e.g., transmittance or reflectance spectroscopy) and an optimal wavelength region. Previous studies that took measurements in biological components have utilized both shorter (800–1300 nm) and longer (1300–2500 nm) wavelengths in the NIR region.17 In general, the longer wavelength regions produced larger absorbance signals but resulted in shorter optical path lengths. In a study conducted by Heise, transmittance spectroscopy was used to measure glucose levels in human blood plasma.18 The results showed that measurements taken in the longer wavelength regions produced more accurate glucose quantification results than those taken in the shorter wavelength regions. Similar results were also obtained by Amerov et al. in a study that utilized diffuse-transmittance spectroscopy to detect glucose levels in whole blood samples.19 They tested wavelength regions in the NIR range between 1111 and 2500 nm and showed that the longer wavelength region from 2062 to 2381 nm generated a higher correlation between predicted and reference glucose levels than the shorter wavelength region from 1117 to 1370 nm (correlation coefficient ; standard error of prediction ). Furthermore, in a study by Kim and Yoon, which utilized the diffuse-transmittance method in the wavelength range of 1110 to 2400 nm, results also indicated that spectra taken in the long wavelength region between 1390 and 1888 nm and 2044 to 2392 nm produced the best prediction of glucose levels in whole blood (; ).20 In both Amerov et al. and Kim and Yoon’s studies of whole blood, the SEP of glucose was lower than , which suggests that NIR spectroscopy can be utilized to measure blood glucose levels. Moreover, since glucose concentrations in transfusion products are known to decrease from the normal level of around to less than when bacteria proliferate, NIR spectroscopy is a promising method to detect the presence of bacterial contamination in blood components. In contrast to studies that utilized diffuse-transmittance method, Maruo et al. used NIR diffuse-reflectance spectroscopy for the noninvasive measurement of blood glucose level in vivo.21 They suggested the diffuse-reflectance method yields larger absorbance signals than the diffuse-transmittance method because it can take changes in both glucose concentration and the scattering property of the body into account when forming the absorbance signals. Therefore, for materials with high scattering properties, such as the RBC components used in the present study, diffuse-reflectance may produce larger absorbance signals. Furthermore, unlike the diffuse-transmittance method, diffuse-reflectance measurements do not require the optical path length to be fixed, which would enable the measuring machine to have a simpler design. Since there has not been any published research on the measurement of glucose concentrations in whole-blood or RCC utilizing diffuse-reflectance spectroscopy, this paper attempts to serve as a preliminary study. In this study glucose concentrations in blood samples were predicted using NIR diffuse-reflectance spectroscopy in the 1350 to 1850 nm range. The effect of variations in hematocrit (Hct) level, temperature, and donor properties among the samples was also observed to test whether the present method could be used in real-life settings. From the results of the present study, the possibility of optical detection of glucose in RCC by NIR diffuse-reflectance spectroscopy can be evaluated. 2.Methods2.1.DeviceWe developed a diffuse-reflectance spectrometer to measure the NIR spectra of RBC samples. Figure 1 is a schematic diagram of the instrument. The instrument consisted of a 150-watt halogen lamp light source (Philips, TYPE 6550), an optical fiber bundle that included both detector and illuminator fibers (Fujikura, cladding diameter 200 μm, core diameter 175 μm, ), and mini spectrometer containing a grating and a 256-channel linear array photo detector (Hamamatsu Photonics K. K., C9914GB). The optical signal from the spectrometer was transferred to a computer (Panasonic, Let’s Note), where the optical signal was processed to predict the glucose concentrations. The detector and illuminator optical fibers were fixed at the measuring tip (see Fig. 1) of the optical fiber bundle. Figure 2 shows the geometry of the optical fibers at the measuring tip. The tip of the optical fiber was designed such that twelve illuminator fibers surrounded one central detector fiber in a circle. The distance between the detector fiber and each of the illuminator fibers was 650 μm. This design maintained a sufficient average NIR radiation path length and allowed the illuminator to emit high-intensity radiation. For spectral measurement, the measuring tip was directly submerged into the RCC. Inside the spectrometer, radiation from the halogen lamp was gathered through a concave mirror, transmitted through the illuminator fibers, and irradiated into the samples. Then, in the RCC the diffuse-reflected radiation was scattered many times in the turbid media, and only the radiation that reached the detector fiber was transmitted back to the spectrometer. Finally, the transmitted signal was sent to the computer, where the absorbance spectra were calculated. The reference spectra needed to form the absorbance spectra were taken by irradiating a standard 10% reflectance target (Labsphere) at the beginning of the experiment. Although this spectrometer is able to record measurements in wavelength regions between 1100 and 2200 nm, only spectral signals taken in the 1430 to 1850 nm range were used for glucose prediction. The accumulation time of each linear array photoreceptor was 50 ms, and 200 spectral data were averaged per measurement. The quality of the spectra was also assessed by taking a spectral measurement every 5 min for 120 min and then conducting a root-mean-square (rms) noise analysis of 100% lines on the collected data. Results showed that the average rms of 100% line of the wavelength region between 1430 and 1850 nm was 87.4 μAU, which we predicted to be sufficient for the purpose of the study. 2.2.Red Blood Cell SamplesThe RBC samples used for this experiment were prepared by the Japanese Red Cross Society (JRCS) using two packages of Red Cells Concentrates-Leukocytes Reduced “Nisseki” (RCC-LR) that did not qualify for transfusion after a blood test. The blood from the two packages was not mixed together in this experiment. To make the RBC sample, the disqualified RCC-LR was centrifuged to separate the RBC portion from the rest of the blood. A typical RCC-LR contains glucose concentrations up to and Hct values around 50 to 60%. The collected RBC portion was first adjusted into samples with Hct levels of 50 or 60% by diluting it with physiologic saline solution. Then, within each Hct group, the samples were further adjusted into samples with glucose concentrations of 0, 100, 200, 300, 400, 500, or . Because the Hct and glucose levels were hand-adjusted, it was likely for the actual Hct and glucose values to deviate from the ideal values. Therefore, the actual Hct and glucose levels were measured using an automated hematology analyzer (Sysmex, K-4500) and Glucose CII-test Wako (Wako Pure Chemicals, Osaka), respectively, and used in the data analysis. Since the measurements were taken from the supernatant of the samples, the effect of haemolysis on glucose measurement was considered negligible. After the RBC samples were separated into their respective Hct and glucose levels, 25 mL of each sample were transferred to a glass container, inside which the measurement took place. To create different temperature conditions, these containers were first placed in a 25 °C water bath and taken out at the time of measurement. Then, following the first round of measurements, they were transferred to a 27 °C water bath for the second round of measurements. All experimental steps, from preparation of the RBC samples to measurement of the spectra, were completed within one hour; hence, the properties of each sample were assumed to be constant throughout the experiment. Furthermore, the Hct levels and glucose concentrations were not correlated to each other (). Table 1 shows a summary of the experimental conditions and the measured Hct, temperature, and glucose values for each sample. RBC from Donor A was separated into four measurement conditions: 1. Hct 50% at 25 °C; 2. Hct 50% at 27 °C; 3. Hct 60% at 25 °C; and 4. Hct 60% at 27 °C, as shown in Table 1. RBC from Donor B was adjusted to two measurement conditions: 1. Hct 50% at 25 °C and 2. Hct 50% at 27 °C. Each measurement condition had RBC samples with seven glucose levels ranging from 0 to , making 42 independent blood samples in total. Three spectral measurements were taken for each sample, producing a total of 126 spectral readings available for analysis. Table 1Experimental conditions.
2.3.Prediction MethodPartial least squares (PLS) regression analysis was used to form calibration models for glucose quantification based on the measured data.22 Because the number of data points for each condition was limited, the cross validation method was utilized.23 Furthermore, the effect of multiplicative scatter correction (MSC) preprocessing method, which is known to reduce the scattering effect for quantitative prediction, was observed using the spectral data from each condition.24 3.Results and DiscussionFigure 3(a) shows all 126 spectra taken from samples in conditions 1 to 6. The unprocessed spectra showed multiplicative and additive variations due to different sample parameters in Hct level, temperature, and donor properties. Fig. 3Comparison between raw (unpreprocessed) and preprocessed absorbance spectra of all RBC samples (126 spectra): (a) raw, (b) preprocessed by MSC. 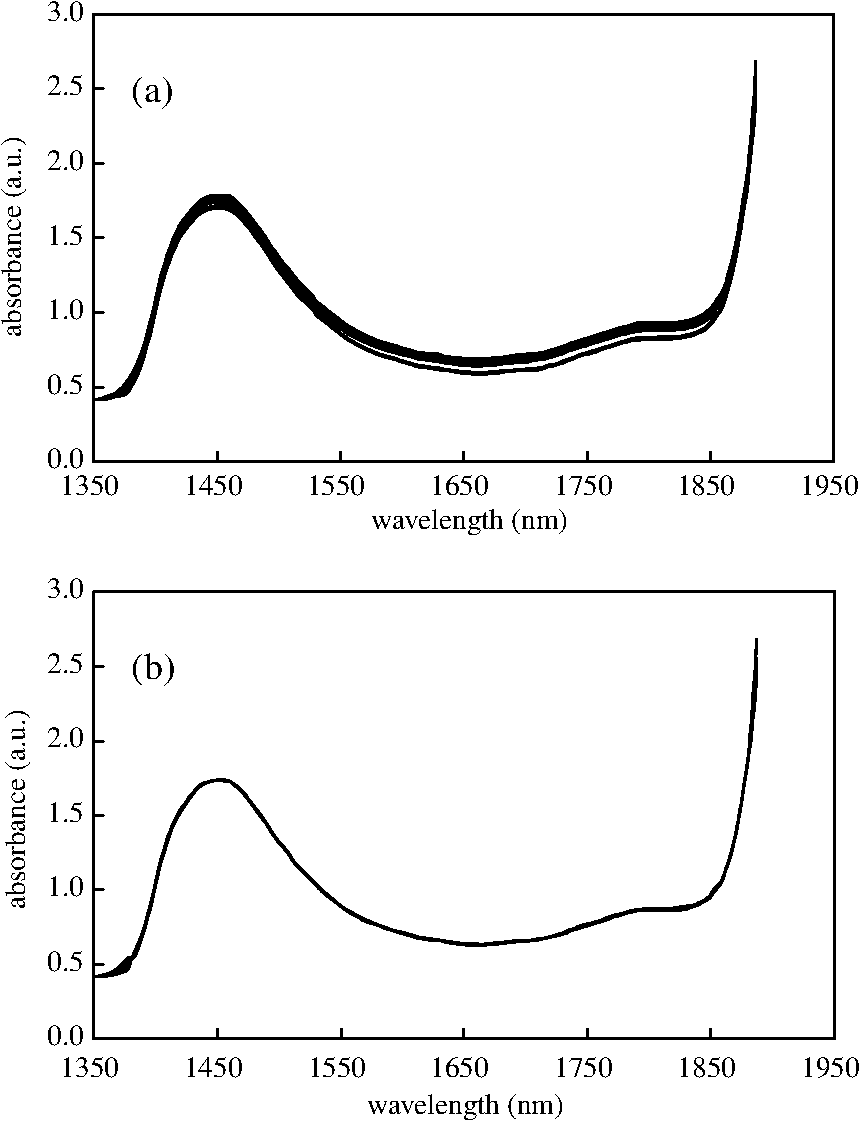 3.1.Glucose Sensing in Samples from the Same ConditionThe glucose concentration in each sample was estimated from all the spectral data taken from its respective condition. Table 2 summarizes the cross validation and calibration regression results of samples from conditions 1 to 6. Fairly robust correlations were obtained between predicted and measured glucose levels for all groups. The average correlation coefficient of cross validation (rCVal) was 0.994, and the standard error of cross validation (SECV) was . Moreover, the average correlation coefficient of calibration (rCal) was 0.998, and the standard error of calibration (SEC) was . The numbers of PLS factors used for all conditions, excluding condition 1, were four or five. Table 2Prediction of glucose concentrations in spectral region between 1430 and 1850 nm for RBC samples from conditions 1 to 6.
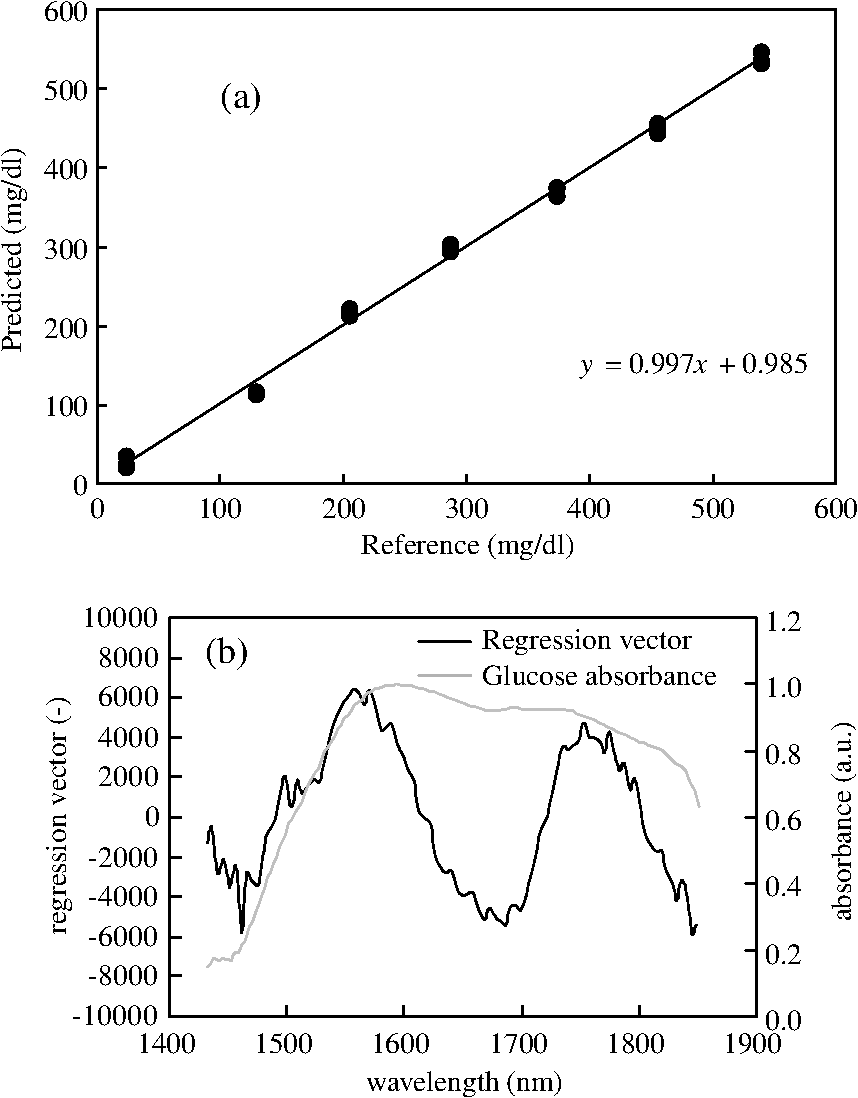
Our results showed improvement in prediction performances compared to previous studies on optical glucose sensing in blood. For example, Amerov et al. obtained rCVal of 0.980 and SECV of in the wavelength region between 1550 and 1754 nm in their research utilizing diffuse-transmittance spectroscopy.19 Compared to their study, the SECV was improved by around in the present study. Although different types of measurement systems were utilized, their study could serve as a basis of comparison for results from our study because similar experimental setups and a similar wavelength region were used. A closer look at the results from a single condition also shows that correlations obtained are fairly high. For example, Fig. 4(a) is a regression graph that illustrates the results obtained from samples in condition 4. The correlation was fairly high, with rCVal of 0.997 and SECV of . Furthermore, Fig. 4(b) is a regression vector obtained from the same set of samples. The vector had a positive peak around 1580 nm, which is near the peak absorbance spectra of glucose. In addition, Kim and Yoon also observed two positive peaks around 1580 nm and 1750 nm in their regression vector,20 which are similar to those seen in Fig. 4(b). These evidences support the validity of this calibration model. 3.2.Glucose Sensing in Samples from Different ConditionsSeveral datasets were constructed by pooling together spectral data from various conditions, as shown in Table 3. These calibration sets were then used to predict glucose levels to test whether a good calibration model could be constructed from data taken from samples with various conditions. The effects of donor, Hct, and temperature differences on glucose prediction were observed. Table 3Calibration models for glucose prediction in wavelength regions between 1430 and 1850 nm using datasets that consist of spectral data from different conditions.
In the first set, data that varied only in the original donor were combined (see Table 3 “donor difference”). The rCVal was 0.971, and the SECV was . For the second dataset, which includes samples with different Hct content (see Table 3 “hematocrit difference”), rCVal was 0.985 and SECV was . For the third dataset, which included spectral data taken at various temperatures (see Table 3 “temperature difference”), rCVal of 0.990 and SECV of were obtained. The last dataset consists of samples that differed in all parameters, including donor, Hct, and temperature (see Table 3 “donor, hematocrit, temperature difference”). Its rCVal was 0.969, and its SECV was . The dataset for “temperature difference” exhibited the highest correlation between the reference and predicted glucose concentrations, which is likely due to the fact that samples from this set had the same donor and Hct values and differed only in their measured temperatures. Because the scattering properties of samples with different temperatures were relatively constant, a better calibration model was achieved. In contrast, for datasets that contained samples with varying scattering properties due to Hct or donor differences, the accuracy of glucose prediction decreased. 3.3.Effects of MSC Preprocessing MethodSpectral data from samples in Tables 2 and 3 were preprocessed by MSC method. Tables 4 and 5 summarize the calibration models created from the MSC preprocessed data. The effect of MSC preprocessing can be seen by comparing Fig. 3(a), which displays all 126 raw spectra, with Fig. 3(b), which illustrates MSC preprocessed spectra from all 126 samples. It is evident that the multiplicative and additive variations in the raw spectra were compensated by the MSC preprocessing method. Table 4The effects of MSC preprocessing on the prediction of glucose concentration in a spectral region between 1430 and 1850 nm for RBC samples from conditions 1 to 6.
Table 5The effects of MSC data preprocessing on glucose prediction in wavelength regions between 1430 and 1830 nm.
Table 4 shows the prediction results using MSC preprocessed data from RBC samples in conditions 1 to 6. After MSC preprocessing, the rCVal and SECV averages for all six conditions were 0.992 and , respectively. Results show that the MSC preprocess did not improve the quantitative determination accuracy of the raw data (average raw ; ). These results are most likely due to the small differences in scattering properties between each raw sample, which minimize the effect of the MSC preprocess. The MSC preprocess was also performed on datasets that combined samples from various conditions (see Table 5). Glucose concentrations were then predicted using the processed data. The rCVal and SECV for the “donor difference” dataset was 0.982 and , respectively, an improvement compared to those of nonpreprocessed dataset, which had an SECV of . This improvement was probably due to the MSC preprocess’s effect, which diminishes the variation in scattering properties of the blood from different donors. The same effect was seen in the dataset for “hematocrit difference.” The MSC preprocessed rCVal of 0.993 and SECV of were better than the raw SECV of . In addition, in the dataset for “donor, hematcrit, temp difference,” the MSC preprocessed rCVal of 0.980 and SECV of were better than the raw rCVal of 0.969 and SECV of . Again, this effect was probably due to the decrease in scattering properties caused by Hct and donor differences following MSC preprocessing. Interestingly, the dataset for “temperature difference” did not seem to be affected by MSC preprocessing. The rCVal and SECV after MSC preprocessing were 0.989 and , respectively, whereas the rCVal and SECV for the unpreprocessed were 0.990 and , respectively. This is probably because this dataset contained samples that had the same donor and Hct level. The difference in measuring temperature alone did not cause variance in scattering property, which was significant enough for MSC preprocess to pose an effect. In the present study, the MSC-preprocess method was able to effectively reduce the scattering properties created by different blood properties. The same effect, though, could not be observed in Kim and Yoon’s study.20 One possible explanation for this discrepancy is that different optical measurement systems were used (i.e., diffuse-reflectance as opposed to diffuse-transmission spectroscopy). 4.SummaryIn the present study NIR diffuse-reflectance spectroscopy was used to measure the glucose concentrations in RBC samples. As we evaluated above, the glucose concentrations in RCC decrease from around down to less than when it is bacterially contaminated. Considering that the SECV obtained from even the most complex calibration set—which included samples that differed in donors, Hct levels, and temperatures—was , we can suggest that our method has the potential to detect bacterial contamination in RCC with sufficient quantitative determination accuracy. The present study was a preliminary study for the evaluation of the optical measurement of glucose in blood supplies as a method of bacterial detection. We showed that the diffuse-reflectance method has several advantages over alternative methods, including simpler instrumental structure and higher glucose-sensing accuracy. In addition, we determined that the MSC preprocessing method was effective in minimizing the variation in scattering properties created when samples with different properties are combined, thereby improving the prediction performance. In the future we plan to examine methods by which glucose concentrations can be measured directly through the RCC transfusion bags using NIR diffuse-reflectance spectroscopy. ReferencesB. B. Barrettet al.,
“Strategies for the avoidance of bacterial contamination of blood components,”
Transfusion, 33
(3), 228
–233
(1993). http://dx.doi.org/10.1046/j.1537-2995.1993.33393174449.x TRANAT 0041-1132 Google Scholar
M. E. BrecherS. N. Hay,
“Bacterial contamination of blood components,”
Clin. Microbiol. Rev., 18
(1), 195
–204
(2005). http://dx.doi.org/10.1128/CMR.18.1.195-204.2005 CMIREX 0893-8512 Google Scholar
“Fatalities reported to FDA following blood collection and transfusion: annual summary for fiscal year 2009,”
(2010) http://www.fda.gov/downloads/BiologicsBloodVaccines/SafetyAvailability/ReportaProblem/TransfusionDonationFatalities/UCM205620.pdf Google Scholar
A. V. McKaneet al.,
“Analysis of bacterial detection in whole blood-derived platelets by quantitative glucose testing at a university medical center,”
Am. J. Clin. Pathol., 131
(4), 542
–551
(2009). http://dx.doi.org/10.1309/AJCPVN9OT4GRCSKO AJCPAI 0002-9173 Google Scholar
T. GibsonW. Norris,
“Skin fragments removed by injection needles,”
Lancet, 2
(7054), 983
–985
(1958). http://dx.doi.org/10.1016/S0140-6736(59)91010-4 LANCAO 0140-6736 Google Scholar
K. Kojima,
“Subcutaneous fatty tissue can stray into a blood bag,”
Vox Sang., 74
(1),
(1998). VOSAAD 0042-9007 Google Scholar
C. Buchtaet al.,
“Skin plugs in phlebotomy puncture for blood donation,”
Wien Klin Wochenschr., 117
(4), 141
–144
(2005). http://dx.doi.org/10.1007/s00508-005-0310-6 0043-5325 Google Scholar
R. Yomtovian,
“Bacterial contamination of blood: lessons from the past and road map for the future,”
Transfusion, 44
(3), 450
–460
(2004). http://dx.doi.org/10.1111/trf.2004.44.issue-3 TRANAT 0041-1132 Google Scholar
A. Aliet al.,
“The aging population poses a global challenge for blood services,”
Transfusion, 50
(3), 584
–588
(2010). http://dx.doi.org/10.1111/j.1537-2995.2009.02490.x TRANAT 0041-1132 Google Scholar
M. A. VesgaM. Azkarate,
“Blood donors: red cells sufficiency,”
ISBT Sci. Ser., 6
(1), 193
–197
(2011). http://dx.doi.org/10.1111/j.1751-2824.2011.01479.x ISSSBL 1751-2816 Google Scholar
S. Holmeet al.,
“Enhancement of a culture-based bacterial detection system (eBDS) for platelet products based on measurement of oxygen consumption,”
Transfusion, 45 984
–993
(2005). http://dx.doi.org/10.1111/trf.2005.45.issue-6 TRANAT 0041-1132 Google Scholar
C. T. Fanget al.,
“Detection of bacterial contamination in apheresis platelet products American Red Cross experience 2004,”
Transfusion, 45 1845
–1852
(2005). http://dx.doi.org/10.1111/trf.2005.45.issue-12 TRANAT 0041-1132 Google Scholar
M. E. Brecheret al.,
“Evaluation of a new generation of culture bottle using an automated bacterial culture system for detecting nine common contaminating organisms found in platelet components,”
Transfusion, 42
(6), 774
–779
(2002). http://dx.doi.org/10.1111/j.1537-2995.2003.00617.x TRANAT 0041-1132 Google Scholar
J. B. Werchet al.,
“Detecting bacteria in platelet concentrates by use of reagent strips,”
Transfusion, 42
(8), 1027
–1031
(2002). http://dx.doi.org/10.1046/j.1537-2995.2002.00157.x TRANAT 0041-1132 Google Scholar
M. E. Brecheret al.,
“Glucose and haemolysis as a rapid screen for contamination of red blood cells with Yersinia and Serratia,”
Vox Sanguinis, 81
(2), 136
–138
(2001). http://dx.doi.org/10.1046/j.1423-0410.2001.00085.x VOSAAD 0042-9007 Google Scholar
K. H. NorrisJ. T. Kuenstner,
“Rapid measurement of analytes in whole blood with NIR transmittance,”
Leaping Ahead with Near Infrared Spectroscopy, 431
–436 Australian Chemical Institute, North Melbourne
(1995). Google Scholar
O. S. Khalil,
“Noninvasive glucose measurement technologies: an update from 1999 to the dawn of the new millennium,”
Diabetes Technol. Ther., 6
(5), 660
–97
(2004). http://dx.doi.org/10.1089/dia.2004.6.660 DTTHFH 1520-9156 Google Scholar
H. M. Heise,
“Near-infrared spectrometry for in vivo glucose sensing,”
Biosensors in the Body Continuous In Vivo Monitoring, 79
–116 John Wiley & Sons, Chichester
(1997). Google Scholar
A. K. Amerovet al.,
“Scattering and absorption effects in the determination of glucose in whole blood by near-infrared spectroscopy,”
Anal. Chem., 77 4587
–4594
(2005). http://dx.doi.org/10.1021/ac0504161 ANCHAM 0003-2700 Google Scholar
Y. KimG. Yoon,
“Prediction of glucose in whole blood by near-infrared spectroscopy: influence of wavelength region, preprocessing, and hemoglobin concentration,”
J. Biomed. Opt., 11
(4), 041128-1
–041128-7
(2006). http://dx.doi.org/10.1117/1.2342076 JBOPFO 1083-3668 Google Scholar
K. Maruoet al.,
“In vivo noninvasive measurement of blood glucose by near-infrared diffuse-reflectance spectroscopy,”
Appl. Spectrosc., 57
(10), 1236
–1244
(2003). http://dx.doi.org/10.1366/000370203769699090 APSPA4 0003-7028 Google Scholar
T. NaesaH. Martens,
“Comparison of prediction methods for multicollinear data,”
Commum. Stat. Simulat. Comput., 4
(3), 545
–576
(1985). http://dx.doi.org/10.1080/03610918508812458 0361-0918 Google Scholar
H. MartensT. Naes, Multivariate Calibration, John Wiley & Sons, Chichester
(1991). Google Scholar
H. MartensM. Martens, Multivariate Analysis of Quality: An Introduction, John Wiley & Sons, Chichester
(2001). Google Scholar
|