

|
|
1.IntroductionHuman malaria disease is a worldwide disease with estimated 225 million cases, accounting for 800,000 deaths per year.1 The disease is caused by a parasite protozoan, in which the parasite infects blood cells of the host and hemozoin biocrystals are disposed as byproducts after the ingestion of hemoglobins.2 Since the malaria disease can aggravate into a fatal illness within hours upon development of the first symptom,3 the early diagnosis of malaria infection is important, which requires the detection of hemozoin at low concentrations in infected blood cells.1,2 In malaria diagnosis, microscopic examination of blood smears remains the “gold standard” for the detection of malaria parasites, but this method is labor-intensive and time-consuming; moreover, special expertise from operators is required for reliable data interpretation.4 Therefore, the development of a sensitive technique, which requires minimal labor and expertise for hemozoin detection, is warranted in early malaria diagnosis. Recently, several other malaria diagnosis techniques, such as the quantitative buffy coat method, the molecular diagnostic method, flow cytometry technique, serological tests, light scattering measurement, optical tweezing and laser desorption mass spectrometry,4–8 have been developed to overcome the shortcomings of the traditional method. Among these methods, resonance Raman spectroscopy (RRS) has been reported to amplify the Raman signal of hemozoin in malaria parasite-infected blood cells by the close Raman shift matching between the laser source and electronic transition of hemozoin.6,9 Moreover, surface-enhanced Raman scattering (SERS) effect has also been shown on a silver tip to enhance the Raman spectrum of hemozoin in infected cells via the augmented electromagnetic coupling between hematin and gold or silver nanoparticles.10 The success in detecting the RRS and SERS signal of hemozoin shows the potential for further augmentation by combining the two effects, known as surface enhanced resonance Raman spectroscopy (SERRS). This SERRS technique has been demonstrated on other test molecules [rhodamine 6G (R6G)] adsorbed on silver nanoparticles for further enhancement in the Raman signal, as silver gives a higher enhancement than other metals (e.g. gold).11 The SERRS signal could be further enhanced by employing a magnetic field to enrich the hemozoin concentration. A similar strategy has been employed in other applications such as magnetic purification.12,13 Moreover, magnetic nanoparticles, e.g. nanoparticles made of iron oxide that show to be effective magnets at room temperature,14 could also attract and attach to hemozoin in a magnetic field because hemozoin is paramagnetic in nature,12 in a magnetic field. This approach is similar to the strategy reported for capturing and enriching bacteria.15 In this work, we report a novel magnetic field enrichment strategy on SERRS by using magnetic nanoparticles to augment Raman signals from -hematin crystals, similar to hemozoin16 in molecular, magnetic and Raman properties. The SERRS effect is further enhanced by the magnetic enrichment of -hematin crystals and magnetic SERS-active nanoparticles with iron oxide core and silver shell. The performance of magnetic field-enriched SERRS quantified experimentally is compared with that of the SERRS without the influence of magnetic field, and the ordinary RRS on -hematin crystals. Furthermore, the analytical enhancement factor and sensitivity of the proposed magnetic field-enriched SERRS technique are investigated. 2.Materials and Methods2.1.Fabrication of Magnetic NanoparticlesWe synthesized the nanoparticles with iron oxide core and silver shell by using the seed-growth reduction method.17,18 First, a total of 16.2 mM nanoparticles (Iron II, III oxide nanopowder, Sigma-Aldrich, USA) in ethanol (20 ml) was added drop-wise to 80 ml of ethanol with 0.15 g of polyacrylic acid (Potassium polyacrylate, Sigma-Aldrich, USA). Then the mixture was sonicated (Elma E30H, Elma, Switzerland) for 15 min. The nanoparticles were separated with a magnet and washed with ethanol. The separated nanoparticles were re-dispersed (2.1 mM) in a mixture of ethanol and deionized water () with a 2.8 mM (Silver nitrate, Merck, USA) in the ultrasonic bath for 30 min. To reduce the silver salt, Triton X-100 (Triton X-100 Detergent, Bio-Rad Laboratories, USA), ethanol and deionized water () mixed with hydroxylamine hydrochloride (4.1 mM, MP Biomedicals, USA) and NaOH (8.1 mM) was added drop-wise () to the suspension of nanoparticles absorbed with salt. Finally, Triton X-100, ethanol and deionized water () with (19.4 mM) was added drop-wise () to the mixture. The mixture was washed and the magnetic nanoparticles were separated using a magnet. The resulting nanoparticles were suspended in 15 ml methanol and then filtered with 0.2 μm supor filters (0.2 μm supor syringe filters, Pall, USA). 2.2.Synthesis of -Hematin Crystals-hematin crystals were fabricated using an acid-catalyzed method.19 A 0.1 M NaOH solution dissolved with 7.9 mM of Ferriprotoporphyrin IX chloride [Cl-Fe(III)PPIX, hemin chloride, MP Biomedicals, USA] was heated at 60°C and stirred at 150 rpm. 1.45 ml of HCl (1 M) and 8.825 ml of acetate solution were added to the mixture, after 10 min and 14 min, respectively. After another 46 min, the heater was removed and the mixture was left undisturbed in a dark environment for 24 h. The solute was washed with methanol and deionized water sequentially, then filtered and collected with 0.2 μm supor filter for drying at room temperature over for 48 h. The dry -hematin powder was resuspended by aqueous NaOH at concentrations ranging from to to obtain -hematin suspension at concentrations ranging from to . NaOH was introduced to effectively disaggregate the large -hematin pellet into smaller crystals by breaking the interchain hydrogen bonds between -hematin molecules20,21 Due to the low concentration of NaOH used, the conversion of -hematin to hematin was insignificant as compared to other studies in which NaOH at a much higher concentration was used.20 This ensured that measured Raman spectra were mainly contributed by -hematin, which is confirmed by the characteristic peaks of -hematin present in the spectra. To investigate the magnetic enrichment effect in smaller -hematin, precipitate was disposed and supernatant was collected for Raman measurements from a -hematin suspension () after centrifuging at 5000 rpm for 5 min (Sartorius 2-16, Sigma Laborzentrifugen, Germany). 2.3.Preparation of Analytes for Magnetic Field-enriched SERRS ExperimentsFor the SERS measurements of R6G (Rhodamine 6G, Sigma-Aldrich, USA) absorbed on magnetic nanoparticles, R6G aqueous solutions were prepared at concentrations ranging from to . As for the evaluation of SERRS measurements of -hematin crystals with and without magnetic field enrichment, the suspension of magnetic nanoparticles and -hematin solution were each sonicated for 2 min. They were then mixed together () and underwent sonication for another 2 min. In all Raman measurements, the analyte was dropped inside a small vial made with aluminum foil for measurements, since aluminum has shown to give minimal background Raman signal within the spectral region of interest in this study.22 The small vial was placed on top of a magnet, around which the magnetic field was 0.198 T and the magnetic field gradient was , during the SERRS and RRS measurements with magnetic field enrichment. 2.4.Field Emission Scanning Electron Microscope and Transmission Electron Microscope with Energy-dispersive X-rays AnalysisFor taking field emission scanning electron microscope (FESEM) images, a thin layer of platinum was coated with a fine coater (JEOL JFC-1600, JEOL, Japan) at 20 mA for 80 s on the sample surface prior to the FESEM (JEOL JSM-6700F, JEOL, Japan) examination of magnetic nanoparticles and -hematin, with an accelerating voltage of 5 kV. In the transmission electron microscope (TEM) study, the TEM (JEOL 2100F TEM, JEOL, Japan) equipped with an energy-dispersive X-ray (EDX) analyzer was operated at 200 kV to obtain the TEM images and corresponding EDX of the magnetic nanoparticles. The sample was prepared by drying nanoparticle suspension that was dropped onto a copper TEM grid (300 mesh holey-carbon copper TEM grid, Ted Pella, USA) prior to image acquisition. 2.5.Raman InstrumentationWe evaluated the SERS signals of R6G, and investigated the SERRS and RRS properties of -hematin crystals with and without magnetic field using a micro-Raman spectrometer system (inVia, Renishaw, UK) coupled with a microscope (Alpha 300, WITec, Germany) in a backscattering geometry. A Czerny-Turner type spectrograph () equipped with a holographic grating () and a RemCam CCD detector (inVia, Renishaw, UK) were selected for all spectral measurements, which yields a spectral resolution of . A 633 nm laser (Renishaw, UK) beam, reported to be feasible for inducing SERS effect on Ag,23 was focused onto the samples at a spot size of about 3 µm through a microscope objective (, N.A. 0.4, Leica). The excitation power was 0.1 mW for all SERS and SERRS measurement, which is typically used in literature to avoid localized heating,24 and 10 mW for the ordinary Raman experiment. A signal-to-noise ratio, , of about 5 was required in all Raman spectra for the determination of minimum detectable concentrations of R6G and -hematin, where was the average noise intensity in the spectral region next to a representative Raman peak ( for R6G and at for -hematin), and S was the difference between the peak intensity ( for R6G and for -hematin) and the average noise intensity. All Raman spectra were collected with an exposure time of 15 s, and averaged from more than five different locations with a standard deviation of less than 5% for R6G, and of less than 10% for -hematin. In each raw spectrum, a fifth-order polynomial was found to be optimal for fitting the fluorescence background, in which this polynomial was subtracted from the raw spectrum to yield the final spectrum.25 3.ResultsFigure 1(a) gives the FESEM image of the raw nanoparticles. Individual nanoparticles have a mean diameter of about 50 nm (). Figure 1(b) shows the FESEM images of the nanoparticles coated with silver shells. The nanoparticles were well dispersed in the image. Each nanoparticle has a mean diameter of about 140 nm [Fig. 1(c)], with a size range characterized by zetasizer measurements. The core-shell geometry is reconfirmed by the TEM image [Fig. 1(d)] with an EDX spectrum[Fig. 1(e)] that reveals the elemental composition of the nanoparticle. Fe, Ag, O, Cu and C can be observed in the EDX graph. Fe, O and Ag signals are originated from the core and Ag shell, while Cu, and C are attributed to the copper grid. Fig. 1(a) FESEM image of raw nanoparticles. (b) FESEM and (c) zoomed in FESEM image of Ag nanoparticles. (d) Representative TEM image of nanoparticles (Other structures in the image are attributed to surfactant). (e) EDX of the nanoparticles.  Figure 2 compares the SERS spectra of aqueous R6G solution adsorbed on the fabricated nanoparticles [Fig. 2(a), concentrations varying from to ] with the ordinary Raman spectra of R6G solution [Fig. 2(b), concentrations varying from to ]. Most prominent Raman peaks, such as ring in-plane bending (), CH out-of-plane bending (), stretching (), stretching ( and ), and aromatic stretching (),26 can be observed in the SERS spectra of R6G. The minimum detectable concentration of R6G absorbed on the nanoparticles is , which is five orders of magnitude more sensitive than that of detected in the ordinary Raman spectrum without enhancement. We estimated27 that the analytical enhancement factor (AEF) of the SERS signals relative to the ordinary Raman measurement () is about , which is comparable to the AEF values (around to ) of nanoparticle colloids stated in the literature.27,28 These results suggested the feasibility of using the nanoparticles for enhancing the Raman signal of -hematin crystals. Fig. 2SERS spectra of R6G solution at concentrations of , , and , with nanoparticles, at laser excitation power of 0.1 mW. (b) Ordinary Raman spectra of R6G at concentrations of , , and , at laser excitation power of 10 mW. The acronyms in the legends mean the following. ip: in-plane; op: out-off-plane; str: stretching; Arom: Aromatic.  Figure 3 shows the FESEM image of -hematin crystals fabricated using the acid-catalyzed method [Fig. 3(a) and 3(b)] and the size distribution of crystals [Fig. 3(c)]. The fabricated -hematin crystals are comparable to the size of hemozoin biocrystals found in the ring stage parasites (estimated from the concentration per cell and density of hemozoin)29,30 that dominate over other stages12 in the bloodstream for detection. Close resemblance in the spatial dimensions between the two types of crystals presumably would result in similar SERRS enhancement effect. The minimization of fabricated hemozoin size is to avoid artificially higher enhancement in magnetic field enrichment since larger crystals will have higher magnetic field enrichment as shown in the result later. Hence, the acid-catalyzed method is preferred to fabricate smaller crystals over the anhydrously synthesized20 -hematin or in the biochemically cloned31 hemozoin, although the resulted crystals may have lower crystallinity and smaller sizes as reported in Ref. 19. Fig. 3(a) FESEM image of -hematin crystals. (b) Zoomed in FESEM image of -hematin crystals. (c) Population distribution of size (area) -hematin crystals obtained by using Matlab software.  Figure 4 compares resonance Raman spectra of hematin with [Fig. 4(a)–4(c)] and without [Fig. 4(d)–4(f)] magnetic field-enriched strategy at concentrations ranging from to . Prominent vibrational features, such as (based on the electron spin and crystallographic coordination notation tetragonal system for resonance Raman peaks studies on myoglobin)32 at , at , at , at , at , at , and at ,33 are noted in most of these spectra. The locations of these peaks are equal to those reported Raman peaks6 for hemozoin biocrystals, confirming that the spectral features of -hematin crystals are equivalent to hemozoin in Raman spectroscopy. The effect of surface enhancement can be clearly distinguished when the SERRS [Fig. 4(a) and 4(d)] are compared with the RRS measurements [Fig. 4(b) and 4(e)] and the RRS measurements by using nanoparticles [Fig. 4(c) and 4(f)]. We also note that the lowest detectable concentrations of -hematin for SERRS with nanoparticles, RRS, and RRS with nanoparticles under magnetic field enrichment are , , and , respectively, and those without magnetic field enrichment are , , and , respectively, where the excitation power in the SERRS measurements was 0.1 mW and that in the RRS measurements was 10 mW. Fig. 4Magnetic field-enriched spectra of -hematin crystals in a magnetic field (a) with nanoparticles (Concentrations: to ; : 0.1 mW), (b) without and (c) with nanoparticles (Concentrations: , and ; : 10 mW). Spectra of -hematin crystals without magnetic field (d) with nanoparticles (Concentrations: to ; : 0.1 mW), (e) without and (f) with nanoparticles (Concentrations: , and ; : 10 mW). means the excitation power. 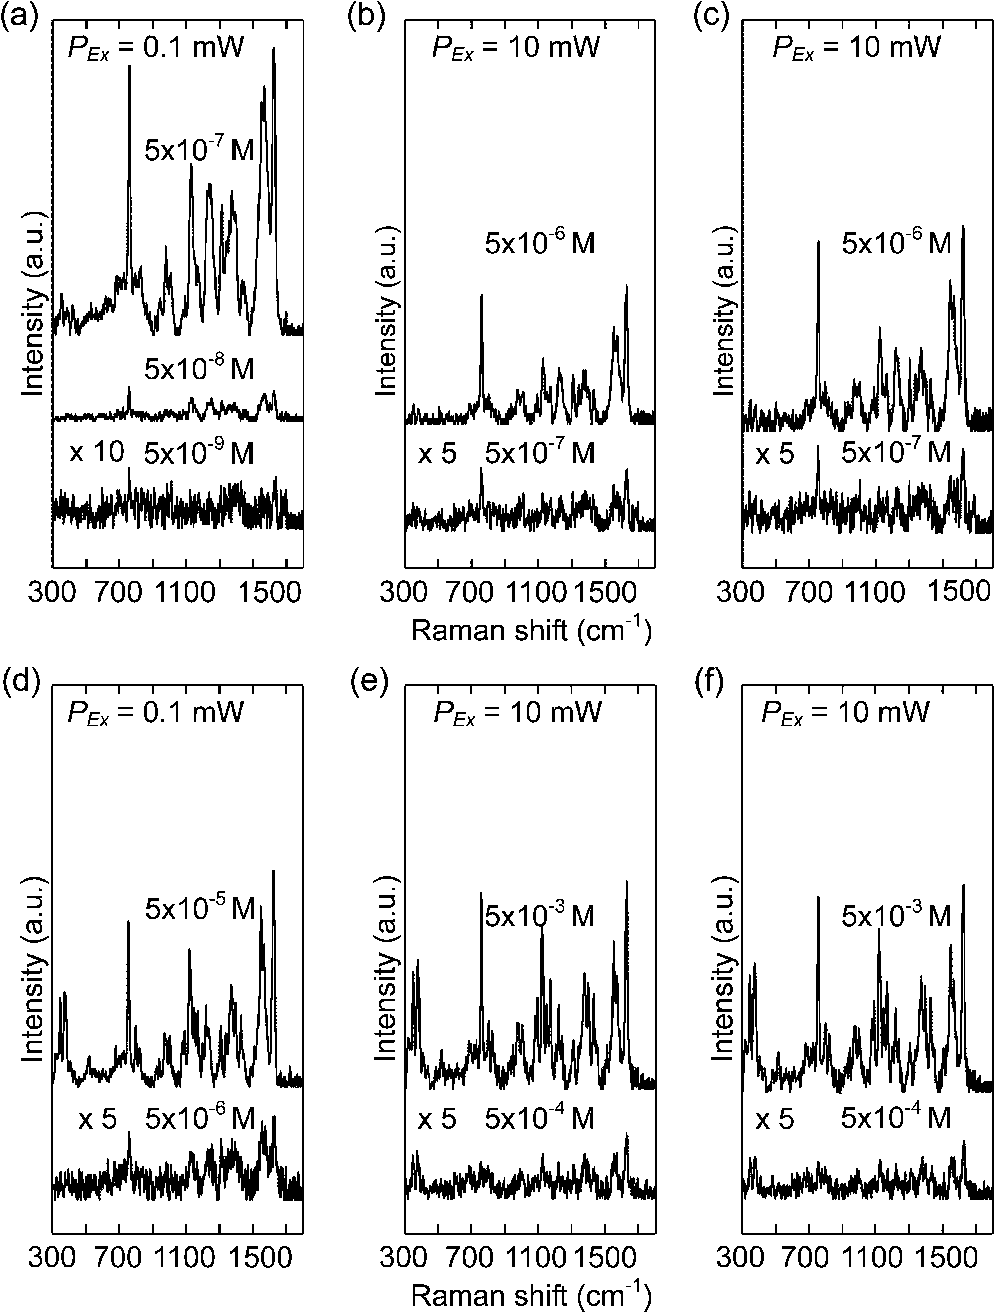 4.DiscussionWe have demonstrated the feasibility and significant improvement of magnetic field-enriched SERRS over conventional SERRS for detecting -hematin crystals at low concentrations. To gain additional insight into Raman enhancement in this technique, we calculated the analytical enhancement factor (AEF) in each of the following techniques relative to the RRS measurement of -hematin crystals without nanoparticles [Fig. 4(e)]: 1. magnetic field-enriched SERRS (), 2. SERRS without magnetic field (), and 3. magnetic field-enriched RRS (). These AEFs have been calculated by applying Eq. (1): where , and are the ratio of Raman intensity at , and the ratio of -hematin concentration, respectively, in the measurements to be evaluated (magnetic field-enriched SERRS, SERRS, or magnetic field-enriched RRS) to those in the reference measurement (RRS). The estimated27 AEF values are listed as follows: , , and . Hence, the magnetic field enrichment can improve the signal intensities by roughly two orders of magnitude. The three orders of magnitude augmentation in the detection limit between the measurements with and without the magnetic field enriched can be attributed to the reduced noise level in the Raman signal in the magnetic field-enriched measurement.The enhancement mechanism behind the addition of nanoparticles is studied. SERRS signal of -hematin [Fig. 4(d)] is only exhibited by mixing nanoparticles with the SERS-active silver shell and -hematin. RRS is resulted for nanoparticles and -hematin mixture [Fig. 4(f)], with RRS signal comparable to that of -hematin without any nanoparticles [Fig. 4(e)]. This observation also applies to the magnetic field-enriched measurement, with only SERRS enhancement noted in the mixture of nanoparticles and -hematin [Fig. 4(a)], while RRS is exhibited in the -hematin mixture with [Fig. 4(b)] and without [Fig. 4(c)] nanoparticles under a magnetic field. RRS intensities of -hematin with nanoparticles under magnetic field is 1.4 times higher than that without nanoparticles, probably attributed to the enhanced aggregation of -hematin due to the nanoparticles. The spectral shapes are similar in the SERRS and RRS spectra despite the fact that higher intensity is noted in the SERRS spectra. The similarity may be explained by the unchanged chemical structure and symmetry of -hematin crystals that are magnetically held to the nanoparticles. Compared to many other molecules such as R6G, the adsorption of -hematin crystals onto the Ag surface is weaker thus its SERRS spectrum is less influenced by the adsorption. The similar phenomenon is also observed in other chemicals34 that have weak interactions with Ag. We have compared for -hematin with for R6G, since the two quantities are considered equivalent.35 The enhancement factor of SERS relative to ordinary Raman for R6G () is higher than that of the SERRS relative to RRS for -hematin (), which can be attributed to the larger size of the -hematin compared R6G molecules, with size (area) at least greater than roughly (Fig. 3). Nevertheless, aggregates formed between magnetic -hematin and the nanoparticles can still lead to effective SERS activities, similar to the configurations reported in the literature (e.g. localized AEF of about in configuration such as dimers and trimers).36 In addition, SERS can be observed in -hematin at a distance from the Ag surface in the aggregation configuration (), similar to that in other SERS nanoparticles.37 The is compensated by the further augmentation in the magnetic field-enriched SERRS and RRS measurements, which can be explained by the following effects induced by the magnetic field. First, -hematin is enriched. Second, more nanoparticles are attached to each -hematin crystal and thus, leading to higher SERRS intensity. The potential mechanisms responsible for these effects are elaborated as follows. The enrichment of -hematin concentrations due to a magnetic field can be interpreted by the fact that paramagnetic16 -hematin are attracted much faster to the bottom of the vial by the magnet than unmagnetized crystals without the influence of a magnetic field. Consequently, the concentration of -hematin will be higher at the laser spot than that without the magnetic field, which has been demonstrated by a value of 68 in for RRS measurements under the influence of a magnetic field in the absence of nanoparticles [Fig. 4(c)]. The magnetic field enrichment effect is more significant in larger -hematin crystals, as confirmed by our Raman experiment in the -hematin supernatant after centrifuging (Fig. 5). Higher is observed in the magnetic field-enriched RRS for -hematin mixture without centrifuging (68 in Fig. 4) than that calculated27 in the -hematin supernatant (4 in Fig. 5). Hence, the magnetic field can effectively enrich -hematin crystals to give rise to strong enhancement. Fig. 5(a) Magnetic field-enriched SERRS and (b) SERRS spectra of -hematin supernatant obtained by centrifuging (-hematin at concentration of ) at an excitation power of 0.1 mW. (c) Magnetic field-enriched RRS and (d) RRS spectra of the same -hematin supernatant at an excitation power of 10 mW. 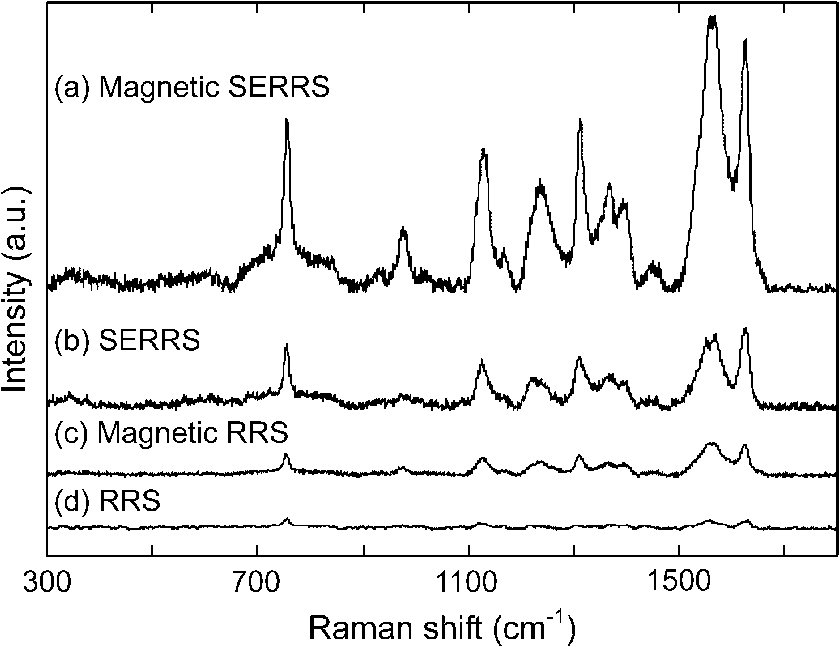 More nanoparticle-hematin aggregates are formed by an external magnetic field. Figure 6 shows that more nanoparticles are bound to -hematin crystals in a magnetic field [Fig. 6(a)] compared to the case without a magnetic field [Fig. 6(b) and 6(c)]. Since the core of the nanoparticles is ferromagnetic,14 the magnetic field produced by each nanoparticle attracts adjacent -hematin crystals [Fig. 6(b) and 6(c)]. More nanoparticles are close or tightly bound to -hematin crystals under an external magnetic field [Fig. 6(a)]. Figure 6(d) shows a schematic physical model for the configurations of nanoparticles and -hematin crystals that leads to surface enhancement. For each crystal attached at the contact or in close vicinity () in the gap to the nanoparticle, known as “hot spots,” intense SERS activities occur.11,36,37Additional hot spots are formed with more aggregations with the application of an external magnetic field. The increased number of nanoparticles-hematin aggregates may be responsible for the further improvement in the that is 149 times larger than the , in comparison with that in RRS without the involvement of nanoparticles as in . In contrast, the ratio of to in -hematin supernatant () is similar in magnitude to the AEF in the magnetic RRS measurement (),27 since the -hematin supernatant contained mostly small crystals that are already attached on the nanoparticles. Therefore, more nanoparticle-hematin aggregates can give further augmentation in Raman signals, in addition to the SERRS and -hematin enrichment effects. Fig. 6FESEM images of nanoparticles and -hematin crystals (a) with and (b) without the external magnetic field.  With the two aforesaid magnetic field induced effects, we evaluate the detection limit of -hematin using magnetic field-enriched SERRS by converting -hematin concentration to the concentration of malaria parasites in blood for practical evaluation. The detection limit of -hematin concentration at in the magnetic field-enriched SERRS measurement obtained in this study is equivalent to roughly (considering a hemozoin concentration of about in the earlier malaria infection at the ring stage and a molecular weight of for hemozoin)29,38 at the early stage. More importantly, the sensitivity is comparable to other rapid malaria detection techniques for hemozoin detection at later malaria stages, e.g. (with hemozoin concentration at about ),12 for laser desorption mass spectrometry and automated blood cell counters.33,39,40 With the high sensitivity in the detection of -hematin in the current configuration without optimization, the magnetic field-enhanced SERRS technique has demonstrated great potential for early malaria diagnosis. The detection sensitivity of our technique could be further improved by optimizing the configuration of the magnetic field and the physical geometry of SERS-active nanoparticles. 5.ConclusionsWe report the detection of -hematin crystals using magnetic field-enriched SERRS enabled by nanoparticles. The method enriches -hematin crystals and nanoparticles by applying an external magnetic field and synergizes with the enhancement capability of SERRS, thereby promoting further augmentation in the Raman signal of -hematin crystals. A parasitemia level of in blood in the early stages of infection can be achieved by using this method with the current setup, which demonstrates the potential of employing magnetic field-enriched SERRS in early malaria diagnosis. 6.Appendix6.1.Analytical Enhancement Factor CalculationThe analytical enhanced factors are calculated for the following. For rhodamine 6G (R6G) molecules, the SERS AEF of R6G molecules in the nanoparticles solution of iron oxide core coated with silver shell () with respect to the ordinary Raman measurement () has been calculated. For the -hematin crystals, 1. the equivalent magnetic field-enriched SERRS AEF (), 2. the SERRS AEF without magnetic field (), and 3. the equivalent magnetic field-enriched RRS AEF () relative to RRS measurements have been calculated. The AEF in magnetic field-enriched measurement are equivalent AEF, in which the -hematin concentrations are the concentrations prior to the magnetic field enrichment. These AEFs were calculated from the equation, where (), () and () are the ratios of the Raman intensities at Raman shift of , excitation powers, and concentrations in enhanced and referenced measurements.6.2.Calculation ofThe of R6G in nanoparticle solution can be calculated as, where the two numbers 9135.5 and 1584 are the SERS and ordinary Raman intensities of R6G, respectively, at the concentrations of and , excited at corresponding laser power of 0.1 mW and 10 mW (as in Fig. 2 in the main text).6.3.Calculation of Equivalent , ,Similarly, the analytical enhancement factors in the measurement of magnetic field-enriched SERRS, SERRS and magnetic field-enriched RRS with reference to the RRS measurement of -hematin crystals, can be calculated by Eq. (2). Table 1 gives the parameters for the calculation. Note that the equivalent AEFs are calculated in the magnetic field-enriched measurement, since the concentrations stated are concentrations of -hematin prior to the use of a magnetic field. The AEF values are listed as follows: , , and . Table 1Parameters used in the calculation of the AEFmagSERRS/RRS,β-hema, AEFSERRS/RRS,β-hema, and AEFmagRRS/RRS,β-hema for β-hematin.
Table 2 gives the parameters for the calculation of the analytical enhancement factors in the measurement of magnetic field-enriched SERRS, SERRS and magnetic field-enriched RRS with reference to the RRS measurement of -hematin supernatant after centrifuging. The results are , , and . Table 2Parameters used in the calculation of the AEFmagSERRS/RRS,β-hema, AEFSERRS/RRS,β-hema, and AEFmagRRS/RRS,β-hema for β-hematin supernatant after centrifuging.
AcknowledgmentsThis research was funded by the Bill and Melinda Gates Foundation through the Grand Challenges Explorations Initiative (Grant No. OPP1015169). References
(2010). Google Scholar
I. WeissbuchL. Leiserowitz,
“Interplay between malaria, crystalline hemozoin formation, and antimalarial drug action and design,”
Chem. Rev., 108
(11), 4899
–4914
(2008). http://dx.doi.org/10.1021/cr078274t CHREAY 0009-2665 Google Scholar
J. Crawleyet al.,
“Malaria in children,”
Lancet, 375
(9724), 1468
–1481
(2010). http://dx.doi.org/10.1016/S0140-6736(10)60447-3 LANCAO 0140-6736 Google Scholar
T. HanscheidT. J. EganM. P. Grobusch,
“Haemozoin: from melatonin pigment to drug target, diagnostic tool, and immune modulator,”
Lancet Infect. Dis., 7
(10), 675
–685
(2007). LIDABP 1473-3099 Google Scholar
C. K. Murrayet al.,
“Update on rapid diagnostic testing for malaria,”
Clin. Microbiol. Rev., 21
(1), 97
–110
(2008). http://dx.doi.org/10.1128/CMR.00035-07 CMIREX 0893-8512 Google Scholar
T. Frochet al.,
“In situ localization and structural analysis of the malaria pigment hemozoin,”
J. Phys. Chem. B, 111
(37), 11047
–11056
(2007). http://dx.doi.org/10.1021/jp071788b JPCBFK 1520-6106 Google Scholar
Y. K. Parket al.,
“Static and dynamic light scattering of healthy and malaria-parasite invaded red blood cells,”
J. Biomed. Opt., 15
(2), 020506
(2010). http://dx.doi.org/10.1117/1.3369966 JBOPFO 1083-3668 Google Scholar
J. M. A. Mauritzet al.,
“Detection of plasmodium falciparum-infected red blood cells by optical stretching,”
J. Biomed. Opt., 15
(3), 030517
(2010). http://dx.doi.org/10.1117/1.3458919 JBOPFO 1083-3668 Google Scholar
B. R. Woodet al.,
“Resonance Raman microscopy in combination with partial dark-field microscoy lights up a new path in malaria diagnostics,”
Analyst, 134
(6), 1119
–1125
(2009). http://dx.doi.org/10.1039/B822603B ANLYAG 0365-4885 Google Scholar
B. R. Woodet al.,
“Tip-enhanced Raman scattering (TERS) from hemozoin crystals within a sectioned erythrocyte,”
Nano Lett., 11
(5), 1868
–1873
(2011). http://dx.doi.org/10.1021/nl103004n NALEFD 1530-6984 Google Scholar
K. Kneippet al.,
“Ultrasensitive chemical analysis by Raman spectroscopy,”
Chem. Rev., 99
(10), 2957
–2975
(1999). http://dx.doi.org/10.1021/cr980133r CHREAY 0009-2665 Google Scholar
D. M. Newmanet al.,
“A magneto-optic route toward the in vivo diagnosis of malaria: preliminary results and preclinical trial data,”
Biophys. J., 95
(2), 994
–1000
(2008). http://dx.doi.org/10.1529/biophysj.107.128140 BIOJAU 0006-3495 Google Scholar
C. C. KimE. B. WilsonJ. L. DeRisi,
“Improved methods for magnetic purification of malaria parasites and haemozoin,”
Malar. J., 9 17
–21
(2010). http://dx.doi.org/10.1186/1475-2875-9-17 MJAOAZ 1475-2875 Google Scholar
J. KimJ. OhB. Choi,
“Magnetomotive laser speckle imaging,”
J. Biomed. Opt., 15
(1), 011110
(2010). http://dx.doi.org/10.1117/1.3285612 JBOPFO 1083-3668 Google Scholar
J. GaoH. GuB. Xu,
“Multifunctional magnetic nanoparticles: design, synthesis, and biomedical applications,”
Acc. Chem. Res. B, 42
(1), 1097
–1107
(2009). http://dx.doi.org/10.1021/ar9000026 Google Scholar
D. S. Bohleet al.,
“Structural and spectroscopic studies of —hematin (the heme coordination polymer in malaria pigment),”
in ACS Symp. Ser.,
497
–515
(1994). http://dx.doi.org/10.1021/symposium Google Scholar
Y. Zhaiet al.,
“Fabrication of iron oxide core/gold shell submicrometer spheres with nanoscale surface roughness for efficient surface-enhanced Raman scattering,”
J. Phys. Chem. C, 113
(17), 7009
–7014
(2009). http://dx.doi.org/10.1021/jp810561q 1932-7447 Google Scholar
S. Charanet al.,
“Synthesis of surface enhanced Raman scattering active magnetic nanoparticles for cell labeling and sorting,”
J. Appl. Phys., 105
(7), 07B310
(2009). http://dx.doi.org/10.1063/1.3073828 JAPIAU 0021-8979 Google Scholar
T. J. EganW. W. MavusoK. K. Ncokazi,
“The mechanism of β-hematin formation in acetate solution. Parallels between hemozoin formation and biomineralization,”
Biochemistry, 40
(1), 204
–213
(2001). 0006-2960 Google Scholar
T. J. Egan,
“Recent advances in understanding the mechanism of hemozoin (malaria pigment) formation,”
J. Inorg. Biochem., 102
(5–6), 1288
–1299
(2008). http://dx.doi.org/10.1016/j.jinorgbio.2007.12.004 JIBIDJ 0162-0134 Google Scholar
F. Omodeo-saleD. MontiP. OlliaroD. Taramelli,
“Prooxidant activity of —hematin (synthetic malaria pigment) in arachidonic acid micelles and phospholipid large unilamellar vesicles,”
Biochem. Pharmacol., 61
(8), 999
–1009
(2001). BCPCA6 0006-2952 Google Scholar
C. YuenW. ZhengZ. Huang,
“Optimization of extinction efficiency of gold-coated polystyrene bead substrates improves surface-enhanced Raman scattering effects by post-growth microwave heating treatment,”
J. Raman Spectrosc., 41
(4), 374
–380
(2010). http://dx.doi.org/10.1002/jrs.2464 JRSPAF 0377-0486 Google Scholar
M. MeyerE. C. Le RuP. G. Etchegoin,
“Self-limiting aggregation leads to long-lived metastable clusters in colloidal solutions,”
J. Phys. Chem. B, 110
(12), 6040
–6047
(2006). http://dx.doi.org/10.1021/jp055866b JPCBFK 1520-6106 Google Scholar
W. Zhanget al.,
“Near-field heating, annealing and signal loss in tip-enhanced Raman spectroscopy,”
J. Phys. Chem. C, 112
(6), 2104
–2108
(2008). http://dx.doi.org/10.1021/jp077457g 1932-7447 Google Scholar
C. YuenW. ZhengZ. Huang,
“Low-level detection of anti-cancer drug in blood plasma using microwave-treated gold-polystyrene beads as surface-enhanced Raman scattering substrates,”
Biosen. Bioelect., 26
(2), 850
–854
(2010). http://dx.doi.org/10.1016/j.bios.2010.07.030 BBIOE4 0956-5663 Google Scholar
C. YuenW. ZhengZ. Huang,
“Improving surface-enhanced Raman scattering effect using gold-coated hierarchical polystyrene bead substrates modified with postgrowth microwave treatment,”
J. Biomed. Opt., 13
(6), 064040
(2008). http://dx.doi.org/10.1117/1.3050447 JBOPFO 1083-3668 Google Scholar
E. C. Le Ruet al.,
“Surface enhanced Raman scattering enhancement factor: a comprehensive study,”
J. Phys. Chem. C, 111
(37), 13794
–13803
(2007). http://dx.doi.org/10.1021/jp0687908 1932-7447 Google Scholar
S. H. Ciouet al.,
“SERS enhancement factors studies of silver nanoprism and spherical nanoparticle colloids in the presence of Bromide ions,”
J. Phys. Chem. C, 113
(22), 9520
–9525
(2009). http://dx.doi.org/10.1021/jp809687v 1932-7447 Google Scholar
Y. M. SerebrennikovaJ. PatelL. H. Garcia-Rubio,
“Interpretation of ultraviolet-visible spectra of malaria parasite Plasmodium falciparum,”
Appl. Opt., 49
(2), 180
–188
(2010). http://dx.doi.org/10.1364/AO.49.000180 APOPAI 0003-6935 Google Scholar
S. Pagolaet al.,
“The structure of malaria pigment —haematin,”
Nature, 404
(6775), 307
–310
(2000). http://dx.doi.org/10.1038/35005132 0028-0836 Google Scholar
G. S. NolandN. BrionesD. J. Sullivan Jr.,
“The shape and size of hemozoin crystals distinguishes diverse Plasmodium species,”
Mol. Biochem. Parasitol., 130
(2), 91
–99
(2003). http://dx.doi.org/10.1016/S0166-6851(03)00163-4 MBIPDP 0166-6851 Google Scholar
S. HuK. M. SmithT. G. Spiro,
“Assignment of protoheme resonance Raman spectrum by heme labeling in myoglobin,”
Am. J. Chem. Soc., 118
(50), 12638
–12646
(1996). http://dx.doi.org/10.1021/ja962239e JACSAT 0002-7863 Google Scholar
B. R. Woodet al.,
“Raman spectroscopy reveals new insight into the electronics structure of —hematin and malaria pigment,”
Am. J. Chem. Soc., 126
(30), 9233
–9239
(2004). http://dx.doi.org/10.1021/ja038691x JACSAT 0002-7863 Google Scholar
Y. Flegeret al.,
“SERS as a probe for adsorbate orientation on silver nanoclusters,”
J. Raman Spectrosc., 40
(1), 1572
–1577
(2009). http://dx.doi.org/10.1002/jrs.v40:11 JRSPAF 0377-0486 Google Scholar
P. H. B. Aokiet al.,
“Coupling surface-enhanced resonance Raman scattering and electronic tongue as characterization tools to investigate biological membrane mimetic system,”
Anal. Chem., 82
(9), 3537
–3546
(2010). http://dx.doi.org/10.1021/ac902585a ANCHAM 0003-2700 Google Scholar
K. L. Wustholzet al.,
“Structure-activity relationships in gold nanoparticle dimers and trimers for surface-enhanced Raman spectroscopy,”
Am. J. Chem.. Soc., 132
(31), 10903
–10910
(2010). http://dx.doi.org/10.1021/ja104174m JACSAT 0002-7863 Google Scholar
S. J. Leeet al.,
“Surface-enhanced Raman spectroscopy and nanogeometry: the plasmonic origin of SERS,”
J. Phys. Chem. C, 111
(49), 17985
–18988
(2007). http://dx.doi.org/10.1021/jp077422g 1932-7447 Google Scholar
G. BlauerM. Akkawi,
“Investigations of B—and —hematin,”
J. Inorg. Biochem., 66
(2), 145
–152
(2002). http://dx.doi.org/10.1016/S0162-0134(96)00200-0 JIBIDJ 0162-0134 Google Scholar
A. Moody,
“Rapid diagnostic tests for malaria parasites,”
Clin. Microbiol. Rev., 15
(1), 66
–78
(2002). http://dx.doi.org/10.1128/CMR.15.1.66-78.2002 CMIREX 0893-8512 Google Scholar
N. Tangpukdeeet al.,
“Malaria diagnosis: a brief review,”
Korean J. Parasitol., 47
(2), 93
–102
(2009). https://doi.org/http://dx.doi.org10.3347/kjp.2009.47.2.93 Google Scholar
|


