

|
|
1.IntroductionTo address the problem of in-stent restenosis1–3 (renarrowing of a previously stented segment due to an excessive healing response of the vessel), a new class of intracoronary devices (i.e., drug-eluting stents [DES]), has been developed and ubiquitously introduced in clinical practice4 in 2003.5 The use of DES has been shown to reduce the occurrence of restenosis and recurrent ischemia substantially as well as the need for repeated revascularization procedures.4,5 Nevertheless, safety concerns with DES use persist.2,4,6 First, late stent thrombosis (LST) after DES placement has emerged as a major concern,3,6 to a large extent associated with deficient endothelial coverage as demonstrated by histological postmortem examinations.7 Second, incomplete—late—stent apposition (ISA) has been shown to be highly prevalent in patients with very LST after DES implantation.6 In addition, stent neoatherosclerosis has been shown to be another possible mechanism of late DES failure.8 As such, a full understanding of local DES-related mechanisms triggering adverse clinical events is still a matter of concern and debate. Intravascular optical coherence tomography (IV-OCT) is an imaging technique able to visualize the microstructure of blood vessels with an axial resolution below 20 μm.9,10 Due to its very high spatial resolution, it enables detailed in vivo assessment of individual stent strut coverage10 and apposition, making it possible to differentiate between late persistent stent malapposition and late acquired stent malapposition11,12 when comparing baseline (BL) and follow-up (FU) IV-OCT examinations. In addition, many deleterious effects of stent implantation on the vessel wall, such as dissections,13 tissue inflammation,14 neoatherosclerosis,8 thrombus deposition, and different levels and patterns of restenosis,15 can be visualized in detail. The accuracy and reproducibility of IV-OCT have been proven by many preclinical and clinical studies.16,17 Currently, several major clinical trials are addressing the vessel response to DES implantation by comparing IV-OCT datasets at different time points after stent implantation. Ideally, this procedure should consist of matching data on an image level at specific vessel regions over time, enabling to unravel the mechanisms leading to clinical adverse events. However, image analysis is currently performed manually on corresponding images from different IV-OCT acquisitions during FU. Matching these images is very labor intensive, complex, and subject to considerable intra- and inter-observer variability. In fact, due to the presence of possible vessel remodeling as a consequence of stent implantation, a manual procedure may well be highly inaccurate. The aim of this study was to develop and validate a new methodology for the automatic registration of IV-OCT datasets. Hereto, we propose a landmark-based rigid registration method exploiting the metallic stent framework as a feature. 2.Methodology: Registration AlgorithmThe proposed methodology consists of four different steps: (1) IV-OCT consecutive slices are analyzed and stent struts are automatically segmented, (2) a three-dimensional model of the stent is created, (3) the transformation able to register the stent models from two different IV-OCT acquisitions is computed, and (4) cross-sectional images are matched. Throughout this manuscript, the three-dimensional model used as a reference (i.e., the fixed model) will be referred to as the model, while the one rotating and translating will be called the moving data. The model typically corresponds to the baseline (BL) IV-OCT data (i.e., at the time of the implantation procedure) while the moving data corresponds to a follow-up (FU) acquisition. A flowchart of the algorithm is shown in Fig. 1. Fig. 1Algorithm flowchart from input to output. The algorithm is constituted by four steps: (1) image segmentation; (2) and (3) registration procedure and local level decomposition; and (4) image matching. The output consists in two intravascular optical coherence tomography (IV-OCT) datasets matched on an image level.  2.1.Automatic Stent Strut SegmentationA methodology for the automatic stent strut segmentation for IV-OCT images was recently proposed.18 Briefly, the strut segmentation algorithm operates in the polar image domain (where optical coherence tomography (OCT) intensity data are displayed in function of the acquisition angle and depth) by analyzing the intensity profile of individual A-scan lines. The first step of the image analysis procedure consists in a classification algorithm able to discriminate between A-lines containing a strut and A-lines containing (only) tissue. Four properties of the A-line intensity profiles are taken into account to reveal the presence of a strut: (1) maximum intensity value, (2) presence of a shadow, (3) relative shadow properties, and (4) the speed at which the signal energy rises and falls as a function of depth. According to these properties, A-lines are classified as strut A-line (SAL) or tissue A-line (TAL). Finally, by means of the classification output, the luminal surface of stent struts is automatically detected and traced. The segmentation is first obtained through individual SAL processing (one-dimensional, or 1-D, analysis), then multiple A-lines (two-dimensional, or 2-D) are analyzed implying spatial continuity. This approach has been validated and shown to provide accurate detection of stent struts.18 The stent segmentation is applied through the use of previously developed a software package18 that allows the user to check the results visually and manual correction in case of inaccurate detection. 2.2.Three-Dimensional Stent ModelConsecutive analysis of adjacent slices from an IV-OCT dataset with the previously defined algorithm generates a set of points in three-dimensional space representing the stent being visualized. In case a strut is composed by multiple points, only the central one is retained, with the purpose of correctly managing possible artifacts (i.e., catheter eccentricity and sunflower effect19). Helical acquisition is accounted for in this three-dimensional model as follows: where indicates the acquisition angle of the A-line in the polar image domain containing the strut, represents the position along the longitudinal axis and frame_dist the acquisition distance between two frames, which is known a priori ().An example of the three-dimensional model (from in vivo data) is given in Fig. 2. 2.3.Rigid RegistrationIterative closest point (ICP) is a well-known algorithm for accurate and computationally efficient registration of three-dimensional shapes that is independent of the shape representation. Typically, the two shapes to be registered are decomposed into point sets and the best alignment is calculated iteratively reducing the distance for each point individually. According to the ICP theorem,20ICP registrational ways converges monotonically to a local minimum: as a result it may not converge to the desired global minimum. To successfully apply ICP, a set of initial registrations able to put the two sets of points in the correct equivalence class of registration20 is required (i.e., provide a good initial guess of the registration). 2.3.1.InitializationGiven that the stents always present a cylindrical shape, initialization of the stent models is obtained in two steps: (1) application of a transformation matrix (translation ) able to make the center of mass (CM) of the moving data to coincide with the CM of the model and (2) rotation of the moving data around the longitudinal -axis (i.e., pullback direction), over 360 deg, computing the best rotation matrix able to put model and moving data in approximate registration. Specifically, the CM of a set of points is computed through the formula for a discrete system of particles.21 In this specific case, the same mass is given to all points. The difference of the positions of the two CMs in the -, -, and -axes represents the translation : To determine , apply the following procedure: Let be a point in the three-dimensional Cartesian space. The Euclidean distance between two points in the same space is defined as: Let be a set of points in the same space constituted by -points . The distance between and can be defined as: Hence, the normalized distance between two sets of points and can be defined by the following cost function, with the number of points in : To determine , the moving data are iteratively rotated deg over the pullback direction and the value of the cost function [Eq. (5)], is calculated for each rotation. The minimum value of the cost function represents the rotation able to put the two shapes in the correct equivalence class of registration for the ICP algorithm: To limit the computational time, was set to 2 deg in this study.In homogeneous coordinates, the final transformation matrix representing the initialization procedure can be obtained by combining Eq. (2) and Eq. (6) and is expressed as: A graphical example of the initialization procedure and the cost function is given in Fig. 3.Fig. 3(a) The model and the moving data after centers of mass matching and the rotation procedure over the longitudinal axis (pullback direction). (b) The values of the cost function corresponding to different values of the rotation angle . The cost function converges to a global minimum, which represents the best rotation value for the transformation to put the two point sets in approximate registration before iterative closest point (ICP) application.  2.3.2.Iterative closest point and local registrationThe ICP algorithm iteratively revises the three-dimensional rotation and translation of one cloud of points to another to further minimize the distance between the two sets of points.20 At every iteration, the correspondence between the model and the moving data is computed (closest point) and the rotation and translation able to minimize the distance between them are calculated. ICP output consists of a three-dimensional translation and rotation matrix. The total transformation matrix following the ICP procedure can be expressed in homogeneous coordinates as: where , , and represent the rotation angles around the -,-, and -axes, respectively. Specific details about the ICP algorithm can be found in its original report.20Once the ICP registration procedure ends, the transformation matrix is refined on a local level to allow for the correction of several acquisition artifacts such as NURD.22 As a compromise between accuracy and computational time, decomposition was made on four levels along the longitudinal axis. Here to, the model and the moving data were decomposed into four smaller models of equal length (e.g., if a stent of 18 mm length is visualized by IV-OCT, the data will be decomposed in four pieces with a length of 4.5 mm each). The registration procedure is then reapplied for every submodel, leading to the final result of the registration algorithm. The final transformation representing the local refinement could be expressed as follows: As the data are decomposed into four submodels, the procedure ends with four different local transformation matrices , , and . For the local level refinement, the initialization rotation angle was limited to .2.4.Image MatchingOnce the complete transformation matrices are obtained, it is possible to match the cross-sectional images belonging to the two IV-OCT datasets. Indicating with the stack of the images to register and with the stack of the final registered images the full registration procedure can be resumed by: where is set equal to , , or according to the local level the specific image to register belongs.As IV-OCT images are acquired by sampling the vessel being visualized in multiple slices over a predefined distance (Sec. 2.2), the rotations along the -axis and -axis, defined by both the ICP algorithm applications (i.e., global and local registration), were forced to be equal to zero. As such, final image matching was obtained through subsequent three-dimensional translations (,, and ) and longitudinal axis rotation (). 3.Validation3.1.In vitro Validation: Polyvinyl Alcohol (PVA) PhantomValidation of the registration algorithm was first obtained through the use of an in vitro model of the coronary arteries. The use of PVA allows for the preparation of solutions that become opaque when processed through an increasing number of freeze/thaw cycles (FTCs). As a consequence, PVA cryogels are optically scattering and attenuating structures suitable for OCT imaging.23 Moreover, the mechanical properties of such phantoms allow for the correct implantation of intracoronary device systems mimicking stent placement in vivo. The phantom was made of PVA with a molecular weight of 70,000 (Sigma-Aldrich, St. Louis, MO). A 20% PVA/water solution was prepared by heating with temperatures kept below 100 °C. The solution was then placed in a tubular mold and three FTCs ( to 20 °C) of each were applied. The mold was created from a rectangular block of acrylic plastic () by drilling a cylindrical hole with a diameter of 12 mm. In addition, the block was cut longitudinally and axially, in proximity of the extremities, and kept together by eight screws. In this way, a mechanism for an easy extraction of the phantom from the mold, after the FTCs, was created. In addition, the phantom lumen was created inserting and fixing a metallic stick of a diameter of 3 mm in the middle of the mold. Figure 4 shows a picture of the mold and the phantom with relative dimensions.Next, a bare metal coronary stent (Multi-link, Abbot Vascular, Redwood City, CA) was placed in the phantom lumen through an inflation procedure at 1013 kPa. The length of the stent was 38 mm with a diameter of 3 mm. Finally, four metallic needles [visible by intravascular optical coherence tomography (IV-OCT)] with a diameter of 0.8 mm were punctured across the model at equidistant positions along the stent to create markers for the validation of the registration algorithm. 3.2.In Vitro Validation: Experimental SetupThe PVA phantom was fixed in a box filled with water. Images were acquired bending the phantom in different ways (single and double bending) simulating vessel tortuosity as illustrated in Fig. 5. Moreover, to mimic in vivo image acquisition, the OCT catheter was used under different degrees of bending: 0, 180, and (Fig. 5). Fig. 5Schematic diagram of the experimental setup. PVA-phantom presents a lumen diameter of 3 mm (comparable to the ones presented by the human coronary arteries) and vessel tortuosity is simulated with the use of fixed supports. The phantom is placed in a box filled with water allowing for a correct optical coherence tomography (OCT) imaging procedure. The catheter is illustrated under the three different bending conditions: 0, 180, and .  Indeed, among many other artifacts, IV-OCT data could be affected by a nonuniform rotation distortion: As the IV-OCT catheter transmitting the rotation is not rigid, the rotation velocity of the distal imaging device is not necessarily constant even if driven at a constant speed proximally.22 As the effect of such an artifact could affect the result of the registration procedure, the different bends of the OCT catheter (0, 180, and ) were induced to simulate “real-life” image acquisitions. For every bending angle, two pullbacks were acquired mimicking a BL and a FU study. Between subsequent acquisitions, the imaging catheter was taken out of the phantom lumen and re-inserted to avoid bias. All combinations of phantom and catheter bending were used resulting in 12 IV-OCT datasets. Validation of the algorithm was first obtained by applying the registration procedure to the in vitro datasets: The first acquisition with a catheter bending of 0 deg was registered with following acquisitions obtained at 0-deg as well as the 180-deg and datasets. The same procedure was repeated for the acquisitions at 180 deg and . Finally, the procedure was reapplied for different bending of the phantom simulating vessel tortuosity (single and double). 3.3.In-Vivo ValidationSubsequent to the in vitro validation, the accuracy of the registration in vivo was tested. In vivo data were acquired in the catheterization laboratories of the University Hospitals Leuven, Belgium, in the context of a randomized clinical trial (STACCATO, NTC01065519) that includes IV-OCT data both at the time of the initial stent implantation (BL data) and at nine-month FU. Two kinds of DES were used in the study: Xience V (everolimus eluting stent, Abbott Vascular, Redwood City, CA) and Biomatrix (biolimus A9 eluting stent, Biosensors, Morges, Switzerland). The same IV-OCT system and system settings were used for the in vitro acquisitions. All patients gave informed consent prior to the inclusion in the study and acquisition of the data. Validation of the registration algorithm in vivo was obtained in a similar way as for in vitro acquisitions. The registration algorithm was applied to data from six human patients. Landmarks based on image features were manually located through the pullback data and utilized to quantify registration errors. As landmarks, side-branches (SB) and only calcified plaques (CP) were taken into account as they are the most stable vessel features through time. Side-branches and CP partially hidden by the guide-wire shadow were excluded from the analysis. 3.4.Registration Error QuantificationTo avoid bias, during the in vitro image analysis and registration procedures, a mask was manually placed over the entire markers surfaces to exclude them from the analysis completely. The in vitro registration error for the translation along the longitudinal axis was quantified as follows: for every marker, an image was manually selected in both IV-OCT datasets and compared with the corresponding image automatically registered by the algorithm. The translation error was set equal to the distance between the images in the longitudinal axis direction. Subsequently, the in vitro registration error for the rotation along the longitudinal axis was quantified as the difference between the inclination of the two markers (Fig. 6). Both markers were manually identified. Importantly, the registration of both datasets did not use any information on the marker itself but this information was derived from the stent struts positions. The median and range of the above absolute values for error measures were computed over all nine registrations. Fig. 6Images from the PVA phantom showing examples of the quantification (in vitro) of the rotation error along the longitudinal axis. (a) The BL pullback in proximity of a marker. (b) The image automatically matched from the corresponding pullback obtained under a different degree of catheter bending. Registration error is computed as the difference between the angles and . 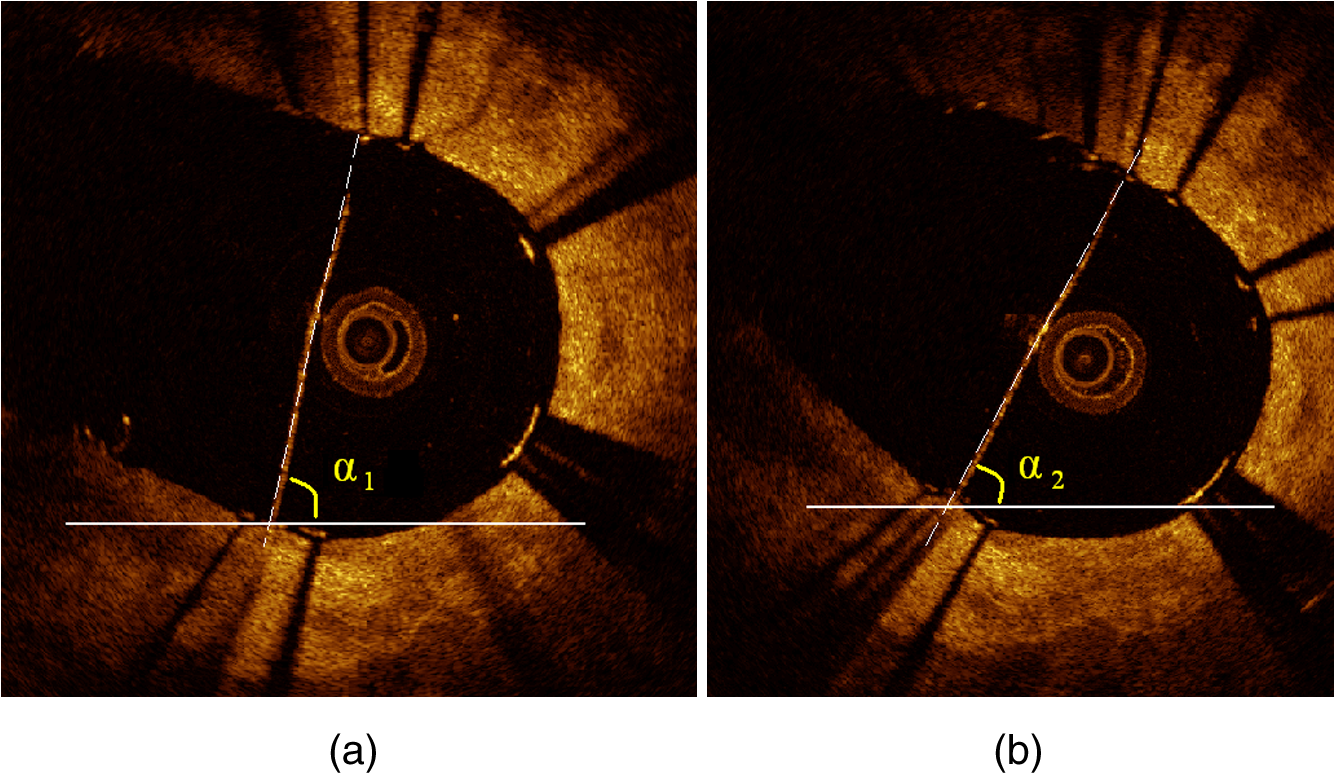 Quantification of in vivo data was obtained in a very similar way as done in vitro, with the exception that CP and SB were used as landmarks. Translation error was set as the distance along the longitudinal axes between corresponding images and rotation error equal to the different angle position of the landmarks in corresponding images (for details see Figs. 7 and 8). Median and range values of the absolute registration error were computed. A total number of 31 markers (18 CP and 13 SB) were located along the registered data from six patients. Fig. 7Example of in vivo validation. The quantification of the rotation error when a side-branch is used as marker is illustrated. The central point of the lumen (red dot) is manually located and the side-branch aperture delimited by two lines (gray lines). (a) The angle defined by the horizontal line and the line in the middle of the side branch represent image rotation. The registration error is set to be equal to .  Fig. 8Example of in vivovalidation. The quantification of the rotation error when a calcified plaque (CP) is used as marker is illustrated. The central point of the lumen (red dot) is manually located and the plaque dimension delimited by two lines (gray lines). The angle defined by the horizontal line and the line in the middle of the CP represent image rotation. The registration error is set to be equal to .  3.5.Image AcquisitionImages were acquired using an IV-OCT Fourier domain C7 system (St. Jude Medical, St. Paul, MN). The imaging system was used under default settings resulting in a pullback speed of and a frame rate of . Pullback length was set equal to , resulting in a frame distance of . The system uses a swept laser light source with a central wavelength of and full-width half-maximum bandwidth of 50 nm resulting in an axial resolution of to 15 μm in air and in biological tissue. Lateral resolution is equal to and the number of acquired -scan lines per seconds is 45,000. Laser source optical power is , scan range is equal to 5.44 mm in air and 3.8 mm in saline. 4.ResultsAn example of OCT imaging of the PVA phantom is given in Fig. 9. Examples of registration results are reported in Figs. 10 and 11. Fig. 9Example of intravascular optical coherence tomography (IV-OCT) system imaging the in vitro PVA phantom model. The cross-sectional image was extracted from a pullback imaging the stent segment. Light penetration was limited to approximately mm and backscattering intensity values resulted to be comparable to the ones obtainable in vivo. Struts appearance resulted to be consistent with in vivo acquisitions. As such, segmentation algorithm was successfully applied to both in vivo and in vitro data under the same parameters settings.  Fig. 10In vitro results of the registration automated procedure. (a) and (f) are taken from the model pullbacks. (b) and (g) contain the long axis corresponding images before the registration procedure (rotation). (c) and (h) contain the images after full registration. Lateral views correspond to both the model data (d) and (i) and to moving data (e) and (j). The presence and inclination of the marker proves the efficacy and accuracy of the registration algorithm. Model and moving data were acquired under different catheter bending conditions: 0, 180, and , respectively. 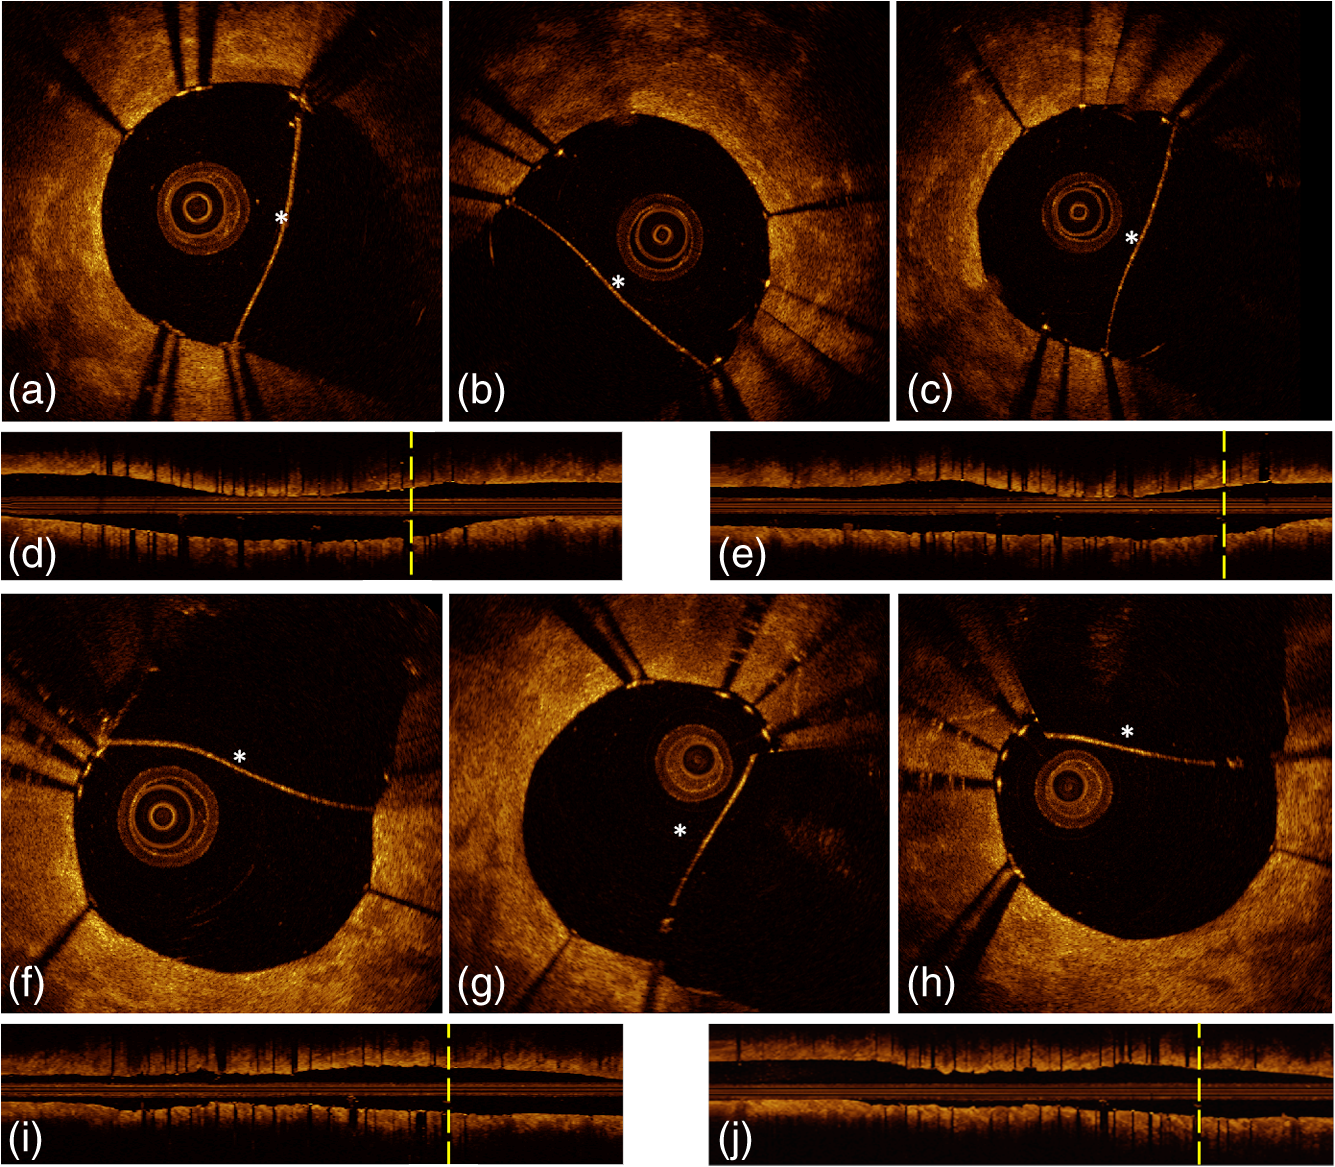 Fig. 11In-vivo results of the registration automated procedure. Baselines images [(a), (f), and (k)] compared with the nine-month FU examination [(c), (h), and (m)]. (b), (g), and (l) contain images before registration. *Indicates guide-wire shadows, † indicates SB, and green arrows indicate calcified plaques (CP). Lateral view on the left [(d), (i) and (n)] correspond to BL pullback, the ones on the right [(e), (j), and (o)] to FU. (a), (b), and (c) present an example of correct stent healing at FU (SB confirm registration results). (f), (g), and (h) show an example of acute stent strut malapposition resulting in late strut malapposition () (CP confirm registration results). (k), (l), and (m) show an example of intraluminal debris (thrombus—red arrows) (CP confirm registration results) “healed” at FU.  Quantification of in vitro data registration errors resulted in a mean translation error of 0.14 mm and a mean rotation error of 7.3 deg. No relevant changes in the accuracy of the algorithm were found when comparing data with increasing catheter bending as demonstrated in Table 1. Table 1In vitro validation results. The first column indicates the experimental setup and values for the phantom (to simulate vessel tortuosity) and catheter bending (0, 180, and 360+90 deg). Different IV-OCT datasets acquired under different catheter bending are compared each other. Four markers for every single setup (0 deg versus 0 deg—0 deg versus 180 deg, etc.) have been analyzed. Results are reported as: median value and range (minimum value to maximum value). The second and third columns indicate quantitative assessment of rotation and translation errors, respectively.
Quantification of in vivo registration errors resulted in a mean translation error of 0 23 mm and a mean rotation error of 10.1 deg. Detailed results of located markers and in vivo quantifications are reported in Table 2. Table 2In vivo validation results. Results are reported as: median value and range (min. value—max. value). The second and third columns indicate quantitative assessment of rotation εR and translation εT errors, respectively. Overall, 31 markers, calcified plaques (CP) and side branches (SB), localized on six human patients, were used for in vivo validation.
Figure 11 qualitatively illustrates in vivo results of the registration algorithm. Stent and vessel features (e.g., struts pattern, vessel side branches) are able to give qualitative visual confirmation of correct matches. The total processing time for the registration algorithm was (on average) running on a standard office PC. Details about processing time for stent segmentation can be found on the previous report.18 5.DiscussionAn algorithm for the registration of IV-OCT datasets over time was developed and validated. Both in vitro and in vivo validation showed excellent accuracy for the transformations—rotation and translation—required by the registration procedure. As such, the presented method allows detailed registration of IV-OCT data on individual image level. More specifically, the in vitro validation study showed that a specific region of an image could be found (on average) within 0.14 mm along the longitudinal axis () and 7.3 deg () with a registered FU data set. In vivo validation resulted in slightly higher but comparable errors of 0.23 mm and 10.1 deg for and respectively, proving the accuracy of the developed algorithm for clinical data. Moreover, taking into account in vivo validation results, it is possible to define a confidence interval (under statistical assumptions of normal distribution with a confidence level of 95%) of approximately frames and , allowing for comparison of specific regions of interest of an image with their match over time. A visual example of such intervals of confidence is illustrated in Figs. 12 and 13 both for translation and rotation. Fig. 12Example of the intervals of confidence for registration rotation accuracy ().Once a ROI is selected in the model data, the corresponding ROI could be located on the moving data with the use of such intervals of confidence. Images are extracted from in vivo data [baseline (BL) compared to the nine-month follow-up (FU)]. The red arrow is pointing to a lesion (i.e., intrastent dissection), which appeared to be healed nine months later.  Fig. 13Example of the intervals of confidence for registration translation accuracy (). Once a frame is selected in the model data, the corresponding frame could be located on the moving data with the use of an interval of confidence (), and was found to be equal to frame as shown in the image. Images are extracted from in vivo data [baseline (BL) compared to the nine-month follow-up (FU)]. 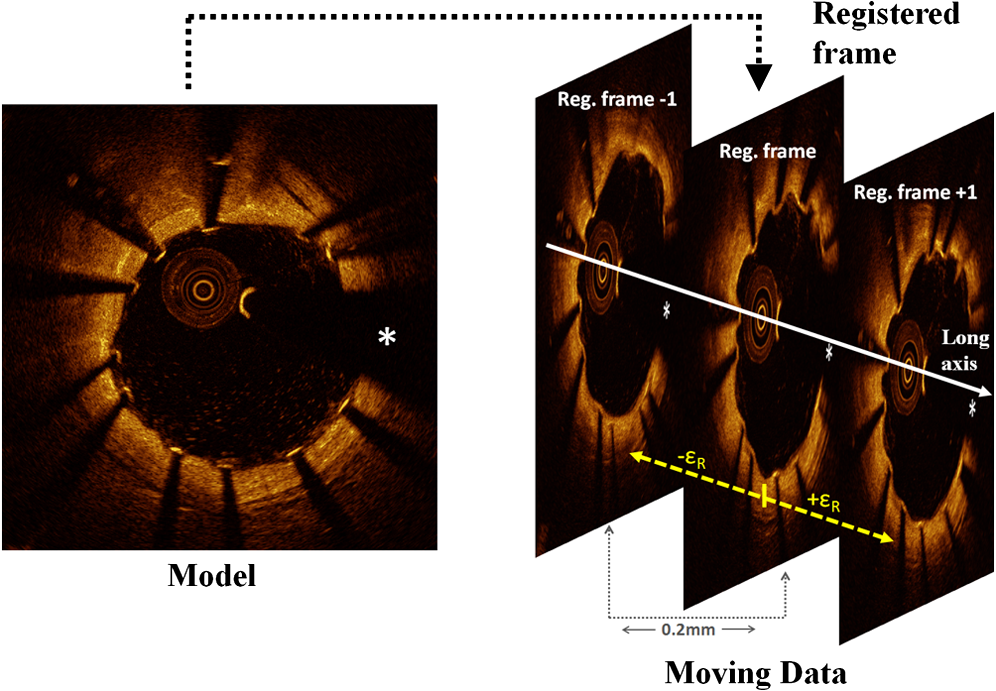 In addition, the application of the proposed method to in vitro acquisitions obtained under different degrees of catheter bending (e.g., 0 deg versus , Table 1) showed no relevant decrease of registration accuracy. As catheter bending has been proven to cause NURD artifacts,22 validation results showed that the refinement of the registration to a local level enables to deal with such artifacts correctly. Figure 14 illustrates both the effect of vessel remodeling and different OCT catheter and guide-wire positions, when comparing BL to FU acquisitions. As shown by the example, the vessel remodeling is able to affect the image appearance significantly modifying its intensity map. Moreover, as catheter positions typically vary across different IV-OCT acquisitions, different stent struts’ shadows orientation would cause additional intensity changes to the images. The proposed registration approach (i.e., landmark-based methodology) has proven to be a powerful solution as—once stent struts are correctly segmented18—it is independent of the images intensity levels. Different approaches, as intensity-based registration methods, would encounter additional challenges to deal successfully with the presence of such effects. Fig. 14Example of in vivo OCT image registration procedure [baseline (BL) and nine-month follow-up (FU)]. (a) The model image. (b) The registered images along the longitudinal axis but not yet rotated. (c) The final registration. Red arrows indicate the effect of vessel remodeling and yellow arrows [in (a) and (b)] show the effect of catheter position on shadow orientation. Both vessel remodeling and the effect of catheter position would represent an additional challenge for intensity based registration methods. 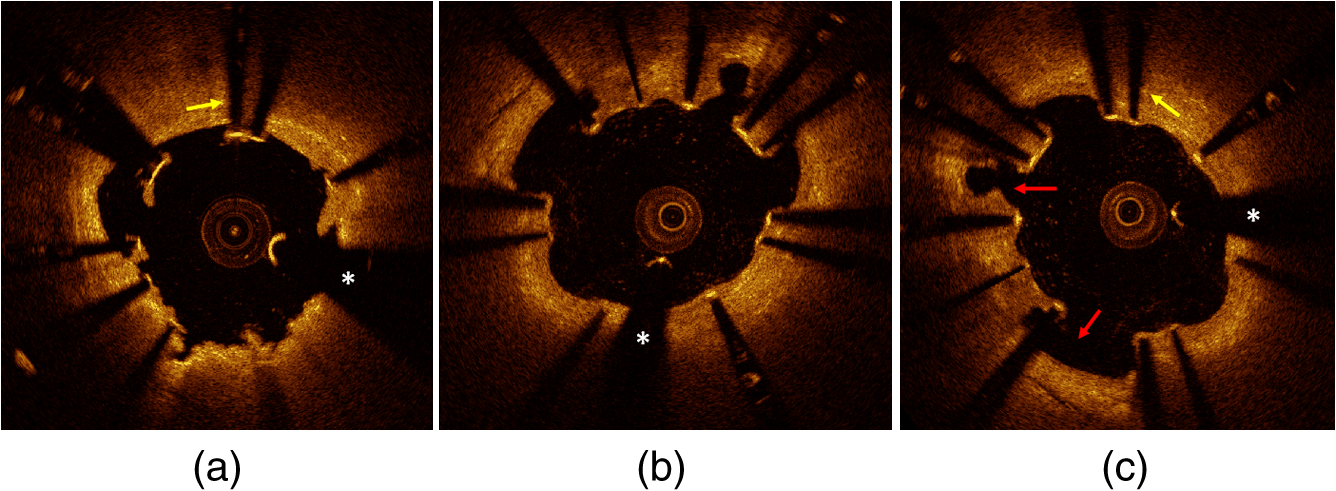 A specific factor that could influence the registration procedure is the accuracy of the stent strut segmentation procedure. The use of PVA phantoms (Fig. 9) ensures the development of a model that, once visualized by the IV-OCT imaging system, results in a lumen-vessel interface of very similar appearance to the one typically encountered in-vivo.23 However, quality often degrades in real-life IV-OCT in vivo image data in case of interfering artifacts (e.g., excessive amount of blood in the vessel lumen). However, automated stent strut segmentation has already been shown to correlate well with manual reading seven in case of suboptimal IV-OCT image quality.18 Moreover, in the case of very poor image quality, the software package used to apply the stent segmentation allows the user to visually inspect the results and, if needed, quickly manually correct. Catheter eccentricity is an artifact that may influence stent strut orientation, which is often present in IV-OCT acquisitions. To deal with the presence of this artifact, as illustrated in Sec. 2.2 and in a previous publication,18 our methods rely on the central points of the stent struts. To evaluate the accuracy of this approach we quantified the results of strut segmentation in a subset of 20 images, half presenting a strong catheter eccentricity and the other half not showing eccentricity at all. Individual struts apposition and coverage were automatically quantified by the segmentation algorithm and compared with the ground truth. Ground truth corresponds to manual assessment of stent struts obtained through the use of a commercial available workstation (St. Jude Medical, St Paul, MN).18 Mean absolute differences between automated measures and the ground truth were, respectively: for the subset presenting strong eccentricity and for the subset not presenting any eccentricity (0 false positives and 4 false negatives, of a total of 145, in strut detection were generated by the segmentation algorithm). Such results prove that the proposed approach is able to manage correctly the presence of this very common artifact during the segmentation procedure. Therefore, as the registration algorithm is directly linked to the stent segmentation, catheter eccentricity would not have a significant impact on the accuracy of the registration procedure. As near-infrared light cannot penetrate through metallic structures, the use of metallic markers and the presence of the guide-wire for in vivo acquisitions, cause the presence of “gaps” in the stent model. However, as the entire stent is used as a landmark by the registration procedure and it usually comprehends a very large number of struts (), the presence of such gaps does not play a relevant role for the registration procedure. In addition, the pullback speed used during acquisition, in combination with the system frame rate, could have an effect on the accuracy of the registration procedure. In this study, default system settings () for the employed OCT system were utilized for images acquisition. While increasing pullback speed reduces acquisition time, it also decreases the total number of frames acquired and, therefore, the number of detectable stent-struts that can be used for the registration. On the other hand, motion artifacts due to heartbeat may be smaller when limiting acquisition time. The net effect of increasing/decreasing the pullback speed on the proposed method thus remains unclear and will require further investigation. Similarly, increased frame rate will result in more information for the registration algorithm (for a given pullback speed), which will likely be of benefit. In vivo validation of the algorithm was performed by the use of two different stent platforms. Validation results show very similar accuracy for one platform if compared to the other: an absolute mean rotation error of 12.5 deg was found in one case, 9.2 deg for the other. However, an exhaustive validation of the algorithm accuracy for different devices requires a large database of BL and FU in vivo IV-OCT data for many stent platforms. Further investigation would be required to address this issue fully. Finally, a graphical user interface (GUI) has been developed for practical use of the registration algorithm in CoreLabs and clinical research projects. Through this interface, the user can easily and quickly compare cross-sectional images of registered IV-OCT. An example of the GUI displaying in vivo data is presented in Fig. 15. Fig. 15Graphical user interface (GUI) for a user-friendly application of the registration algorithm. Left image corresponds to in vivo baseline (BL) data (model), while (b) shows the FU data (moving data). White arrows point at the same struts in both images and right image shows a relevant vessel remodeling. Yellow arrows point to a calcified plaque qualitatively confirming accuracy of the registration procedure. The lower part of the GUI presents lateral views of the Intravascular optical coherence tomography (IV-OCT) pullbacks, stent three-dimensional model after registration (both for global and local level) together with relative cost-functions. Moreover, tools for a manual refinement of results (if needed) are located on the lower right. 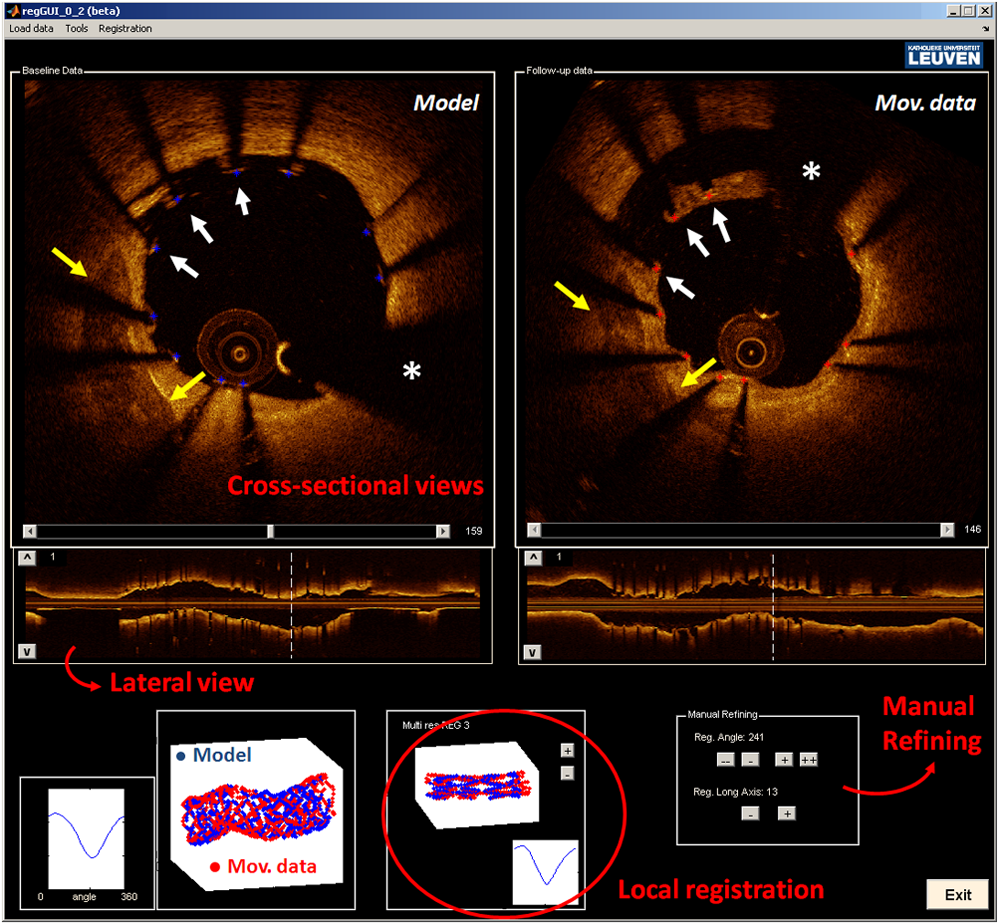 6.Limitations and Further DevelopmentsIn our registration algorithm, we assumed that vessel remodeling only causes relatively small deformations of the stent structure, as such large deformations would result in a loss of accuracy. Because bare-metal and DES are very rigid metallic frameworks inflated at high pressures in clinical practice (typically above 10 to 12 atmospheres), we only expect relatively small geometrical deformations to occur in vivo as proven by our validation study. In any case, as the initialization procedure is able to put the two cylindrical point sets in approximate registration, a nonrigid ICP implementation24,25can be incorporated in our algorithm for further development for new applications (e.g., less-rigid self-expandable stents or different tubular structures registration). An additional limitation is given by the fact that, as the proposed registration method is based on the use of a landmark, the algorithm is only able to register permanent implanted metallic (i.e., DES and BMS) stented regions of vessels. As such, the proposed methodology cannot be applied to native unstented sections of vessels. 7.ConclusionsWe demonstrated that IV-OCT datasets acquired over time can be registered and matched automatically on an image level by the proposed methodology. Validation results showed a high degree of accuracy proving that the method can be applied reliably to in vivo data. As a result, the proposed algorithm allows detailed assessment of the vessel response to stent implantation giving valuable information about mechanisms of stent failure, vessel pathophysiology after stenting, and performances of new generations of DES or novel stent platforms. Moreover, it may improve identification of procedural predictors of late clinical events, opening new perspectives for improving current therapeutic strategies. AcknowledgmentsThe research program is supported by Grant G.0690.09N of the Research Foundation-Flanders (FWO) and KU Leuven IOF grant ZKC2992. Tom Adriaenssens is supported by a Clinical Doctoral Grant of the FWO. Peter Sinnaeve is a Clinical Investigator for the FWO. ReferencesP. W. Serruyset al.,
“A comparison of balloon-expandable-stent implantation with balloon angioplasty in patient with coronary artery disease,”
N. Engl. J. Med., 331
(8), 389
–495
(1994). NEJMBH Google Scholar
A. M. SalamJ. Al SuwaidiD. R. Holmes,
“Drug eluting coronary stents,”
Curr. Probl. Cardiol., 31
(1), 8
–119
(2006). http://dx.doi.org/10.1016/j.cpcardiol.2005.09.002 0146-2806 Google Scholar
S. Cooket al.,
“Incomplete stent apposition and very late stent thrombosis after drug-eluting stent implantation,”
Circulation, 115
(1), 2426
–2434
(2007). CIRCAZ 0009-7322 Google Scholar
G. Guagliumiet al.,
“Strut coverage and late malapposition with paclitaxel-eluting stents compared with bare metal stent in acute myocardial infarction,”
Circulation, 123
(1), 274
–281
(2011). http://dx.doi.org/10.1161/CIRCULATIONAHA.110.963181 CIRCAZ 0009-7322 Google Scholar
J. W. Moseset al.,
“Sirolimus-eluting stents versus standard stents in patients with stenosis in a native coronary artery,”
New Engl. J. Med., 349
(14), 1315
–1323
(2003). NEJMBH Google Scholar
S. Cooket al.,
“Incomplete stent apposition and very late stent thrombosis after drug-eluting stent implantation,”
Circulation, 115 2426
–2434
(2007). CIRCAZ 0009-7322 Google Scholar
A. V. Finnet al.,
“Vascular responses to drug eluting stents: importance of delayed healing,”
Arterioscler. Thromb. Vasc. Biol., 27
(1), 1500
–1510
(2007). Google Scholar
S. J. Kanget al.,
“Optical coherence tomographic analysis of in-stent neoatherosclerosis after drug-eluting stent implantation,”
Circulation, 123
(1), 2954
–2963
(2011). http://dx.doi.org/10.1161/CIRCULATIONAHA.110.988436 CIRCAZ 0009-7322 Google Scholar
G. J. Tearneyet al.,
“Three-dimensional coronary artery microscopy by intracoronary optical frequency domain imaging,”
J. Am. Coll. Cardiol. Imag., 1
(6), 752
–761
(2008). Google Scholar
G. GuagliumiV. Sirbu,
“Optical coherence tomography: high resolution intravascular imaging to evaluate vascular healing after coronary stenting,”
Catheter Cardio. Intervent., 72
(2), 237
–247
(2008). Google Scholar
N. Guoet al.,
“Incidence, mechanisms, predictors, and clinical of acute and late stent malapposition after primary intervention in patients with acute myocardial infarction: an intravascular ultrasoud substudy of the harmonizing outcomes with revascularization and stent,”
Circulation, 122
(1), 1077
–1084
(2010). http://dx.doi.org/10.1161/CIRCULATIONAHA.109.906040 CIRCAZ 0009-7322 Google Scholar
S. Cooket al.,
“Incomplete stent apposition and very late stent thrombosis after drug-eluting stent implantation,”
Circulation, 115
(1), 2426
–2434
(2007). CIRCAZ 0009-7322 Google Scholar
E. S. Shinet al.,
“Comparison of acute vessel wall injury after self-expanding stent and conventional balloon-expandable stent implantation: a study with optical coherence tomography,”
J. Invasive Cardiol., 22
(9), 435
–439
(2010). 1042-3931 Google Scholar
G. J. Tearneyet al.,
“Quantification of macrophage content in atherosclerotic plaques by optical coherence tomography,”
Circulation, 107
(1), 113
–119
(2003). http://dx.doi.org/10.1161/01.CIR.0000044384.41037.43 CIRCAZ 0009-7322 Google Scholar
N. Gonzaloet al.,
“Optical coherence tomography patterns of stent restenosis,”
Am. Heart J., 158
(2), 284
–293
(2009). http://dx.doi.org/10.1016/j.ahj.2009.06.004 0002-8703 Google Scholar
Y. Suzukiet al.,
“In vivo comparison between optical coherence tomography and intravascular ultrasound for detecting small degrees of in-stent neointima after stent implantation,”
J. Am. Coll. Cardiol. Intv., 3
(1), 76
–84
(2010). Google Scholar
A. Murataet al.,
“Accuracy of optical coherence tomography in the evaluation of neointimal coverage after stent implantation,”
J. Am. Coll. Cardiol. Img., 3
(1), 76
–84
(2010). Google Scholar
G. J. Ughiet al.,
“Automatic segmentation of in-vivo intra-coronary optical coherence tomography images to assess stent strut apposition and coverage,”
Int. J. Cardiovas. Imag.,
(2011). Google Scholar
H. G. Bezerraet al.,
“Intracoronary optical coherence tomography: a comprehensive review,”
J. Am Coll. Cardiol. Intv., 2
(11), 1035
–1046
(2009). Google Scholar
J. P. BeslD. N. McKay,
“A method for registration of 3-D shapes,”
IEEE Trans. Pattern Anal., 12
(2), 239
–255
(1992). ITPIDJ 0162-8828 Google Scholar
A. RuinaR. Pratap,
“Vectors: position, force and moment,”
Introduction to Statics and Dynamics, 121
–136 Oxford University Press, Oxford, UK
(2011). Google Scholar
G. van SoestG. J. A. BoschF. W. A. van der Steen,
“Azimuthal registration of image sequences affected by nonuniform rotation distortion,”
IEEE T. Inf. Technol. B., 12
(3), 348
–355
(2008). http://dx.doi.org/10.1109/TITB.2007.908000 1089-7771 Google Scholar
C. E. Bisaillonet al.,
“Multilayer tubular phantoms for optical coherence tomography,”
Proc. SPIE, 7567 75670I
(2010). http://dx.doi.org/10.1117/12.842955 PSISDG 0277-786X Google Scholar
H. ChuiandA. Rangarajan,
“A new point matching algorithm for non-rigid registration,”
Comput. Vis. Image Und., 89
(2–3), 114
–141
(2003). CVIUF4 1077-3142 Google Scholar
D. HähnelS. ThrunandW. Burgard,
“An extension of ICP algorithm for modeling nonrigid objects with mobile robots,”
in Proceedings of the Sixteenth International Joint Conference on Artificial Intelligence (IJCAI),
915
–920
(2003). Google Scholar
|


