|
|
1.IntroductionFluorescent dyes are useful tools for detecting protein and imaging protein interactions in cells. However, fluorescent dyes can generate reactive oxygen species (ROS) during illumination, are susceptible to photobleaching, and at times provide insufficient signal to noise ratios in cell culture.1,2 One solution has been semiconductor crystals (quantum dots), which have a higher brightness and photostability, a high quantum yield, and high extinction coefficients. Unfortunately, quantum dots have potential cell toxicity depending on multiple factors including size, charge, concentration, and type of coating,3 which restricts their application for in vivo studies.4 Recently developed biocompatible magneto-fluorescent silica quantum dots show potential for biomedical application,5 although there is little data on their toxicity in vivo and in vitro. Pure gold nanoparticles are a promising material for biomedical applications due to their unique optical properties, including surface plasmon resonance (SPR), photostability, tuning to the near infrared (NIR), and low-toxicity. Any recent concerns about gold toxicity have been related to the surface coating,6,7 and not to the gold itself. The SPR reflectance wavelength of small (4 to 40 nm) spherical pure gold nanoparticles when unaggregated and exposed to white light is 510 to 530 nm. Forming small aggregates of gold nanoparticles increases the scattering cross section per particle, shifting the plasmon resonance reflectance frequency to the NIR. Nanorods under white light exposure also have reflectance in the NIR due to high aspect ratios.6 These properties of gold nanoparticles have many applications in biology and medicine.7–9 Gold nanoparticles also possess fluorescent properties. Bulk gold material has a weak fluorescent signal with a low quantum yield of (Ref. 10). However, small gold nanoparticles and nanoclusters () possess more intense fluorescence,1,11,12 with quantum yields as high as to .13,14 The mechanism of this fluorescence is not completely understood, but quantum mechanisms have been proposed,14–16 and the mechanism can be distinguished from SPR and Raman emission.14 Small gold nanoclusters less than 1 to 2 nm in diameter and consisting of 25 gold atoms have also been shown to produce emissions with quantum yields as high as 6%.11 These nanoparticles show promise for in vivo identification of tissue-based macrophages, however, their small size makes them unpractical due to first-pass removal by the liver, providing insufficient time for uptake by macrophages in vulnerable atherosclerotic plaques.17 Recently, we developed gold nanoclusters (nanoroses) that are composed of iron oxide clustered cores coated with a thin layer of gold, resulting in a rough surface topography.18 Nanoroses are 30 nm in size and possess a dextran coating to maximize uptake by macrophages via mannose receptors. Their small size allows nanoroses to avoid rapid clearance by the reticulo-endothelial system, providing sufficient time in the circulation for the particles to enter atherosclerotic lesions and be engulfed by macrophages in these plaques. Further, nanoroses are biodegradable due to their cluster chemistry, and nontoxic due to their composition of inert substances including iron oxide and gold, implying the potential for clinical applications. In the present study, we focus on the observation that clustering enhances the luminescence of gold.12,13,19 Further, we determine the effect of aggregation, coating thickness, and distribution of gold on the luminescence of nanoparticles. To this end, the luminescent behavior of nanoroses aggregated in gel phantoms and macrophage cells are investigated. Luminescence properties of nanoroses are compared to leading gold nanoparticles published in the literature, including nanorods,14 and nanoshells,20 as well as to nanoroses of varying size and gold composition (thin knobby—original nanorose versus thin round and thick knobby). As a control fluorescent nanoparticle, Cy5 conjugated iron oxide nanoparticles are also studied. 2.Materials and Methods2.1.Nanoparticle Synthesis and Characterization2.1.1.NanorosesAll reagents were of analytical grade. Ferrous chloride, ammonium hydroxide, hydroxylamine hydrochloride, nitric acid, and sodium hydroxide were purchased from Fisher Chemicals (Fairlawn, NJ). Ferric chloride was purchased from Acros Organics (Morris Plains, NJ). Citric acid was purchased from EM Science (Gibbstown, NJ). trihydrate was purchased from MP Biomedicals LLC. (Solon, OH). mPEG-SH was purchased from Nanocs, Inc. (New York, NY). Original nanorose (thin knobby) synthesis and characterization were performed as described previously.18 Additional nanoroses of varying size and gold composition (thin round and thick knobby) were prepared. Iron oxide nanoclusters synthesis was performed by a modification of the method described by Sahoo.21 These nanoclusters were dispersed in deionized water with vigorous stirring to produce 100 ml of a dispersion. To adjust the pH to 9.3, 320 μL of 7% by weight ammonium hydroxide was added for different initial pH values, corresponding lower amounts of ammonium hydroxide were added to the reaction mixture. Two milliliters of 1% () hydroxylamine hydrochloride was added as the reducing agent for the Au precursor. Four methoxylPEG-SH (PEG MW 20,000) solution was added to provide steric stabilization. Two milliliters of solution () was added to the reaction mixture to obtain an mass ratio of 0.5 in all cases. From visual observation, the color of the initial iron oxide dispersion was brown and did not change for a few seconds after addition of the Au precursor. Next, the dispersion became slightly turbid, and the color rapidly changed to greenish-brown. When the color change to greenish-brown started, the reactions were quenched with 1% nitric acid down to a pH of below 6 to ensure minimal further nucleation. The solution was allowed to stand with constant stirring for half an hour to allow time for further mPEG-SH reaction with the surface of Au coatings. The reaction mixture was then centrifuged at 6000 rpm for 6 min to separate the Au-coated particles from the uncoated iron oxide particles. The precipitates were redispersed by using 1 ml of dilute mPEG-SH solution () and bath-sonicated for five minutes to produce a colloidally stable suspension. Basic differences in synthesis of thin knobby (original nanoroses), thin round and thick knobby are presented in Table 1. Basic characterization of different iron oxide-gold nanoclusters presented in Table 2. Table 1Basic differences in synthesis of thin knobby (original nanoroses), thin round, and thick knobby.
Table 2Characterization of different iron oxide-gold nanoclusters (nanoroses).
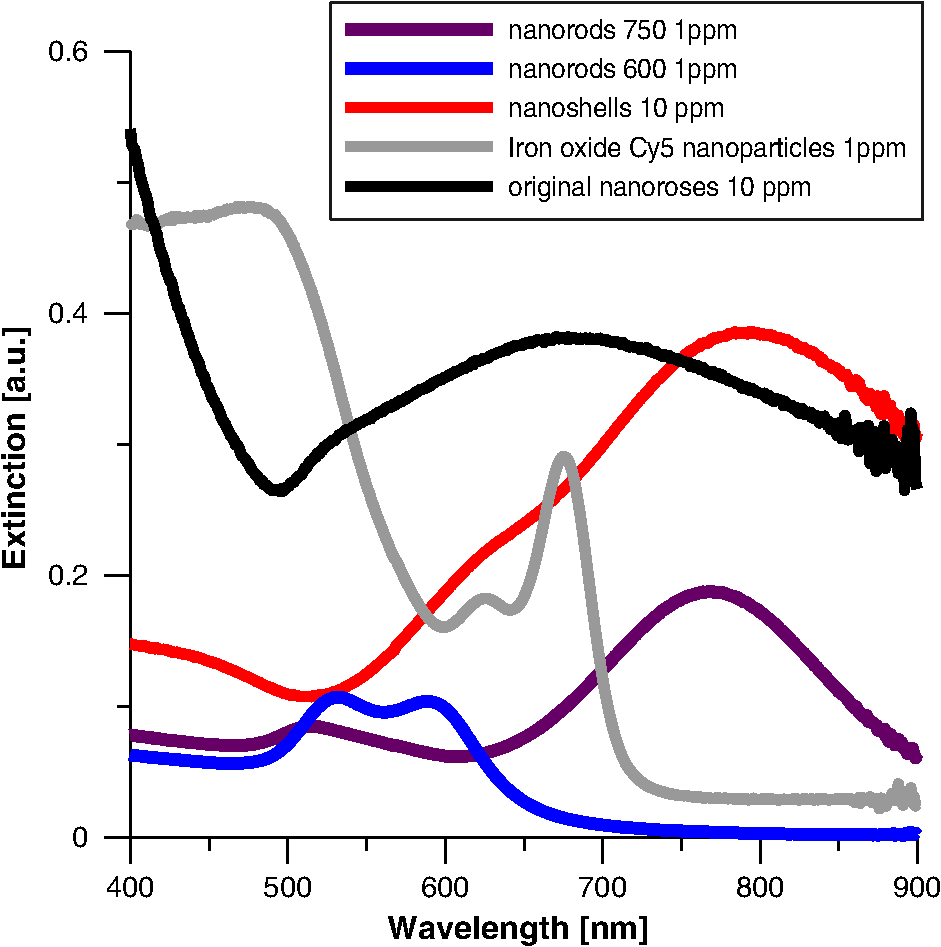
2.1.2.NanoshellsNanoshells were purchased from NanospectraBiociences (Houston, TX) and consisted of 120-nm diameter silica cores coated with 15-nm–thick gold shells, the later composed of 1 to 2 nm gold spheres covering the surface. The concentration used was particles in ml. The nanoshells were synthesized using the seed-mediated method of Duff et al.22 2.1.3.Nanorods/750The nanorods purchased from Nanopartz, Inc. (Loveland, CO), were pure gold in size. The concentration used was particles per ml, and they were synthesized using the method developed by Jana.23 2.2.Phantom StudyGel phantoms (G9382, Sigma) were composed of 50% gelatin and deionized (DI) water. Nonaggregated nanoparticles were dispersed in DI water with gelatin at a concentration nanoparticles per ml. Aggregated nanoparticles in phantoms were prepared from pellets of gold nanoparticles after overnight incubation with highly saturated NaCl solutions. Gold nanoparticles were mixed with 50% gelatin in a hot-water bath (60°C) to prepare final concentrations of nanoparticles (for both aggregated and nonaggregated), and 25 μL of gel with nanoparticles were cover slipped on a glass microscopic slide, air-dried overnight, and imaged the following day. 2.3.Peritoneal Macrophage Cell Culture StudyNanoparticles were evaluated in primary peritoneal macrophage cultures harvested from C57/blk6 mice. Isolation of macrophages was performed as described.24,25 After isolation macrophages were grown in Dulbecco’s modified Eagle’s medium, DMEM (Sigma, MO) with 10% FBS (Hyclone, Logan, UT), 2 mM L-glutamine, penicillin (), and streptomycin ().Macrophages were grown on dual chamber slide for two to three days (Lab Tek, Rochester, NY) at 37°C and 5% before the addition of nanoparticles. Nanoparticles were incubated at nanoparticles per well for 24 h at 37°C. For time-course studies, macrophages were incubated with nanoparticles for 1, 4, and 24 h followed by washing with PBS , fixation with 4% formaldehyde, and sealing of the coverslip with Fluoromount (Sigma-Aldrich, Saint Luis, MO) before imaging. For TEM analysis peritoneal macrophages were isolated from the mice as previously described, placed in Teflon-coated Petri dishes (Welch Fluorocarbon, NH) with DMEM (Sigma, MO) with 10% FCS (Hyclone, Logan, UT), 2 mM L-glutamine, penicillin (), and streptomycin ().Macrophages were grown on Teflon dishes for two to three days (Lab Tek, Rochester, NY) at 37°C and 5% before addition of nanoparticles. Nanoparticles were added in a concentration of particles per plate for 24 h. Before fixation cells were placed in 4°C for 1 h and after macrophages detached they were fixed with a mixture of 2.5% glutaraldehyde, 2% (para)formaldehyde in 100 mM cacodylate buffer (pH 7.0) with 2 mM by mixing equal volumes of fixative and cell suspension for two days at 4°C. Cells were postfixed with 1% in 0.1 M PB for 1 h, washed several times with PBS, and dehydrated and embedded in epoxi-resin. Macrophage imaging was performed with transmission electron microscopy (TEM) using a Philips 208 system with digital imaging system. Determination of the number of nanoparticles per macrophage is described in the Supplementary section. 2.4.Optical and TEM ImagingLuminescence was detected with an Olympus IX FV1000 confocal microscope with a spectral scanning system, employing a 2 mW diode laser with excitation wavelength of 635 nm. Laser light was focused and collected with a UPLSAPO objective, , and numerical aperture (NA) 1.46. Light was delivered to the sample with an beam splitter. Spectral luminescence profiles were collected between 600 and 800 nm, with 2 nm resolution. For visualization of luminescence from different types of nanoparticles, 0.4 mW laser power was used due to the high signal produced by the nanoshells. For visualization of different types of nanorose, 2 mW laser power was used. Finally, for differential interference contrast (DIC), images were collected in transmittance mode, while luminescence images were recorded in reflectance mode. 2.5.Determination of the Number of Nanoparticles per MacrophageA slightly modified formula26 was applied to transform the two-dimensional (2-D) TEM determination of the number of nanoparticles per macrophage, to a three-dimensional (3-D) volume. Given a 2-D TEM image, the diameter of the section () will be much more than the average distance between nanoparticles (). We can calculate the average distance between nanoparticles as: where is the number of particles in the macrophage and is the macrophage cross-sectional area.If we employ a spherical configuration,, then Eq. (1) can be rewritten: and the volume of the macrophage is given as: where is the macrophage diameter. The volume that one nanoparticle will occupy, given spherical symmetry, is as follows: The number of the nanoparticles in a single macrophage can be written as:The number of nanoparticles per macrophage were determined by averaging results from macrophages per each type of nanoparticle. 3.ResultsWe observed luminescence signals from gold nanoclusters under confocal microscopy at 635 nm excitation with an emission range of 600 to 800 nm. Although gold nanoparticles have different coatings (PEG-SH and dextran) they all produced two peaks of luminescence. Additional organic molecules, which were also contained in the gold nanoparticles (poly-vinyl alcohol (PVA) and citric acid, did not produce any autoluminescence. Luminescence from gold nanoparticles was reproducible on two different confocal imaging systems, Leica and Zeiss. Luminescence from colloid nanorose dispersions could not be detected with a standard ultraviolet-visible (UV-VIS) spectrofluorimeter. Further, luminescence was also not detectable from aggregated nanorose in either gelatin or macrophage cells when a conventional epi-fluorescent wide-field microscope (Leica DM6000 M) was used. Luminescence of nanoroses could be observed by confocal microscopy when nanoparticles were aggregated and placed in gelatin phantoms or after nanoparticle uptake by macrophages, described in greater detail in the next section. 3.1.Phantom Studies of NanoparticlesTo determine the impact of nanoparticle aggregation on gold-induced luminescence, a phantom study using artificially aggregated and nonaggregated nanoroses in gelatin was performed. Laser-induced luminescence of nanoroses was measured at 635 nm with confocal microscopy and emission spectra between 600 and 800 nm wavelengths were collected for analysis. The extinction spectra for all nanoparticles are shown in Fig. 1, with typical phantom results shown in Fig. 2. Fig. 2Phantom studies of nanoparticles. Two peaks of luminescence with confocal of nonaggregated and aggregated gold nanoparticles are shown.  No emission peaks were observed when the nanoroses were dispersed in the gelatin in a nonaggregated state (). However, two emission peaks were observed at 650 to 670 nm and 745 to 760 nm () when the nanoroses were aggregated prior to embedding into the gelatin. The first emission peak detected at 650 to 670 nm was stronger than the second peak at 745 to 760 nm. Next, we compared the luminescent properties of nanoroses with other commercially available gold nanoparticles of varying coating thickness and composition, including nanoshells, and nanorods with either a maximal extinction at 600 nm (nanorods/600) orat 750 nm (nanorods/750). The extinction spectra of these nanoparticles are shown in Fig. 1. Nanorods/600 and nanoshells produced the same two peaks of luminescence at the same wavelengths as nanoroses (, Fig. 2). Further, nanoshells have the same two fluorescent peaks without aggregation (). Nanorods/750 with an extinction maximum away from the excitation frequency of 635 nm did not produce luminescence when analyzed in a colloid state, but were weakly luminescent when aggregated. 3.2.Studies of Nanoparticles Engulfed by MacrophagesTo examine the impact of gold aggregation in a biological system, nanoparticles were examined after uptake by macrophages. Typical results are shown in Fig. 3(a) and quantitative results are shown in Fig. 3(b). All gold nanoparticles that aggregated within macrophages demonstrated the same two luminescent emission peaks as in the gelatin phantom studies. In Fig. 3(a), nanoshells produced a stronger luminescence compared to original nanoroses. The luminescence intensity per macrophage (2000 pixels analyzed per macrophage) was calculated and the mean luminescence from 20 macrophages was plotted. Figure 3(b) shows that nanoshells produced approximately four times stronger signals than original nanoroses. At an emission wavelength of 650 to 670 nm Cy5 conjugated iron oxide nanoparticles produced approximately 1.5-fold the signal intensity of original nanoroses, but did not have the second luminescent peak at 745 to 760 nm we observed for other gold nanoparticles. Nanorods/600 and nanorods/750 both produced two luminescent peaks, but the intensity of both peaks were weak and half that measured for original nanoroses. Despite being tuned to the excitation frequency of 635 nm, nanorods/600 were not superior to nanorods/750, because nanorods/600 do not have a surface coating that is as ideal for cellular uptake. In contrast, Nanorods/750 are coated with polyethylene glycol (PEG), which does not prevent uptake by macrophages in culture. Due to the weakness of the luminescence of both nanorods, they were not included in the quantitative comparison of nanoparticles presented in the next section. Fig. 3(a). Confocal images of various near-infrared nanoparticles in macrophages cell culture. Gray upper panels are differential interference contrast microscopy images (DIC) of macrophages, and two red lower panels represent luminescent images at two wavelengths at 650 to 670 and 745 to 760 nm. Second emission at 745 to 760 nm was not observed from Cy5 iron oxide nanoparticles. (b). The calculated luminescence intensity profile from macrophages/each nanoparticles, shows that nanoshells produced a signal approximately four times stronger than original nanoroses.  3.3.Luminescent Intensity of NanoparticlesTo determine the impact of differing morphologies of surface gold on luminescence, the relative luminescent intensities of the two brightest gold nanoparticles (nanoshells and nanoroses) were compared in a more quantitative fashion to Cy5 conjugated nanoparticles (Table 3).The average number of nanoparticles per macrophage was determined by counting individual nanoparticles identified by transmission electron microscopy (TEM) with Image J. Twenty macrophages were analyzed per type of nanoparticles, and the mean results are presented. Because Cy5 conjugated nanoparticles and Cy5 molecules are below the resolution of TEM, the number of these nanoparticles and molecules per macrophage was taken from the literature.27 Table 3Luminescent intensity of nanoshells, original nanoroses, and Cy5 iron oxide nanoparticles and molecules.
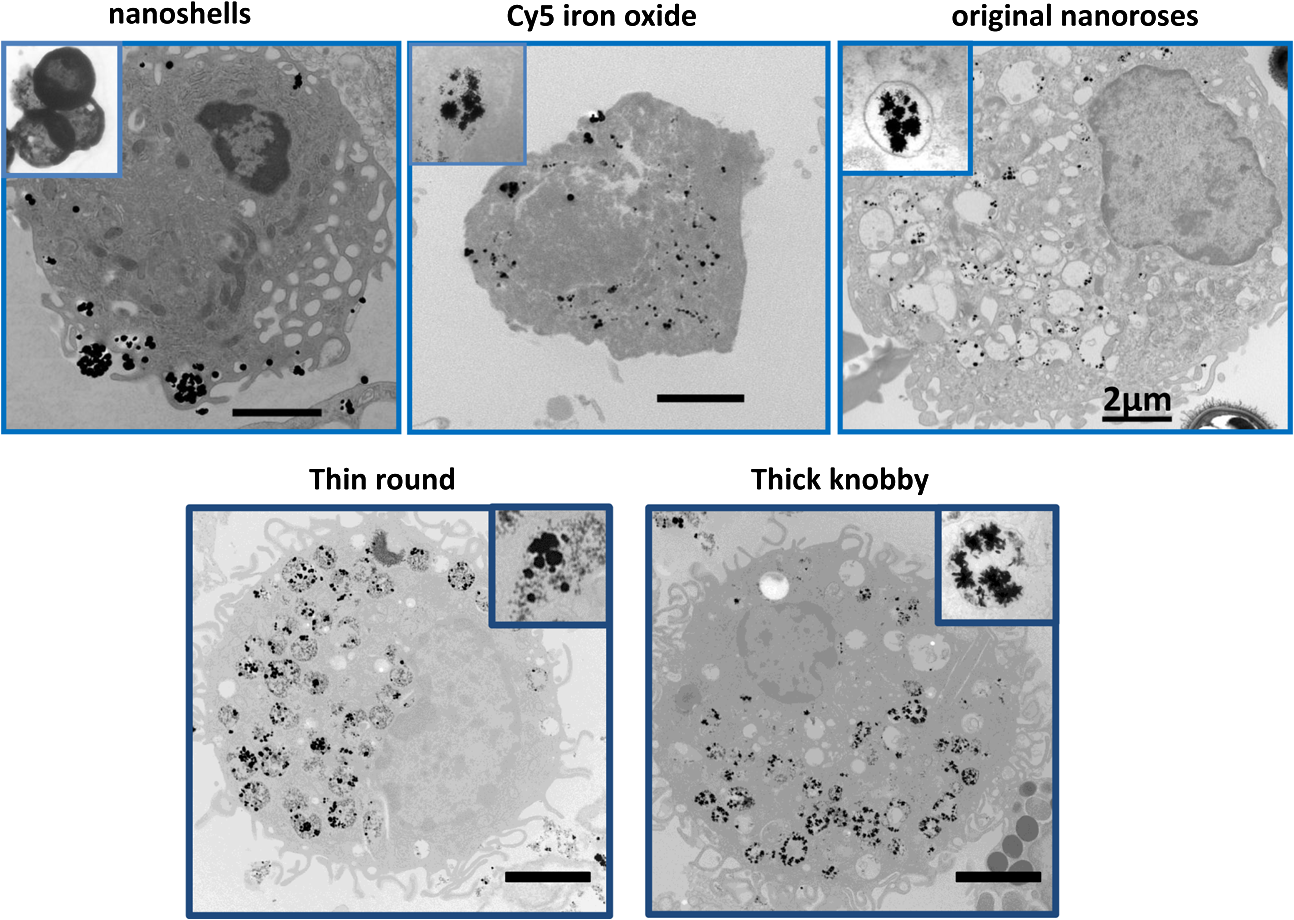
Figure 4 shows the typical appearance of nanoparticles’ accumulation and distribution inside macrophages. Due to their larger size, nanoshells localized in the cytoplasm close to the cell plasma membrane, while the smaller original nanoroses and Cy5 conjugated iron oxide nanoparticles were located within deeper cellular structures. For original nanoroses, particles/macrophage was determined, whereas nanoshells were less concentrated in macrophages ( particles/macrophage). For Cy5 conjugated nanoparticles and Cy5 molecules, published values of 96,000 and 288,000, respectively, were used per macrophage.27 The luminescence intensity per macrophage at 650 to 670 nm emission was greatest for nanoshells, followed by Cy5 conjugated nanoparticles and Cy5 molecules, followed by original nanoroses (Table 3, ). Further, the brightness per nanoparticle or molecule was greatest for nanoshells, followed by original nanorose, and was less for Cy5 conjugated nanoparticles, and least for Cy5 molecules (Table 3). These results are consistent with the interpretation that luminescence increases when gold nanoparticles cluster because the overall surface of gold per nanoparticle increases (weight of gold per nanoparticle was greater for nanoshells compared to original nanoroses). However, when the brightness per gram of material was compared, the fluorescent dyes were more intense than nanoshells and original nanoroses, the intensity for the latter two being similar (Table 3). 3.4.Time-Dependent Uptake of Nanoshells and Original Nanoroses by MacrophagesTo further verify that gold nanoparticles gain luminescence after clustering, confocal imaging was performed to follow the accumulation of nanoshells and original nanoroses inside macrophages over time. Macrophages were incubated with nanoparticles and examined after 1, 4, and 24 h (Fig. 5). After the first hour of incubation, DIC imaging revealed no evidence of intracellular nanoparticles. Consistent with the phantom studies, individual nanoshells demonstrated luminescence without clustering, while the original nanorose did not. After 4 h, DIC imaging suggested that both nanoparticles had been internalized by macrophages, and there was a marked increase in the corresponding luminescence brightness. Similar results were obtained after 24 h, with greater visible luminescence intensity per macrophage for nanoshells compared to original nanoroses, as quantified in Table 3. 3.5.Luminescence of Different Nanoroses with Varying Gold and Ironoxide CompositionTo determine if the luminescence of the original nanorose could be enhanced by altering the consistency of the gold coating and its thickness, two sister nanoparticles were synthesized and examined. Representative drawings of the three different nanoroses are shown in Fig. 6, and their characterization and synthesis is compared in Tables 4 and 5. Descriptive names for these nanoparticles include thin knobby for the original nanorose, thin round for the more consistent thin gold coating, and thick knobby for the increased gold mass. Specifically, thin knobby (original nanorose) consists of more densely packed 5-nm iron oxide clusters with a variable gold coating. Thin round has a less densely packed iron oxide core and surface deposition of a more consistent thin layer of gold, coated with 20 kDa PEG. Thick knobby contains the greatest mass of gold per nanoparticle of the nanoroses, has a similar density of 5-nm iron oxide clusters to the thin round, and with a diameter of , is the largest nanorose. Thick knobby is also coated with 20 kDa PEG polymer in contrast to the original nanorose, which is coated with dextran. The NIR shift and single photon luminescent signal is due to the gold coating, and not the iron oxide core or its density, and not due to PVA, dextran, citric acid, and/or PEG. The more gold on the surface of the nanoroses, the greater the NIR shift. Fig. 6The upper panel are TEM images of typical original nanoroses (thin knobby, left); thin round (middle) and thick knobby (right). The lower panel is a schematic drawing of composition and relative size of the nanoroses. 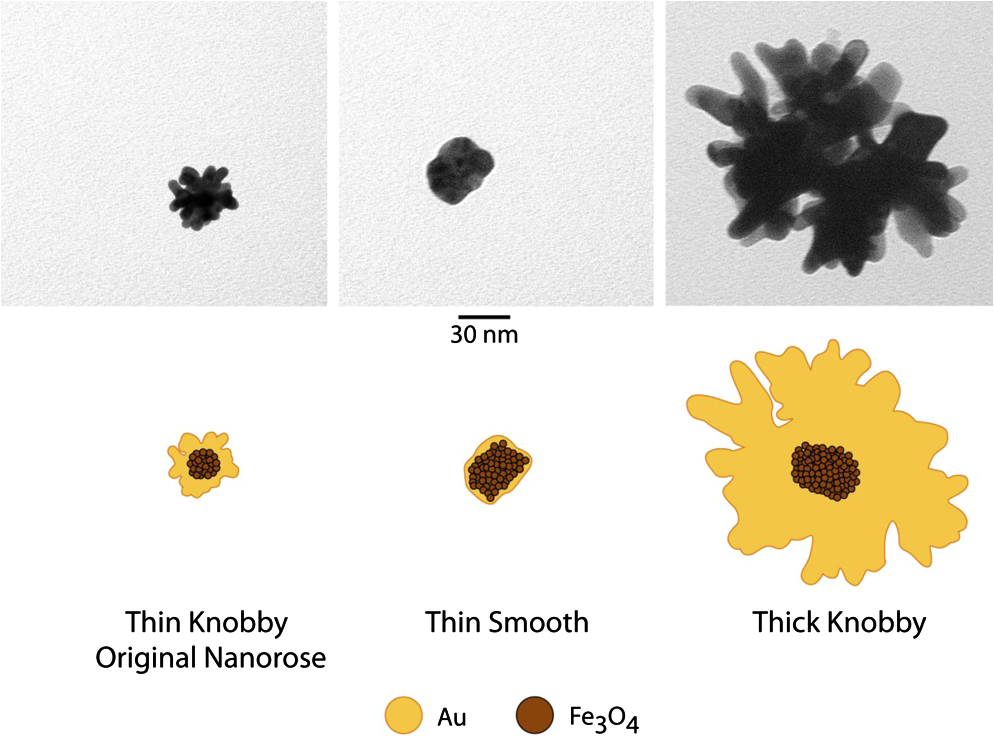 Table 4Differences in synthesis of thin knobby (original nanoroses), thin round and thick knobby.
PEG-SH—thiol reactive polyethilenglycol, PVA—poly vinyl alcohol, and MW–molecular. Table 5Characterization of different iron oxide-gold nanoclusters (nanoroses).
All three nanorose extinction spectra tune to the NIR, with maximal extinction for thin round at 600 nm, thin knobby (original nanorose) at 700 nm, and thick knobby at 850 nm. As shown in Fig. 7 and Table 6, thin round and the original nanoroses (thin knobby) were taken up similarly by macrophages ( versus ), but thick knobby to a lesser extent, (, ANOVA). All three nanoroses demonstrated similar peaks of luminescent emissions at 650 to 670 and 745 to 760 nm but different intensity (Fig. 7). Figures 7(b) and 7(d) compare the relative luminescence of the three nanoroses, and demonstrates that the thinner consistent gold shell of the thin round generated greater luminescence intensity than the thick knobby with the greatest mass of gold per nanorose nanoparticle, or the thin knobby (original nanorose) with variation in the thin gold coating (, ANOVA). Thick knobby produces less luminescence because 1. there are fewer per macrophage ( versus —thin knobby—and —thin round), and 2. their extinction maximum was farthest from the excitation wavelength of 635 nm. In contrast, the extinction maximum of thin round has been tuned to 600 to 650 nm, which coincides with laser excitation wavelength. Fig. 7Comparison of the three varieties of nanoroses. (a) DIC and confocal images of the thick knobby and thin round in macrophage culture, with original nanorose (thin knobby) shown in Figs. 3 and 5. (b) Quantitative comparison of luminescence intensity of the three nanoroses, average spectrum from Fig. 7(d). (c) Extinctionspectrum of thin round, thick knobby and thin knobby (original nanoroses). (d) Maximum luminescence from individual experiments in A. M1 firstluminescence peak at 650 to 670 nm, M2 is the second luminescence peak at 745 to 760 nm. .  Table 6Luminescent intensity of different types of nanoroses. 4.DiscussionThe major findings of the current study include: 1. two peaks of luminescent emission in response to excitation by a 635 nm laser: 650 to 670 and 745 to 760 nm, the first peak similar to Cy5 fluorescent dye, and the second peak not observed with Cy5 and specific to gold; 2. nanoshells produce luminescent signal without clustering due top re-existing clustered gold on the surface of each nanoparticle, while nanoroses and nanorods produce luminescence only if clustered in gels and macrophages; 3 per gram of material, brightness of original nanoroses (thin knobby) and nanoshells are similar, but Cy5 conjugated nanoparticles are an order of magnitude brighter; 4. per nanoparticle, nanoshells are 25 times brighter than original nanoroses, but the nanoroses are eight times brighter than Cy5 conjugated nanoparticles; and 5. greater gold luminescence is present when increased gold mass per nanoparticle is clustered on the surface (nanoshells) and when thinning of the nanorose gold coating in a consistent manner (thin round) is achieved. There appears to be a contradiction between two conclusions: greater gold luminescence is achieved when increased gold mass per nanoparticle is clustered on the surface (nanoshells) and when thinning of the nanorose gold coating in a consistent manner (thin round) is achieved. However, closer examination provides an explanation. First, the nanoshells’ surface is composed of a series of 1- to 2-nm spherical deposits of gold, which itself is a clustering of gold. Second, the increased luminescence is not due to the increased mass of gold per se, but rather the organization of the surface gold. For instance, thick knobby nanorose has the highest mass of gold among the nanoroses, but had the same brightness per nanoparticle as thin round nanoroses. Complicating these conclusions is that luminescent brightness is, in part, dependent upon the wavelength of maximum extinction of the nanoparticles. The inability of thick knobby to increase its luminescence is also due, in part, to its maximum absorption being shifted further away from the excitation wavelength of 635 nm, toward the NIR (maximum at 850 nm). The enhancement of luminescence observed for the nanoroses when the gold surface coating was thinned in a symmetrical fashion (thin round) was an unexpected finding. The mechanism of luminescence with the first observed emission maximum (650 to 670 nm) can be explained by interband transitions of free electrons,14,15 the amplitude of which is proportional to the size of spherical nanoparticles.1,28 Luminescence in the visible wavelength range (500 to 700 nm) has been previously observed from smooth and rough surfaces of noble metal films.15 The mechanism underlying the second observed emission with a maximum at 745 to 760 nm is likely due to an intraband electron transition,14,15 which is dependent upon aggregation of gold, a mechanism distinct from that for the 650 to 670 emission. An alternative explanation for the second peak, based upon investigations with nanorods, is metal–molecule charge-transfer interaction.14 We believe that our observation of two distinct emission peaks for gold nanoparticles is a novel finding. For instance, Beversluis et al. (Ref. 15) excited 15 nm gold tips at 390 nm and observed fluorescence from visible to the NIR, but did not observe two distinct peaks.15 Gold nanoclusters (nanoroses) have been developed by our group to target macrophages with the goal of providing contrast enhancement for NIR optical imaging applications. The ultimate goal is the identification of macrophages in plaque because increased macrophage content in advanced lesions is associated with plaques prone to rupture and increase risk of heart attacks and strokes. Of all the nanoparticles examined, the one that has the greatest clinical applicability is the thin round nanorose, due to its combination of a symmetrical gold surface and ideal size. Nanoshells have the greatest luminescence of all gold nanoparticles examined both per nanoparticle and when engulfed in macrophages. However, nanoshells are so large that they are removed too quickly by the reticulo-endothelial system to allow prolonged residence in the circulation for plaque-based macrophage uptake. Thus, the ideal gold nanoparticle would have a symmetrically clustered, consistent gold surface similar to nanoshells, but a reduced diameter per nanoparticle of 30 to 50 nm. The size reduction will allow adequate time in the circulation following intravenous injection for uptake by plaque-based macrophages, to enhance aggregation and luminescence signal above the background noise of the free nanoparticles that remain in the bloodstream. Cy5 conjugated iron oxide nanoparticles have an order of magnitude greater uptake by macrophages than nanoroses. However, Cy5 has a single emission frequency of 650 to 670 nm, which will be problematic because other plaque components, such as Lipofuscinand red blood cells, themselves maybe competing materials (although this issue could also be resolved with Cy7 or other 800 nm dyes). Thus, the second emission peak at 745 to 760 nm unique to gold will be important both for identification of nanoparticles in intact tissues and, ultimately, in application to patients with vulnerable plaques. Further, one Cy5 conjugated iron oxide nanoparticle produced less luminescence than a single original nanorose (Table 3). The similar brightness of both the Cy5 conjugated nanoparticle and original nanorose per macrophage is explained by the improved uptake of the Cy5 conjugated nanoparticle compared to nanoroses (Table 3). However, increasing the number of Cy5 molecules on a single iron oxide nanoparticle, which has three, has not been accomplished to date. In contrast, gold nanoroses and nanoshells offer greater flexibility because they can be tuned to enhance optical properties, including reflectance, luminescence efficiency, and SPR absorption peak, by altering how the gold is deposited on the surface of the nanoparticle. Another advantage nanoroses and nanoshells have over Cy5 conjugated iron oxide nanoparticles is their photostability under laser excitation. Cy5 is known to photobleach.29 Resistance of gold nanoparticles in cells or in phantoms to photobleaching was first reported by He and Zhang.1,13 We confirmed the photostability of nanoroses using the photobleaching mode of the Zeiss (510NLO Axiovert 200) confocal microscope, and were unable to detect any loss of fluorescent signal from nanoroses in macrophage culture over weeks of time. There were several limitations to the current study. First, nanorods/600 did not possess a coating that would enhance macrophage uptake. Thus, their poor performance in luminescence brightness in macrophage culture [Figs. 3(a) and 3(b)] yet excellent brightness in the phantoms may be due, inpart, to insufficient uptake. Second, the size of both the Cy5 conjugated iron oxide nanoparticles and the Cy5 molecules were below the resolution of our TEM. Thus, we were unable to determine the number of these particles/molecules in cultured macrophages. Instead, the literature was used for these determinations, which does not include a standard deviation. Our statistical comparisons with nanoshells, and the nanoroses were, thus, limited to student -tests, which prevented the use of more robust statistical comparisons such as ANOVA. Finally, the high luminescence of nanoshells is causing them to be visible whereas the others nanoparticles are not bright enough—and not necessarily luminescent only on clustering. In conclusion, enhancement of gold luminescent emission per macrophage relevant for improving contrast in NIR optical imaging applications can be achieved by reducing the thickness of the gold coating in a consistent manner, tuning the maximum extinction of the nanoparticle to the stimulating laser wavelength, or clustering the gold on the surface of the nanoparticles (nanoshells), or by clustering the gold nanoparticles themselves. AcknowledgmentsThe authors would like to thank Hunter Barbara for assistance with TEM imaging and cell culture processing. Confocal images were generated in the Core Optical Imaging Facility, which is supported by UTHSCSA, NIH-NCI P30 CA54174 (CTRC at UTHSCSA) and NIH-NIA P01AG19316.The current study was supported by Veterans Administration Merit Grant, and NIH NRSA Grant #HL07446. ReferencesH. HeC. XieJ. Ren,
“Nonbleaching fluorescence of gold nanoparticles and its applications in cancer cell imaging,”
Anal. Chem., 80
(15), 5951
–5957
(2008). http://dx.doi.org/10.1021/ac8005796 ANCHAM 0003-2700 Google Scholar
S. W. TsaiY. Y. ChenJ. W. Liaw,
“Compound cellular imaging of laser scanning confocal microscopy by using gold nanoparticles and dyes,”
Sensors, 8
(4), 2306
–2316
(2008). http://dx.doi.org/10.3390/s8042306 SNSRES 0746-9462 Google Scholar
R. Hardman,
“A toxicologic review of quantum dots: toxicity depends on physicochemical and environmental factors,”
Environ. Health Perspect., 114
(2), 165
–172
(2006). Google Scholar
L. W. ZhangN. A. Monteiro-Riviere,
“Mechanisms of quantum dot nanoparticle cellular uptake,”
Toxicol. Sci., 110
(1), 138
–155
(2009). TOSCF2 1096-6080 Google Scholar
F. Erogbogboet al.,
“Biocompatible magnetofluorescent probes: luminescent silicon quantum dots coupled with superparamagnetic iron(iii) oxide,”
ASC Nano., 4
(9), 5131
–5138
(2010). http://dx.doi.org/10.1021/nn101016f 1936-0851 Google Scholar
D. P. Lyverset al.,
“Gold nanorod arrays as plasmonic cavity resonators,”
ACS Nano., 2
(12), 2569
–2576
(2008). http://dx.doi.org/10.1021/nn8006477 1936-0851 Google Scholar
J. M. NamS. I. StoevaC. A. Mirkin,
“Bio-bar-code-based DNA detection with pcr-like sensitivity,”
J. Am. Chem. Soc., 126
(19), 5932
–5933
(2004). http://dx.doi.org/10.1021/ja049384+ JACSAT 0002-7863 Google Scholar
S. Kumaret al.,
“Plasmonic nanosensors for imaging intracellular biomarkers in live cells,”
Nano. Lett., 7
(5), 1338
–1343
(2007). http://dx.doi.org/10.1021/nl070365i NALEFD 1530-6984 Google Scholar
S. KumarJ. AaronK. Sokolov,
“Directional conjugation of antibodies to nanoparticles for synthesis of multiplexed optical contrast agents with both delivery and targeting moieties,”
Nat. Proto., 3
(2), 314
–320
(2008). Google Scholar
A. Mooradia,
“Photoluminescence of metals,”
Phys. Rev. Lett., 22
(5), 185
–187
(1969). http://dx.doi.org/10.1103/PhysRevLett.22.185 PRLTAO 0031-9007 Google Scholar
J. XieY. ZhengJ. Y. Ying,
“Protein-directed synthesis of highly fluorescent gold nanoclusters,”
J. Am. Chem. Soc., 131
(3), 888
–889
(2009). http://dx.doi.org/10.1021/ja806804u JACSAT 0002-7863 Google Scholar
C. T. Yuanet al.,
“Single fluorescent gold nanoclusters,”
Opt. Express, 17
(18), 16111
–16118
(2009). http://dx.doi.org/10.1364/OE.17.016111 OPEXFF 1094-4087 Google Scholar
J. ZhangY. FuJ. R. Lakowicz,
“Luminescent images of single gold nanoparticles and their labeling on silica beads,”
Opt. Express, 15
(20), 13415
–13420
(2007). http://dx.doi.org/10.1364/OE.15.013415 OPEXFF 1094-4087 Google Scholar
S. EustisM. El-Sayed,
“Aspect ratio dependence of the enhanced fluorescence intensity of gold nanorods: experimental and simulation study,”
J. Phys. Chem. B., 109
(34), 16350
–16356
(2005). http://dx.doi.org/10.1021/jp052951a JPCBFK 1520-6106 Google Scholar
M. R. BeversluisA. BouhelierL. Novotny,
“Continuum generation from single gold nanostructures through near-field mediated intraband transitions,”
Phys. Rev. B., 68
(11), 1154331
–11543310
(2003). http://dx.doi.org/10.1103/PhysRevB.68.115433 PRBMDO 0163-1829 Google Scholar
S. EustisM. A. El-Sayed,
“Why gold nanoparticles are more precious than pretty gold: noble metal surface plasmon resonance and its enhancement of the radiative and nonradiative properties of nanocrystals of different shapes,”
Chem. Soc. Rev., 35
(3), 209
–217
(2006). http://dx.doi.org/10.1039/b514191e CSRVBR 0306-0012 Google Scholar
H. S. Choiet al.,
“Renal clearance of quantum dots,”
Nat. Biotechnol., 25
(10), 1165
–1170
(2007). http://dx.doi.org/10.1038/nbt1340 NABIF9 1087-0156 Google Scholar
L. L. Maet al.,
“Small multifunctional nanoclusters (nanoroses) for targeted cellular imaging and therapy,”
ACS Nano., 3
(9), 2686
–2696
(2009). http://dx.doi.org/10.1021/nn900440e 1936-0851 Google Scholar
Z. Jianet al.,
“Fluorescence spectrum properties of gold nanochains,”
Phys. E: Low-dimensional Syst. Nanostruct., 25
(1), 114
–118
(2004). http://dx.doi.org/10.1016/j.physe.2004.06.058 Google Scholar
C. Looet al.,
“Nanoshell-enabled photonics-based imaging and therapy of cancer,”
Tech. Can. Res. Treat., 3
(1), 33
–40
(2004). TCRTBS 1533-0346 Google Scholar
Y. Sahooet al.,
“Aqueous ferrofluid of magnetite nanoparticles: fluorescence labeling and magnetophoretic control,”
J. Phys. Chem. B., 109
(9), 3879
–3885
(2005). http://dx.doi.org/10.1021/jp045402y JPCBFK 1520-6106 Google Scholar
D. G. DuffA. BaikerP. P. Edwards,
“A new hydrosol of gold clusters .1. Formation and particle-size variation,”
Langmuir, 9
(9), 2301
–2309
(1993). https://doi.org/http://dx.doi.10.1021/la00033a010 LANGD5 0743-7463 Google Scholar
N. R. JanaL. GearheartC. J. Murphy,
“Seed-mediated growth approach for shape-controlled synthesis of spheroidal and rod-like gold nanoparticles using a surfactant template,”
Adv. Mater., 13
(18), 1389
–1393
(2001). http://dx.doi.org/10.1002/(ISSN)1521-4095 ADVMEW 0935-9648 Google Scholar
B. Bennett,
“Isolation and cultivation in vitro of macrophages from various sources in mouse,”
Am. J. Pathol., 48
(1), 165
–181
(1966). AJCPAI 0002-9173 Google Scholar
E. DavenasB. PoitevinJ. Benveniste,
“Effect on mouse peritoneal-macrophages of orally-administered very high dilutions of silica,”
Eur. J. Pharm, 135
(3), 313
–319
(1987). http://dx.doi.org/10.1016/0014-2999(87)90680-7 EJPHAZ 0014-2999 Google Scholar
J. Lucocq,
“Quantitation of gold labelling and antigens in immunolabelled ultrathin sections,”
J. Anat., 184
(Pt. 1), 1
–13
(1994). JOANAY 0021-8782 Google Scholar
A. MooreR. WeisslederA. Bogdanov,
“Uptake of dextran-coated monocrystalline iron oxides in tumor cells and macrophages,”
JMRI, 7
(6), 1140
–1145
(1997). Google Scholar
S. Kleinet al.,
“Quantitative visualization of colloidal and intracellular gold nanoparticles by confocal microscopy,”
J. Biomed. Opt., 15
(3), 0360151
–03601511
(2010). http://dx.doi.org/10.1117/1.3461170 JBOPFO 1083-3668 Google Scholar
C. Y. DengJ. M. LiW. Y. Ma,
“Detection of fret efficiency in imaging systems by photo-bleaching acceptors,”
Talanta, 82
(2), 771
–774
(2010). http://dx.doi.org/10.1016/j.talanta.2010.05.051 TLNTA2 0039-9140 Google Scholar
|