|
|
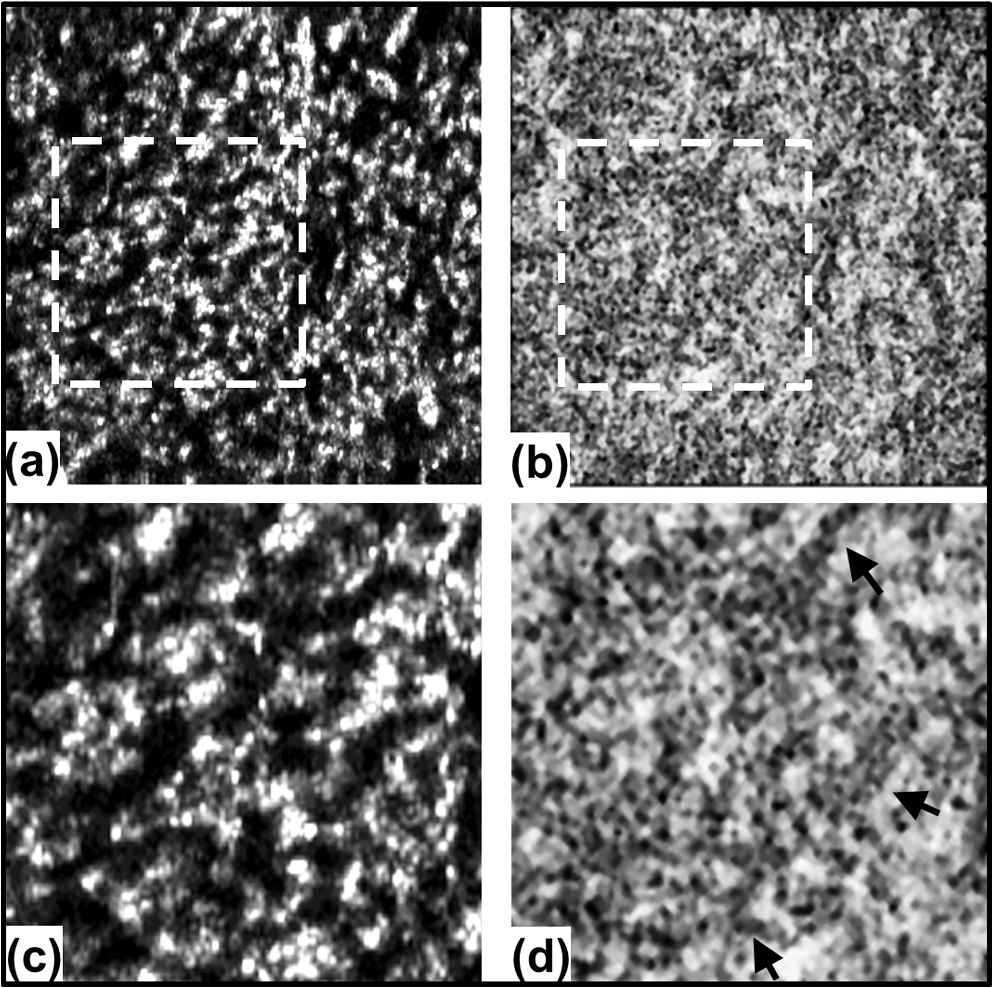
1.IntroductionRecent studies suggest the importance of imaging the retinal and choroidal vasculature networks in diagnosing various eye diseases such as age-related macular degeneration1 and diabetic retinopathy.2 Color fundus photography (CF) and fluorescein angiography (FA) have served as the gold standard methods for imaging the retinal vasculature network.3 Indocyanine green angiography (ICGA) extends such imaging to the deeper choroidal vessels.3 However, these imaging techniques are limited by the two-dimensional (2D) nature of the images they collect (lacking depth information) and/or their inability to capture the deep choroidal blood vessels. To meet the need for three-dimensional (3D) assessment of retinal and choroidal vasculature without the use of fluorescent dye injection, optical coherence tomography (OCT) has emerged as an attractive depth-resolved imaging technology.4 By capturing interferograms of the light reflected back from the retina, OCT offers 3D visualization of retinal structure5 and vasculature.6 By collecting more than one A-scan or B-scan of the same retinal loci, it is possible to calculate the phase shift or phase variance needed for Doppler OCT (D-OCT)7 or phase contrast (PC)-OCT,8 respectively. D-OCT captures regions of high-velocity blood flow, such as in major vessels. However, the limited phase sensitivity, orientation sensitivity, and small time separation between A-scans of D-OCT limit its ability to capture slow flows in retinal capillaries7 or deep flows in the choroidal circulation. Several methods have been developed to enhance the sensitivity of OCT to the smaller signals expected from the microvasculature by increasing the time separation between two OCT depth scans and relying on the acquired phase8 or joint intensity and phase information9,10 of 800-nm spectral domain (SD)-OCT signals for contrast. The proposed motion contrast method in Wang et al.10 can visualize the microvasculature using Hilbert and Fourier analyses of the OCT signal; however, these also highlight highly reflective stationary regions. 2D Fourier analysis of the OCT signals along the wave number and time axes can provide structural and motion information for mapping the blood flow velocity within retinal capillaries.9 Our previous work captured the retinal microvasculature by collecting several phase change tomograms and finding the region of motion from variance analysis.8 However, in each of these tools, the inner choroid was not captured well using phase contrast SD-OCT at 800 nm due to its shallow penetration depth and sensitivity roll-off. There is an important need for OCT systems with the required imaging depth and phase sensitivity for capturing retinal and choroidal microvasculature. To enhance imaging as deep as the choroid, 1-μm Fourier domain OCT has been suggested as a preferred technology. Images collected by SD-OCT at 1 μm can delineate the multiple choroidal layers and capture the choroidal vessels distribution, size, density,11 and blood perfusion.12 Retinal and choroidal vasculature has also been imaged with an elegant dual-beam SD-OCT system, capturing the effective frequency shift between two detected OCT signals at 1020 nm.13 However, the system’s complexity, cost, and 3-dB sensitivity loss may limit its clinical application. Superior detection efficiency and sensitivity roll-off performance of swept source (SS)-OCT make this Fourier domain method more attractive than SD-OCT for choroidal visualization. In fact, an SS-OCT at 1.3 μm shows the power of the phase contrast method to capture deep vasculature in the brain and in tumors;14 however, the significant absorbance of 1.3-μm light by the vitreous limits the use of this approach for retinal and choroidal vasculature imaging. To combine superior penetration depth and depth sensitivity, we have developed an SS-OCT1060-nm system with the needed phase sensitivity and scan speed to capture phase variance data from the retina and inner choroid. 2.Materials and MethodsDifferential phase contrast (DPC) is a general term applied to any phase-based motion contrast method that relies on multiple phase measurements for calculating phase differences between multiple depth scans obtained over the same transverse location. Motion contrast was achieved in this paper, as in our previous work,8 by measuring the phase difference between successive B-scans. We removed one of the inherent phase error sources in SS-OCT by eliminating timing-induced phase error.15 Two different DPC methods were implemented for assessing the retinal microvasculature and regions of motion in the inner choroid: power Doppler phase shift (PDPS)13 and differential phase variance (DPV).8 Comparisons of the two techniques show that both can capture the foveal avascular zone (FAZ) and image the choroidal vasculature; however, DPV better visualized the FAZ border in en-face views. To perform 1-μm DPC SS-OCT imaging, we constructed a 50-kHz SS-OCT system, incorporating a polygon-based 1060-nm (1015 to 1103) swept source,16 with axial resolution in tissue and 102-dB sensitivity (1.2-mW incident power). The 50-kHz SS-OCT system had 6 dB of sensitivity roll-off at . The SS-OCT system was comprised of a polygon-based swept-laser source,16 an interferometer, and a data acquisition (DAQ) unit (Fig. 1). The swept source output was coupled to the interferometer through an isolator where a coupler was used to split light into a sample arm:reference arm. The sample arm light was split equally between the calibration arm and a slit lamp biomicroscope (Carl Zeiss Meditec) as shown in Fig. 1. A coupler combined and directed the reflected light from the sample to one port of the interferometer output coupler. The reference arm light passed through a pair of collimators and was directed to the second port of the interferometer output coupler. The resulting interference fringes were detected on both output ports using a dual-balanced photodetector. To generate a trigger signal at the beginning of the first interference fringe for data acquisition, a portion of the reference arm light was directed to a three-port circulator and a fiber Bragg grating. A reflected optical pulse was detected using a photodetector and converted into an electronically tunable TTL signal as a trigger signal. The spectral signals were continuously digitized by triggering an AD conversion board. A D/A board was used to generate the driving signals of the two-axis galvanometers. A user interface and data acquisition software were developed in LabView to coordinate instrument control and enable user interaction. This SS-OCT system was used for imaging on a healthy volunteer, using a protocol approved by the Caltech Committee for the Protection of Human Subjects. Total exposure time and incident exposure level were kept at less than 5.5 sec and 1.2 mW in each imaging session consistent with safe exposure determined by the American National Standards Institute (ANSI). The patient interface was based on a commercial OCT system (Carl Zeiss Meditec) adapted with optics to support the 1060-nm wavelength range. A 60-D lens at the exit of the fundus camera provided a beam diameter of 1.5 mm on the cornea resulting in transverse resolution for imaging. Fig. 1Schematic of a polygon-based swept-laser source, interferometer, and SS-OCT data acquisition unit used for imaging. SOA, semiconductor optical amplifier; diffraction grating (); telescope (, ); polygonal scanning mirrors (72 facets); COL, collimator; PC, polarization controller; ISO, isolator; CIRC, circulator; CUP, coupler; PD, photodetector; BD, dual-balanced photodetector (InGaAs, 80 MHz); FBG, fiber Bragg grating (0.1 nm). Data acquisition unit comprising an AD conversion board (14-bit, GaGeCompuScope 14,200) for digitizing interference fringes and a D/A board (16 bit, National Instruments) for driving scanning mirrors (Cambridge Technology).  To compare DPC methods for retinal/choroidal visualization, we calculated DPV and PDPS. DPV captured the differences between multiple phase measurements [] of the same transverse points (separated in time) and calculated the statistical variance of these phase changes. PDPS was realized by calculating the square of the difference between two phase measurements of the same transverse point acquired in two successive B-scans over the same slice. Timing-induced phase error,15 bulk motion, and noise15 are three independent sources of phase change [] inaccuracy in a phase-sensitive SS-OCT image at a given depth between two successive A- (or B-)scans, where denotes the scan number and SNR signal-to-noise ratio: To measure and remove timing-induced phase error (second term) due to the random delay between the trigger signal and the subsequent A-to-D conversion (sample clock), a calibration signal was generated using a stationary mirror in the calibration arm (Fig. 1) as described in Vakoc et al.15 The calibration signal was located at a depth of 2 mm in the OCT intensity image. The corrected phase differences between adjacent A- (or B-)scans at a given depth were calculated by subtracting the phase difference of the calibration signal, linearly scaled with the sample signal depth, from the measured phase differences.15Phase unwrapping was performed on all measurements,15 including 1. phase difference calculation and 2. subtractions applied for timing-induced phase error correction and bulk motion removal. A weighted mean algorithm17 estimated and removed the bulk axial motion phase change error (third term). To remove SNR-limited phase change errors with variance () greater than , an average intensity threshold (10 dB above the mean value of the noise floor) was applied; all phase differences between two B-scans with average were set to zero in the DPC image. After timing-induced phase error correction14 and bulk motion removal,17 the DPV is given by which is a surrogate marker for the motion of interest from the scatterers located at the depth . shows the residual noise variance in the DPV and is negligible in comparison with the first term.To compare in vivo retinal and choroidal visualization using PDPS SS-OCT between two A-scans (20-μs time separation) and two B-scans (100-ms separation) over the same 2D cross-section, we acquired horizontal tomograms with 4000 axial scans spanning 10 mm of the fovea centralis. To decrease decorrelation phase noise in PDPS between two A-scans, transverse spacing between two successive A-scans was set to 2.5 μm. SS-OCT speed (50,400 Hz), transverse spacing (2.5 μm), transverse scan range (10 mm), and fly-back time of the scanner determined 100-ms time separation. The phase differences between two A-scans and B-scans were calculated after phase error correction15 and bulk motion removal.17 An average intensity threshold (10 dB above the mean value of the noise floor) was only applied to phase differences between two B-scans. In order to differentiate the retina and choroid from surrounding areas in 2D Doppler tomogram [Fig. 2(b)], the average intensity threshold was not applied to phase differences between two A-scans. 3.ResultsFigures 2(a)–2(c) show the average intensity of four sequential B-scans, PDPS between two A-scans [], and PDPS between two B-scans [] horizontal tomograms of an in vivo human retina and choroid over the same slice, respectively. Since , it is dependent on the flow velocity (), illumination angle (), and time separation between two measurements (). Therefore, the small time separation (20 μs) and realizable phase sensitivity limit the measured PDPS between two A-scans [] to capture regions of slow motion in the small vessels [Fig. 2(b), dark regions in the inner retina and choroid]. However, PDPS measurements between two B-scans [] provide enough time separation () for highlighting regions of motion in the choroid [white arrow, Fig. 2(c)]. The increased time separation between two successive B-scans () increases Doppler phase shift for slow flow detection. However, it also introduces stronger motion artifacts due to displacements. In order to capture microvasculature and the region of motion in 2D tomograms using DPC methods, was set to 5 ms to suppress motion artifacts. To generate 2D PDPS and DPV tomograms, four B-scans of a single slice through the retina were acquired with 201 axial scans spanning over 2 mm for at the 50-kHz A-line rate. A PDPS tomogram was created by calculating the square of the difference between two phase measurements of the same loci in the first and second B-scans. All four B-scans were used for capturing phase differences between successive B-scans and calculating the DPV (the statistical variance of these phase changes). The same algorithms15,17 described above for removing the phase change error were applied. Figures 3(a) and 3(b) show the averaged intensity of four B-scans [Fig. 3(a)], PDPS between two B-scans [Fig. 3(b)], and DPVs of four B-scans [Figs. 3(c) and 3(d)] before and after phase error compensation15,17 over the same 2-mm transverse scan range, respectively. It is clear that regions of motion in the inner choroid as well as the flat small vessels bed in the retina [white arrows, Figs. 3(b), and 3(d)] are still detectable by decreasing from 100 ms to 5 ms, while motion artifact suppression enhances microvasculature detectability. Figures 3(c) and 3(d) also highlight the importance of timing and bulk motion correction algorithms. Fig. 3Foveal (a) averaged intensity and (b) PDPS between two B-scans (of four B-scans, ) tomograms (2 mm). Foveal DPV (of four B-scans, ) tomograms (2 mm) (c) before and (d) after timing-induced and bulk-motion phase error compensation. White regions correspond to regions with higher reflectivity and motion in Figs. 3(a), 3(b), and 3(d). 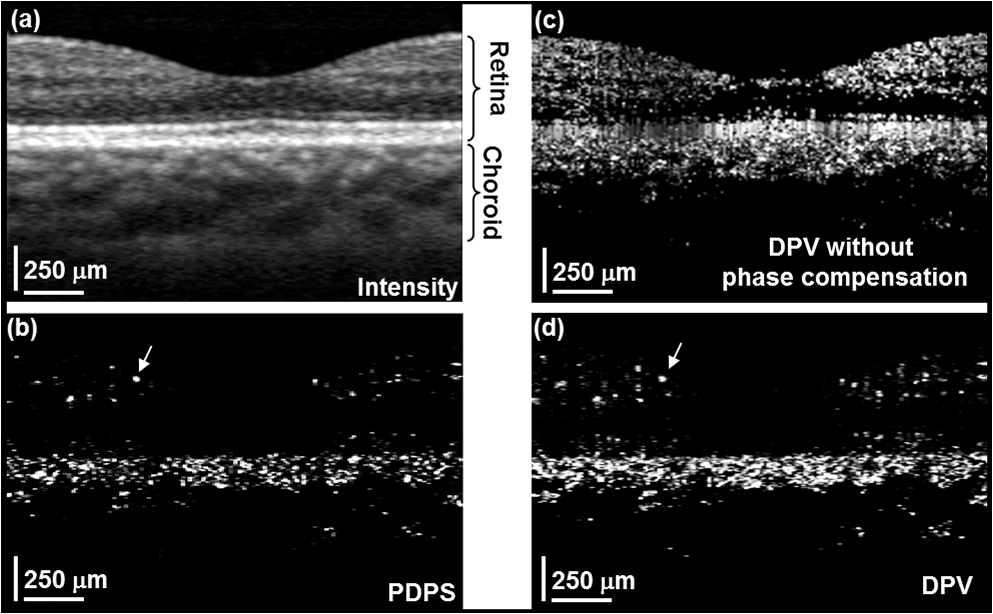 To visualize the capillary meshwork of the inner retina and the region of motion in the choroid using PDPS and DPV methods, a 3D OCT data set was collected by acquiring several neighboring B-scans. The system magnification, SS-OCT speed (50,400 Hz), speed of the fast-scan axis (200 Hz) with fly-back time (1 ms), and data acquisition time (4 sec) gave an image size of over a field of view (FOV); each B-scan was repeated four times. To generate the retinal and choroidal en-face views, the Bruch’s membrane contour, inner/outer photoreceptor segments (IS/OS), and vitreoretinal interface were detected using a segmentation algorithm.6 Figures 4(a)–4(c) illustrate the inverted linear intensity, PDPS between two successive B-scans, and DPV en-face views generated by integrating the intensities, PDPSs, and DPVs between the region 30 μm posterior to the vitreoretinal interface and the region 130 μm anterior to IS/OS. Blood vessels in the ganglion cell layer and capillary meshwork of the inner plexiform layer are visualized in the inverted PDPS and DPV en-face views [Figs. 4(b) and 4(c)], but they are barely visible in the inverted linear intensity en-face view [Fig. 4(a)]. The FAZ is resolvable by considering the capillary network around it as shown in the DPV image in Fig. 4(c). Although the DPV image [Fig. 4(c)] achieved enhanced contrast for foveal vasculature visualization compared to the PDPS image [Fig. 4(b)], it requires a faster OCT system to capture the same FOV due to its need for multiple B-scans. Fig. 4Foveal depth-integrated en-face views over FOV acquired in 4 sec. Inverted (a) linear intensity, (b) PDPS, and (c) DPV en-face images of the inner retina.  To show the capillary meshwork of the inner retina through depth, inverted DPV en-face views were generated by integrating the DPVs at different depths. Figure 5(a) shows the capillary network of the inner retina between the regions 255 and 216 μm anterior to IS/OS. Retinal microvasculature was also detected between the regions 216 and 169 μm anterior to IS/OS [Fig. 5(b)]. Figures 5(a) and 5(b) clearly reveal depth-related variations of capillary meshwork morphology through the inner retina. Fig. 5Foveal depth-integrated en-face views over the FOV acquired in 4 sec. Inverted DPV, en-face images of the retina between the regions (a) 255 and 216 μm anterior to inner/outer photoreceptor segments (IS/OS) and (b) 216 and 169 μm anterior to IS/OS.  To depict structure and regions of motion in the inner choroid, the depth-integrated intensity and DPV en-face images were generated by summing intensities and DPVs over a 25-μm thickness located 25 μm beneath Bruch’s membrane contour in the Sattler’s layer (SL) [Figs. 6(a) and 6(b)]. SL structure and regions of motion are visualized in the linear intensity [Figs. 6(a) and 6(c)] and inverted DPV [Figs. 6(b) and 6(d)], respectively. Parts of interconnected vessel networks in the choroid (dark regions, black arrows) are discernible in Figs. 6(b) and 6(d). While DPV is able to capture the inner retina vessels [Figs. 4(c), 5(a), and 5(b)], multiple scattering degrades DPV contrast for SL vessels visualization [Figs. 6(b) and 6(d)]. 4.ConclusionsIn summary, we have demonstrated the use of a high-speed SS-OCT system (50-kHz line rate) at the 1-μm wavelength region to provide enhanced penetration depth for human retinal and choroidal vasculature visualization. Our results show the potential application of depth-resolved DPC methods for replacing invasive FA and ICGA in the future. While the DPV method enables us to visualize and detect small vessels and capillaries in the inner retina, the blood vessels in the inner choroid are obscured in the DPV image due to multiple scattering. It is also possible that the long-time separation between B-scans causes multiple phase wrapping and Doppler signal randomization and degrades phase contrast for blood vessel visualization in highly dense vascular regions such as the inner choroid. This demonstrates the need for tailoring the optimal time separation between B-scans for capturing blood vessels in the choriocapillaris and SL in various posterior regions of the retina. AcknowledgmentsThis work was supported in part by research from the California Institute for Regenerative Medicine (CIRM). The authors thank Carl Zeiss Meditec for providing the patient interface part of the OCT system. ReferencesE. Friedman,
“A hemodynamic model of the pathogenesis of age-related macular degeneration,”
Am. J. Ophthalmol., 124
(5), 677
–682
(1997). AJOPAA 0002-9394 Google Scholar
V. Patelet al.,
“Retinal blood flow in diabetic retinopathy,”
BMJ, 305
(6855), 678
–683
(1992). Google Scholar
J. M. D. Gass, Stereoscopic Atlas of Macular Diseases, 4th ed.Mosby, St. Louis, MO
(1997). Google Scholar
Optical Coherence Tomography: Technology and Applications, Biological and Medical Physics, Biomedical Engineering, Springer, Boca Raton, FL
(2008). Google Scholar
M. Wojtkowskiet al.,
“Three-dimensional retinal imaging with high-speed ultrahigh-resolution optical coherence tomography,”
Ophthalmology, 112
(10), 1734
–1746
(2005). Google Scholar
S. Makitaet al.,
“Optical coherence angiography,”
Opt. Express, 14
(17), 7821
–7840
(2006). http://dx.doi.org/10.1364/OE.14.007821 OPEXFF 1094-4087 Google Scholar
T. SchmollC. KolbitschR. A. Leitgeb,
“Ultra-high-speed volumetric tomography of human retinal blood flow,”
Opt. Express, 17
(5), 4166
–4176
(2009). http://dx.doi.org/10.1364/OE.17.004166 OPEXFF 1094-4087 Google Scholar
J. Fingleret al.,
“Volumetric microvascular imaging of human retina using optical coherence tomography with a novel motion contrast technique,”
Opt. Express, 17
(24), 22190
–22200
(2009). http://dx.doi.org/10.1364/OE.17.022190 OPEXFF 1094-4087 Google Scholar
A. Szkulmowskaet al.,
“Three-dimensional quantitative imaging of retinal and choroidal blood flow velocity using joint spectral and time domain optical coherence tomography,”
Opt. Express, 17
(13), 10584
–10598
(2009). http://dx.doi.org/10.1364/OE.17.010584 OPEXFF 1094-4087 Google Scholar
R. K. Wanget al.,
“Depth-resolved imaging of capillary networks in retina and choroid using ultrahigh sensitive optical microangiography,”
Opt. Lett., 35
(9), 1467
–1469
(2010). http://dx.doi.org/10.1364/OL.35.001467 OPLEDP 0146-9592 Google Scholar
B. Povazayet al.,
“Wide-field optical coherence tomography of the choroid in vivo,”
Invest. Ophthalmol. Vis. Sci., 50
(4), 1856
–1863
(2005). http://dx.doi.org/10.1364/OPEX.13.003252 OPEXFF 1094-4087 Google Scholar
R. K. WangL. An,
“Multifunctional imaging of human retina and choroid with 1050-nm spectral domain optical coherence tomography at 92-kHz line scan rate,”
J. Biomed. Opt., 16
(5), 050503
(2011). http://dx.doi.org/10.1117/1.3582159 JBOPFO 1083-3668 Google Scholar
F. Jaillonet al.,
“Enhanced imaging of choroidal vasculature by high-penetration and dual-velocity optical coherence angiography,”
Biomed. Opt. Express, 2
(5), 1147
–1158
(2011). http://dx.doi.org/10.1364/OE.19.001271 OPEXFF 1094-4087 Google Scholar
B. J. Vakocet al.,
“Three-dimensional microscopy of the tumor microenvironment in vivo using optical frequency domain imaging,”
Nat. Med., 15
(10), 1219
–1223
(2009). http://dx.doi.org/10.1038/nm.1971 1078-8956 Google Scholar
B. Vakocet al.,
“Phase-resolved optical frequency domain imaging,”
Opt. Express, 13
(14), 5483
–5493
(2005). http://dx.doi.org/10.1364/OPEX.13.005483 OPEXFF 1094-4087 Google Scholar
E. C. Leeet al.,
“In vivo optical frequency domain imaging of human retina and choroid,”
Opt. Express, 14
(10), 4403
–4411
(2006). http://dx.doi.org/10.1364/OE.14.004403 OPEXFF 1094-4087 Google Scholar
M. C. Pierceet al.,
“Simultaneous intensity, birefringence, and flow measurements with high-speed fiber-based optical coherence tomography,”
Opt. Lett., 27
(17), 1534
–1536
(2002). http://dx.doi.org/10.1364/OL.27.001534 OPLEDP 0146-9592 Google Scholar
|